CandleCountdown
- Göstergeler
- Sürüm: 1.0

General Description
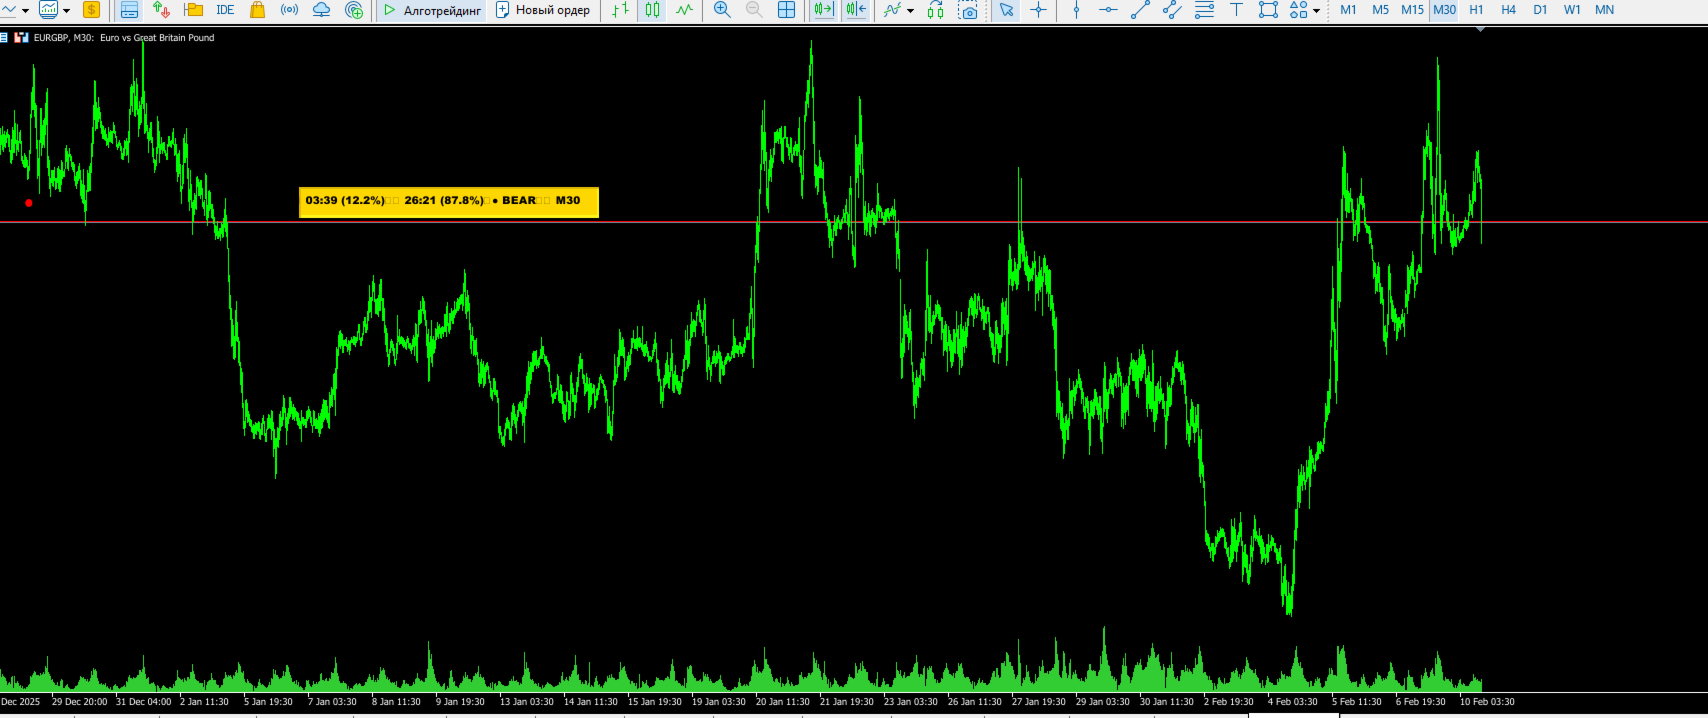
Candle Countdown is a visual indicator for MetaTrader 5 that displays the time remaining until the current candle closes in real-time. The indicator presents information panels attached to Bid and Ask lines, showing countdown timers, current candle type, and other useful information.
Key Features
1. Candle Time Display
-
Countdown Timer: Time until candle close in MM:SS format
-
Elapsed Time: Time since candle opening
-
Percentage Completion: Real-time percentage of candle completion
2. Candle Information
-
Candle Type: Identification of bullish (BULL), bearish (BEAR), or doji (DOJI) candles
-
Color Coding: Green for bullish, red for bearish, gray for doji
-
Current Timeframe: Display of active timeframe
3. Visual Features
-
Price Attachment: Panels follow Bid and Ask prices
-
Yellow Rectangles: Bright information blocks
-
Adaptive Positioning: Automatic adjustment on the chart
-
Visual Icons: ⏱ (timer), ⌛ (hourglass), ● (candle type), 📊 (timeframe)
4. Display Customization
-
Line Selection: Option to display on Bid, Ask, or both lines
-
Information Toggle: Enable/disable individual elements
-
Color Customization: Background, text, border
-
Size and Position: Width, height, offset from edge
Technical Specifications
Supported Timeframes
-
All standard MT5 timeframes: from M1 to MN1
-
Automatic time calculation for each timeframe
-
Correct display on non-standard timeframes
Data Processing
-
Real-time Updates: Updates every second via timer
-
Automatic Synchronization: Adjusts on timeframe changes
-
Stability: Error checking and boundary control
Performance
-
Minimal resource consumption
-
Optimized positioning algorithms
-
Efficient use of graphical objects