 MetaTrader 5
 エキスパート
 インディケータ
 ライブラリ
 ユーティリティ
 ウィジェット
 ルール
YouTubeにあるマーケットチュートリアルビデオをご覧ください
ロボットや指標を購入する
仮想ホスティングで
EAを実行
EAを実行
ロボットや指標を購入前にテストする
マーケットで収入を得る
販売のためにプロダクトをプレゼンテーションする方法
MetaTrader 5のための無料のエキスパートアドバイザーとインディケータ - 94
 自動売買ロボットとインジケータを使用して、外国為替取引の収益性を高めます。 自動売買ロボットを使用すると、取引の開始と終了を自動化でき、インジケータは市場の行動をより正確に予測するのに役立ちます。
このページには、MetaTrader5アプリケーションのカタログが掲載されています。

Did you ever feel irritated by manually adjusting Fibonacci retracement levels? Do you ever want to have a tool that was automatically adjust to certain Fibonacci levels with your trading? Well here is a tool for you: Fast Fibonacci indicator and Grid trader allows you to quickly adjust Fibonacci retracement levels or construct Fibonacci extension grid! You can also quickly setup your grid trading based on these levels - only with few clicks. Adjustable graphics, font sizes and graphics panels m
FREE

For more details, performance records, and strategy breakdown, please visit: [ https://eruo-grid-sniper.vercel.app ]
---
### Overview
EuroGridSniper is a fully automated Expert Advisor designed for the MetaTrader 5 platform. This EA uses a dynamic grid-based trading strategy optimized for trending and ranging market conditions. It combines technical price levels with volatility filters to increase the probability of successful trades.
---
### ️ Key Features
- Smart grid algo
FREE

TEMA Trend Matrix PRO Elite Multi-Timeframe Trend Intelligence System
Trade With Clarity. Execute With Confidence. Stop guessing the market direction. TEMA Trend Matrix PRO is a high-performance trend intelligence dashboard built for traders who demand precision, speed, and clarity. Powered by advanced Triple Exponential Moving Average (TEMA) logic, it delivers a real-time, multi-timeframe view of market structure — all in one clean interface. No more chart switching. No more conflicting
FREE

Multichart Dashboard — Your Central Command Center for Trading
The **Multichart Dashboard** Expert Advisor transforms your MetaTrader interface into a clean, professional trading hub. Manage up to **6 charts simultaneously** , switch between symbols in an instant and always stay in control — all within one compact, fully configurable panel.
What does Multichart Dashboard do?
**Up to 6 charts in parallel** — Set the desired number of charts (1–6) with a single input. All associated charts are
FREE
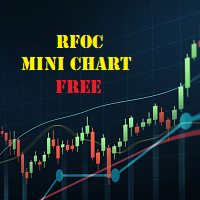
The RFOC Mini Chart was created to project a macro view of the market, which the option to select the timeframe of interest other than the main chart, it is possible to include 2 indicators: 1 - Moving average channel On the mini chart, the moving average will be created based on the prices of the selected time frame for the RFOC Mini Chart. The moving average period must be selected in the indicator settings pannel.
2 - Boillinger Band In the mini chart, a boillinger band will be created based
FREE

# MiniBull Report (v1.06) — free
**Your market briefing in a sub-window. MiniBull Report answers the questions an intraday trader asks before every decision — in plain language, in your own time zone, and with the same answers on every chart timeframe.**
*Where is price against the monthly, weekly, daily and 4H trend? How far is it stretched? How much of today's typical range is used? Where are the nearest resistance and support? Is a high-impact event coming? What speaks for a long, what spe
FREE

LZ Fibo Ribbon displays a smooth ribbon of four Exponential Moving Averages (EMAs) calibrated to the popular Fibonacci sequence numbers (21, 34, 55, 89) by default. This combination forms a dynamic band of support and resistance on your chart, making it easy to instantly identify trend direction, momentum, and potential pullback zones.
Feature highlights
- Trend Identification: clearly visualizes the trend direction and strength based on the spacing and order of the moving averages within the
FREE

"Are you tired of losing money on unsuccessful trades? Look no further than EA Trailing Stop! Our program is designed to help you prevent losses and control your trades efficiently. With features such as adjustable stop loss and more, you can rest assured that your trades are in good hands. Don't wait any longer to start making successful trades. Try EA Trailing Stop today!"
You can use this as a starting point and tailor it to your audience and the platform you're using. This EA Trailing Stop
FREE

# Trade Assistant Manager
Stop calculating lot sizes by hand. Trade Assistant Manager is an on-chart panel that turns your risk settings and chart lines into a precise, ready-to-fire order — automatically.
## Key Features
**Automatic Lot Sizing** Set your risk as a percentage of account balance or a fixed dollar amount. The panel reads the distance between your Entry and Stop Loss lines and instantly calculates the exact lot size for that risk — accounting for your broker's commission per lo
FREE

MT5 Alert Indicator Please add Ema moving averages 60/100/200 & Rsi period 10 levels 30/70 to your chart. This indicator alert on a trend reversal strategy were - ema 60 > 100&200 - ema 100 < 200 And the Rsi is below 30 FOR BUY SIGNAL
Use this strategy in confluence with a larger timeframe trend in the same direction. This strategy identifies great entry opportunities to enter an early trend.
FREE
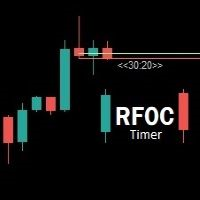
Uma informação de grande valor para o trader se localizar no tempo é a informação de quanto tempo temos para o encerramento do candle atual ou quanto falta para a formação de um novo candle. O RFOC Timer apresenta esta informação de forma clara e alocada à direita do candle atual. Adicionalmente o RFOC Timer acompanha a opção de inclusão das linhas de preços ASK e BID com e sem extensão a direita e/ou esquerda. Esta função auxilia, por exemplo, a não sobreposição das linhas de ASK e BID com as
FREE

Win Streak Size Creep Mirror は、自分の口座の確定した取引履歴だけを読み、「連勝が続いている間に、自分のふだんの水準より大きいロットで新規ポジションを開いた」というパターンを1つだけ数えるツールです。予測も助言もしません。パネルに出るのは、すでにこの口座で起きたことの実測値だけです。
数字の作り方: 全銘柄・全マジック番号を対象に、最大31日分の確定した約定を読み込みます(チャートの銘柄に限らない、口座全体の集計です)。当日より前の30日間から、新規エントリーのロットの中央値を求めて 30d median lot として表示し、同じ30日間の1日あたり新規エントリー件数の中央値を 30d daily median として表示します。どちらも平均ではなく中央値を使うため、1件だけ大きな取引があっても基準値全体が引きずられません。その30日間のエントリーが5件に満たない場合は、十分な標本が無いということなので、無理に数字を出さず「Collecting history」と表示します。
Current win streak は、直近の利益確定から遡って、損失また
FREE

スプレッドが知らぬ間に拡大している状況で取引を行うと、予想以上のコストがかかってしまいますが、1つの銘柄のチャートだけを見ていると、こうした変化を見逃しがちです。
Phoenix Spread Panelは、複数の銘柄のスプレッドをリアルタイムで一覧表示し、各銘柄の平均値に対して色分け表示するため、注文を出す前にスプレッドの拡大を確認することができます。
スプレッドコストを可視化する仕組み
- 最大15銘柄のリアルタイムの現在値、最小値、最大値、平均スプレッドを同時に表示
- ピップまたはポイント単位での表示
- 任意の列(銘柄、現在値、最小値、最大値、平均値)で並べ替え可能
- 品質の閾値(良好/警告/アラート)を色分け表示。すべての銘柄に一律に適用される固定値ではなく、各銘柄の平均値の倍数として設定
- 非アクティブな銘柄は自動的に非表示
アラート
銘柄のスプレッドが警告ゾーンまたはアラートゾーンに入った際に、音とプッシュ通知で通知します。
Phoenix Spread Panelを活用して:
- エントリー前に、ウォッチリスト全体の
FREE


ATR Short Box Anchor MT5 ATR Short Box Anchor MT5 is a visual risk-reward indicator for MetaTrader 5, specifically designed for planning short setups. The indicator creates an ATR-based short box directly on the chart, including entry, stop-loss zone, take-profit zone, and optional risk-reward information. The indicator works with a freely movable anchor point. This anchor defines the desired entry price and the candle whose ATR value is used for the calculation. This allows a short setup to be
FREE

Santa Bollinger Indicator is an efficient way to detect price retracement in any market. A common approach is to identify overbought or oversold market conditions. When the price of the asset breaks below the lower band of the Bollinger Bands, prices have perhaps fallen too much and are due to bounce. On the other hand, when price breaks above the upper band, the market is perhaps overbought and due for a pullback . Advantages Generates instant buy and sell signals. Never repaints, never back
FREE
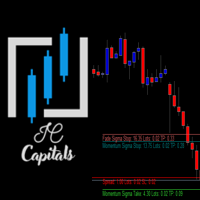
Key Features: Multi-Target Volatility: Configure multiple Take Profit and Stop Loss levels based on real-time market volatility. Fully Customizable: Set specific volatility multipliers (e.g., 4x for Stop, 10x for Take) using any look-back period (e.g., previous 20 bars on a 2-minute chart). Clear Visuals: Assign unique names to each level to be displayed directly on your symbol's chart for easy monitoring. Consistency: Every level calculated is synchronized with the volatility of your chosen per
FREE

Prop Guardian — 日次損失&ドローダウンモニター(無料) OneFundedが公表しているデータによると、プロップファームのチャレンジ評価で失格となるケースの78.7%は、全体的なドローダウンではなく、1日の許容損失額(日次損失上限)の違反によるものです。多くのトレーダーは戦略が破綻して負けるのではなく、まさにその瞬間に最も重要な数値が画面に表示されていなかったために敗退しています。 Prop Guardianは、その数値を画面上に常に表示します。 主な機能 日次損失上限と最大ドローダウンの両方を金額とパーセンテージでリアルタイムに並列監視 設定した1トレードあたりのリスクに基づき、残りの許容損失額を「あと何回負けトレードが可能か」に自動換算 3つのドローダウンモードに対応:スタティック(固定)、トレイリング、トレイリング・ウィズ・ロック(固定移行型)— 各プロップファームの実質的なルール定義に正確に適合 限界に達してからではなく、近づいた段階で知らせるカスタマイズ可能な事前警告アラート(ポップアップ、効果音、プッシュ通知) 他ツールとの違い すべての日次損失計算は、サー
FREE
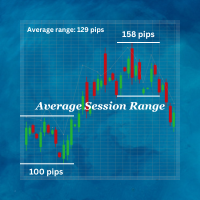
Average Session Range: Calculate and Average the Sessions High-Low Range of Specific Time Sessions Over Multiple Days. The Session Average Range is a sophisticated and precise tool designed to calculate the volatility of specific time sessions within the trading day. By meticulously analyzing the range between the high and low prices of a defined trading session over multiple days, this tool provides traders with a clear and actionable average range. **Note:** When the trading platform is closed
FREE

The Chicken Trader
Description: The Chicken Trader is a whimsical and entertaining trading algorithm inspired by the viral "Trading Chicken" sensation on social media. This Expert Advisor (EA) replicates the unpredictable trading style of the famous chicken, offering a lighthearted approach to trading.
Features: Random Market Direction : The EA randomly chooses between placing a Buy or Sell trade. Session Selection : It randomly selects one of the three major trading sessions for entry:
FREE

This is MT5 version ,MT4 version: https://www.mql5.com/zh/market/product/135163 Warning: This is Martingale EA, with extremely high risk!!! Expert Advisor (EA) is not omnipotent, using this EA means agreeing to bear the risk of all losses incurred by the EA Trading financial products such as foreign exchange and gold are high-risk products that may result in zero principal. Please be aware of the risks before trading
This is Laodengxi 429 EA FREE! This is a Martingale EA
FREE
EMA Line Visualizer with Trend Analysis Description:
The Exponential Moving Average (EMA) Line Visualizer EA plots multiple EMAs on your chart (25, 50, 100, 200, and a custom EMA) and analyzes real-time trend direction. It detects whether the market is currently in an Uptrend , Downtrend , or Flat condition based on the latest EMA relationships. Features: Multi-EMA Display
Plot multiple EMAs with customizable periods. Custom Colors
Set distinct colors for each EMA line for better visual trac
FREE

インストールの前に:このツールにできないこと。 まずこちらをお読みください。以下のいずれかを目的としてお越しの場合、このツールは目的に合いません。チャートに載せる前に知っておく方が良いはずです。
- 仮想ストップや隠しストップは一切ありません。 すべてのストップはブローカーのサーバーに置かれる本物のストップであり、ブローカーにもプロップファームにも見えます。設計上、どちらに対しても何も隠しません。 - 1チャートにつき1銘柄。 無料版は、適用したチャートの銘柄のみを取引します。余力(ヘッドルーム)の試算は、このパネル自身が当該銘柄で行う取引のみを対象とします。複数銘柄を同時に取引する場合、試算は口座全体を把握できません。これは1チャート型ツールの実際の能力上の制限であり、意図的に無効化された機能ではありません。 - ストラテジーテスターでの取引は不可。 クリック式パネルはテスター内で意味のあるクリックができません。パネルは描画されるだけです。 - Risk Sentinel や Prop Guardian と同一チャートには置けません。 MetaTrader 5 は1チャートにつき
FREE

Click2FiboDrawer – 2クリックで即描画、裁量トレーダーのためのフィボナッチ補助ツール Click2FiboDrawer は、裁量トレードを重視する方向けに設計された、
フィボナッチ・リトレースメント(Fibonacci retracement)描画専用のインジケーター です。 [fibo]をクリックしチャート上で始点と終点わずか2回クリックするだけで、美しいFibonacciラインを瞬時に描画できます。 スキャルピングのような高速判断が求められるトレードでも、「Fibo」ボタンを押せば2クリックで即座にFibonacci retracementを引くことができ、
エントリーチャンスを逃しません。 主な機能: チャート上で 2クリックだけでFibonacci retracementを描画 作成順に 1本ずつ削除できるDeleteボタン すべてのFiboを安全に一括削除できるClear Allボタン ラインやラベルの色を チャート背景に合わせて自由にカスタマイズ可能 あらゆるチャート背景でも高い視認性 シンプルで直感的なボタンUI(表示位置や色も調整可能) 仕
FREE

LM Donchian Channel MT5 LM Donchian Channel MT5 is a clean and configurable technical indicator for MetaTrader 5. It displays the highest high and lowest low over a selected number of bars, creating a channel that helps users visualise recent price ranges on any chart and timeframe. The indicator is based on the classic Donchian Channel concept: Upper Channel: Highest high over the selected lookback period. Lower Channel: Lowest low over the selected lookback period. It can be used as part of yo
FREE

#ピボットポイント_スリム インジケーター #概要 6種類のピボットを搭載した、プロフェッショナル向けピボットポイントインジケーターです。 見やすいデザインで、重要なサポート・レジスタンスレベルを自動的にチャート上に表示します。 #カスタマイズ可能な表示設定 各レベル(P、S1-S5、R1-R5)の個別色設定 各レベルの表示/非表示切り替え ラベル表示/非表示 価格表示/非表示 ラベル位置(左/右) ラベルオフセット調整(ラインとテキストの間隔) ライン幅調整 履歴表示数(最大15期間) #基本パラメータ -Pivot Type - ピボット計算方式を選択 Traditional(トラディショナル) - 最も一般的な標準ピボット計算式(S1-S5、R1-R5) - 5つのサポート・レジスタンスレベル - あらゆるトレードスタイルに適用可能
Fibonacci(フィボナッチ) - フィボナッチ比率を使用した
FREE

This indicator is based on the Moving Average indicator. It helps the user identifying whether to buy or sell. It comes with an alert that will sound whenever a new signal appears. It also features an email facility. Your email address and SMTP Server settings should be specified in the settings window of the "Mailbox" tab in your MetaTrader 5. Blue arrow up = Buy. Red arrow down = Sell. Line = Trailing Stop. You can use one of my Trailing Stop products that automatically move the Stop Loss and
FREE

Free Global Stop Loss and Take Profit Setter with Break Even
Free one click Stop Loss and Take Profit tool for manual trading. Apply a fixed SL and TP to every open position on the symbol, or move them all to break even, with a single button. It only modifies Stop Loss and Take Profit levels — it never opens or closes a trade. Set your SL and TP distance in points, click once, and every position on the current symbol is protected. The break even button moves stops to entry (or a configurable num
FREE

EXPERT AMAZO DEMO é um Expert Advisor projetado especificamente para negociar WIN (mini índice) e WDO (mini dólar) e para ser usado somente em contas DEMO. A operação é baseada na abertura de ordens utilizando alguns indicadores como Sars parabólicos, médias móveis, Bandas de Bollinger, Fibonacci, etc., trabalhando de acordo com 3 modalidades de estratégia, o AMAZO procura prever os movimentos do mercado com operações contra ea favor da tendência.
Entre em nosso Grupo de WhatsAp
FREE

Ultimate Candle Countdown – もう二度とローソク足のクローズを見逃さない! Ultimate Candle Countdown でトレード精度を次のレベルへ。あらゆる時間足と銘柄に対応した、シンプルで軽量かつ強力なローソク足カウントダウンタイマーです。
M1でスキャルピング、H1でスイングトレード、あるいは日足/週足のクローズを監視していても、このツールがあれば次のローソク足が始まるまでの残り時間を正確に把握できます。推測はもう不要 – 常に鋭く、常に一歩先へ。 主な機能 すべての時間足に対応 – 1分足から月足まで、信頼性と精度を両立。 視覚的なカウントダウン – hh:mm:ss 形式で残り時間を表示、毎秒スムーズに更新。 カラーアラート – 通常・警告・クリティカルの色をカスタマイズ可能。残り時間が少ないことを瞬時に認識。 オプションの進行率表示 – ローソク足の進行度を一目で確認。 プログレスバー – カウントダウンの下に表示されるシンプルなバー。 時間足ラベル – 監視しているチャートの時間足を常に明示。 スマート配置 – 最新のローソ
FREE

RaysFX Elastic Order Flow Matrix (EOFM) L'indicatore definitivo per gli Scalper e i Day Trader che operano su timeframe rapidi (M1). Il RaysFX Elastic Order Flow Matrix non è un semplice oscillatore. È un motore analitico avanzato progettato per decodificare la vera pressione compratrice o venditrice del mercato, filtrando il "rumore" tipico dei grafici a 1 minuto. Se sei stanco di farti fermare dai falsi segnali generati dalle candele di basso volume o dalla congestione, questo strumento ti
FREE

Correlation Coefficient PRO + Moving Average Advanced dual-asset correlation indicator with dynamic smoothing Overview Correlation Coefficient PRO + MA is a powerful indicator that measures the statistical correlation between the current chart symbol and any secondary instrument in real time. Displayed in a separate window, it gives traders an immediate visual reading of how two assets move in relation to each other — whether they trend together, diverge, or move inversely. The built-in Moving A
FREE

FREE

Attention ! !! Buffer indicator, PERFECT FOR USE IN THE EXPERT ADVISOR! The DynamicFibo indicator automatically indicates horizontal Fibonacci levels on the chart online. The levels are recalculated automatically online. The levels can be calculated from the current chart as well as from any other time frame. It is convenient to use levels from an older time frame, and trade on a shorter time frame. Any levels are set manually in the indicator settings. IT is IMPORTANT to separate the levels i
FREE

RBM Volume Real PRO 3.0
RBM Volume Real PRO 3.0 was developed to transform volume data into actionable market intelligence. While most traders focus exclusively on price movement, this indicator allows users to identify the participants truly driving the market by revealing the balance of power between buyers and sellers in real time.
The first component is Buy Volume, which represents the aggression of participants willing to execute orders at the asking price. Conversely, Sell Volume measur
FREE

とてもシンプルな過去検証ツールです。 Startをクリックすると、過去チャートの一番過去にさかのぼって始まります。 スプレッドは0.2pips、最大10回ナンピンが可能です。 ローソク足の大きさと時間枠をパラメータとして設定できます。 検証中に時間枠を変更することは出来ません。 ボタンの機能は以下の通りです。 ------------------------------------------------------------ Resume/Pause: 自動スクロールのストップ・再開 Next bar: ローソク足を一つづつ進める Speed1,2,3: 自動スクロールのスピード Skip: チャートを少しスキップ Start/End: 開始・終了 Buy: 1ポジション買い注文
Sell: 1ポジション売り注文 Close: 全ポジションの決済 ------------------------------------------------------------
売買の結果は左上にポイント数(勝ち回数:負け回数)として表示されます。
FREE
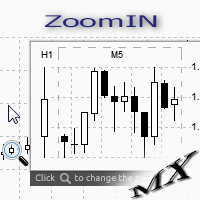
The ZoomIN MT5 indicator is designed for quickly viewing the selected bar on the smaller timeframes in a pop-up window. Once launched, the indicator works in the background, does not take up space on the chart and does not consume system resources. When the indicator is activated by the Shift + i combination (can be changed in the settings), a pop-up window with a chart of a smaller timeframe is created. The displayed timeframe can be changed by a left-click on the magnifying glass icon. To hide
FREE
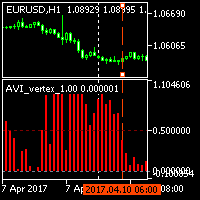
The indicator displays trend slowdown or possible end of trend and price reversal. The indicator has no parameters. When red bars appear and when they become shorter, we can talk about the approaching end of the downtrend. When green bars become shorter, we can expect the approaching end of the uptrend.
FREE

Signal Navigator - Multi-Timeframe Trend and Momentum Indicator for MetaTrader 5 Signal Navigator is a technical analysis indicator for MetaTrader 5 that combines trend analysis, momentum confirmation
and multi-timeframe market information in a single chart interface.
The indicator uses Moving Average slope analysis together with RSI conditions to evaluate the current market direction and
generate visual Buy and Sell signals. In addition, it provides an overview of the trend situation across sev
FREE
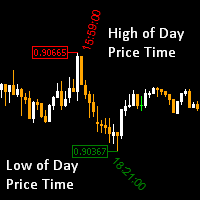
High of the Day and Low of the day Time and Price Fractal Studies is an indicator that will help you identify certain patterns that tend to repeat themseleves at certail times of the day or at certain prices.
It is used to study Daily Highs ad Lows in relation to time and price.
You will get to answer certail questions like:
At what time of day does this market usually turn around. At what price does the market turn. Is it at round numbers etc
FREE
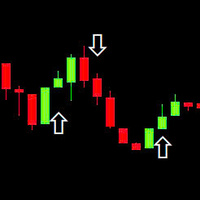
This indicator is based on the RSI (Relative Strength Index) to identify potential Breakout points and draw arrows on the chart to suggest buy/sell signals. Use RSI to find breakout signals. Draw Buy/Sell arrows on the chart. Send alerts when there is a trading signal. Buy (Orange Arrow - 0xFFAA00): When a buy signal appears. Sell (Blue Arrow - 0x0000FF): When a sell signal appears. DRAW_ARROW: Used to draw arrows on the chart.
FREE
BBTrend is a powerful trend analysis tool designed to provide a clear overview of market volatility and trends at a glance.
This indicator calculates the difference between two Bollinger Bands of different periods,
visually indicating the strength of upward or downward trends to traders. Clear Trend Visualization: The upward trend is represented in green, and the downward trend in red,
allowing traders to intuitively grasp the direction and strength of the trend. Standardized Percentage Disp
FREE

The Kalires Channel Indicator is a technical indicator used to evaluate trend direction and potential trading opportunities. This is a hybrid indicator that combines Kauffman Adaptive Moving Average (KAMA), linear regression and smoothing. The Kalires Channel Indicator consists of two lines: one central and two outer bands. The central line is a smoothed KAMA modified according to the direction of the trend. The outer bars represent two linear regression lines drawn above and below the center l
FREE

このインジケーターは、トレンドの方向とトレンドの転換を示します。 Ganesha Trend Viewerは、GOLD(XAUUSD)専用に設計されたトレンドフォローのインジケーターですが、その他のあらゆる金融商品で使用することもできます。 インジケーターは後で描画し直すようなことはしていません。 推奨する時間足(Timeframe)はH1です。 Ganesha Trend Viewer は、すべてのMeta Traderでサポートされるシンボルで使用できます。 (通貨、金属、暗号通貨、株式、インデックス..)
パラメタ設定
MA Short Period ----- 移動平均 短期間 MA Long Period ----- 移動平均 長期間 Alerts ON ----- アラートオン Mobile Notification On ----- モバイル通知オン
FREE
Hello, This indicator is a unique high reliability 7-in-1 multicurrency indicator comprising these sub-indicator’s: A Trend Power Crossover Indicator. A Percent Change Crossover Indicator. A Currency Overbought/Oversold Indicator. A Currency Deviation Indicator. A Currency Impulse Signal Indicator. A Trend Power Indicator. A Currency Volatility Indicator. The main advantage of this indicator is that it's reasoning by currency and not by currency pair. The values of each sub-indicator are calcula
FREE
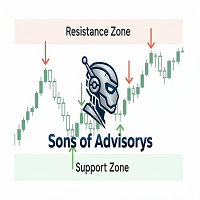
Sons of Advisorys: QuantumLevel This advanced MT5 Expert Advisor automates trading decisions based on a robust Support and Resistance breakout and retest strategy. It performs multi-timeframe analysis across H4, H1, and M15 charts to identify high-probability trade setups with precise zone validation. Key Features: Strategy: Support/Resistance breakout with retest continuation. Multi-Timeframe Detection: Independent analysis and toggle options for H4, H1, and M15 timeframes. Auto-Trading:
FREE

OmniChart is a lightweight, ultra-smooth Picture-in-Picture (PIP) chart indicator designed for professional traders who need seamless multi-timeframe analysis. Keep a close eye on lower timeframes (like M1 or M2) directly on your higher timeframe chart (like M15 or M30) without cluttering your workspace or switching profiles! Designed with a focus on pure price action , OmniChart removes all distractions. No grids, no confusing axes, no volumes—just pure, clean candlesticks to help you spot
FREE

Multi-timeframe trend indicator based on the ADX / ADXWilder indicator with Fibonacci levels
The indicator shows trend areas using ADX or ADXWilder indicator data from multiple timeframes. The impulse mode of the indicator allows you to catch the beginning of a trend, and several "Screens" with different timeframes allow you to filter out market noise. Fibonacci levels are added to the price chart, which have flexible settings.
How the indicator works: if PDI is greater than NDI, then it`s
FREE

Collective TP SL Manager is a MetaTrader 5 utility that manages a combined take-profit and stop-loss across many open positions on one symbol. Instead of setting TP/SL per order, it watches the net profit or loss of all (or filtered) positions and closes the basket when your target is reached. Features Basket-level targets: one collective take-profit and one collective stop-loss for the whole group of positions. Net P/L monitoring: continuously sums the profit/loss of all selected positions in
FREE
Introduction to GARCH Indicator GARCH is the short initial for Generalized Autoregressive Conditional Heteroskedasticity and it is the volatility prediction model commonly used in financial industry. GARCH model was first appeared in the work by Danish Economist, Tim Peter Bollerslev in 1986. The 2003 Nobel Prize winner, Robert F Engle also added much contribution for the refinement of GARCH model with Tim’s work. Our GARCH INM predictor took the original method of Nelder Mead for GARCH model bu
FREE

Reversal Oscillator — Advanced Momentum Shift Detector
Reversal Oscillator is a free indicator designed to highlight price zones that are statistically outside their normal movement patterns, helping traders anticipate potential turning points before they occur. Unlike traditional oscillators that react mainly to overbought/oversold conditions, this indicator applies third derivative analysis (the "acceleration of the acceleration" of price) calculated using two independent methods within a n
FREE

After downloading, message me via MQL5 inbox to receive your FREE User Kit - setup guide, practical checklist, and workflow resources built specifically for XAUUSD traders. If you've been trading Gold long enough, you already know the drill. Before the session opens, you pull up the chart and start looking for the same levels you've been marking every week: previous week high, previous week low, the midpoint, and yesterday's high and low. You draw them manually, label them, and keep an eye on t
FREE

Non-proprietary study of Joe Dinapoli used for overbought/oversold evaluation. Uses of Detrended Oscillator indicator Profit taking. Filter for market entry technics. Stop placement. Part of volatility breakout pattern. Determining major trend changes. Part of Dinapoli Stretch pattern. Inputs lnpPeriod: Perid of moving average Method: Calculation method ********************************************************************************* If you want to know market Overb
FREE

The indicator ColorCandlesDaily draw candles with different colors depending on the day of the week.
FREE

Path of Candle Stick (Version.2) — Advanced Multi-Bollinger Band Volatility Navigator. "Not flawless, but priceless in purpose."
*** Push notifications are now available in this second version. "เปิดใช้งานระบบแจ้งเตือนแบบ Push notification แล้วในเวอร์ชันที่สองนี้"
Path of Candle Stick - The Quad-Bollinger Band Signal for MT5. *** Stop guessing where the next candle will close! *** Stop trading inside messy, cluttered charts! Maps out the exact mathematical corridors of the market using
FREE
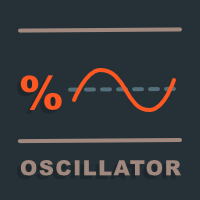
このプロジェクトが好きなら、5つ星レビューを残してください。 機関が大きなボリュームを取引するので、それらが試してみることは珍しくありません
特定のパーセンテージレベルでポジションを守る これらのレベルは、あなたが使用できる自然なサポートと抵抗として役立ちます
取引を入力するか、ポジションに対する危険性を認識する。 このオシレータは、以下の比率の変動を示します。 日。 週。 月 日 クォーター。 生年月日 サポートと抵抗をトレースするサブウィンドウで。
FREE

トレーダーなら誰もが知っているお決まりの手順があります。インジケーターの設定を開き、数字を変え、OK を押し、チャートを目を細めて眺め、違うと判断して、また設定を開く。Relative Vigor Index で設定する数字は期間ひとつだけですが、自分の銘柄で 10 と 14 を比べたくなるたびに、その一度のダイアログ往復が「変えては睨む」サイクルを毎回強いてきます。RVI Live Tuner はそれを終わらせます。 これは チャート上でリアルタイムに 調整できる、古典的な 2 ライン構成の RVI(RVI とその Signal)です。チャート上には期間スライダー付きの小さなパネルが表示されます。ドラッグすれば、見ているその場で 2 本のラインが即座に再計算・再描画されます。「10 か 14 か」の疑問は、フォーラムのスレッドではなく自分のチャート上で数秒で解決します。 ラッパーではない、本物の RVI。 本インジケーターは教科書どおりの計算を自前で実装しています。4 本のバーに対称加重をかけた close-to-open の値動きと high-to-low のレンジを、それぞれ期間
FREE

One of the simplest Pivot Point indicator, easy to operate, and most complete for a single chart in determining Resistance and Support level lines.
In single chart, it will show R&S Level Line with 5 popular types of Pivot Point, Highest&Lowest of closing price Include the Trend and up to 3 Time Frames.
Five types (Floor, Woodie, Camarilla, DeMark, & Fibonacci) of popular Pivot Points in determining Resistance and Support levels. With just using simple button on the
FREE

Volatility Channel Indicator Ride the Waves of Market Volatility with Precision ... please leave a 5 star rating if you love this product The Indicator is free. The source code is available for just 30usd.
Are you tired of entering trades too early or too late? Missing breakouts? Getting caught in false signals? The Volatility Channel Indicator transforms chaotic price action into crystal-clear trading opportunities. What You Get (MT4 & MT5) Smart Channel Bands that
FREE

The FXmans Position Calculator is a high-precision trading tool designed for algorithmic risk management. Below is an explanation of its core components and functions in English: 1. Risk Management Engine The indicator calculates your position size based on the specific risk you are willing to take per trade. Risk Mode: You can toggle between Percent (a fixed percentage of your account balance) or Fixed USD (a static dollar amount). R/R Ratio: This determines where your Take Profit (TP) level
FREE

Trade Manager Pro is a professional MT5 trade management panel designed to simplify and speed up your trading execution. Open, manage, and close trades directly from your chart with one click — no manual calculations or menu navigation required. Key Features Automatic Risk-Based Lot Size Calculates position size automatically based on: Account balance Risk percentage Stop Loss distance Works on all instruments: Forex, Gold, Crypto, Indices One-Click Trade Execution Instantly open BUY a
FREE
ステップチャネルモメンタムトレンドインジケーター (MT5 Indicator) ステップチャネルモメンタムトレンド は、市場の構造と動的なボラティリティ分析を組み合わせてトレーダーに適応的な優位性を提供するために設計された強力なモメンタムベースのインジケーターです。このツールは、遅延の影響を受けるスムージング技術に依存せず、ユニークな階段状の中間線とATRフィルターチャンネルを使用して、トレンドと範囲を明確に区別するのに役立ちます。 主な特徴 構造的ステップ中間線 システムの中心は、確認された価格のピボットに基づいた「段階状」中間線です。 新たな高値や安値が確認されるときだけ再計算されるため、不要な遅延を排除し、市場構造の変化に瞬時に反応します。 この段階的アプローチは、明確なレジームシフトを作り出し、価格の現実を反映します — インジケーターのノイズを避けます。 中間線は最近の強気と弱気のコントロール間の平衡点を指し、バイアス、ブレイクアウト、または反発のための信頼できる基準となります。 動的ボラティリティバンド 上部と下部のチャネルバンドは、平均真範囲 (ATR) を使用して構築
FREE

Risk Basket Planner Risk Basket Planner は MetaTrader 5 用の手動バスケットリスク計画ツールです。複数のエントリー価格、テクニカルストップロス、各レイヤーのロットサイズと実際のリスクを、手動注文の前に確認できます。 主な機能 1~5 レイヤー のエントリー計画。 BUY / SELL の方向選択。 口座 Equity に対する割合でリスクを設定。 L1-L5 の価格を入力、またはチャート上でドラッグ可能。 全レイヤー共通の Technical Stop Loss 。 Auto SL 80% / 100% / 120% プリセット。 正確な価格を指定できる Manual SL モード。 エントリー、SL、リスク%、方向、レイヤー数変更後に自動再計算。 各レイヤーへ均等リスク配分を試み、 ブローカーの最小ロット・ロットステップ反映後の実際のリスク を表示。 各レイヤーのロット、リスク%、リスク金額、合計ロット、目標リスク、実際のバスケットリスクを表示。 現在のスプレッドと最も近い SL までの距離を表示。 SL がスプレッドやブローカー制
FREE

これは無料でご利用いただける製品です。お客様のニーズに合わせてご利用ください。
このインジケーターが気に入ったら、ぜひ短い肯定的なフィードバックを残してください!ありがとうございます!
高品質のトレーディングロボットとインジケーターをご覧になるにはここをクリックしてください!
MT5 用 Forex インジケーター SWAP 表示、優れた補助取引ツール。 ................................................................................. - SWAP 表示インジケーターは、それが接続されている Forex ペアのロング トレードとショート トレードの現在の SWAP を表示します。 - SWAP 表示の値は、チャートのどのコーナーにも配置できます. - 色とフォント サイズも設定できます。 - トレードを 1 日以上オープンにしておく場合、各トレーダーは SWAP を知っておく必要があります。 これは、この MQL5 Web サイトでのみ提供されるオリジナル製品です。
FREE
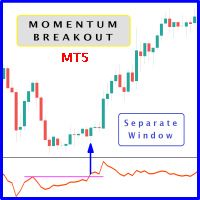
When prices breakout resistance levels are combined with momentum oscillator breaks out its historical resistance levels then probability emerges to record farther higher prices. It's strongly encouraged to confirm price breakout with oscillator breakout since they have comparable effects to price breaking support and resistance levels; certainly short trades will have the same perception. Concept is based on find swing levels which based on number of bars by each side to confirm peak or trough
FREE

Hello, trading champs! I trust you are doing well. Have you experienced entering a position where the market initially moves in your favour or approach your takeprofit then suddenly the market reversed opposite your position? Well, it has happened to me numerous times and today I decide to fight back.
I present to you a trade manager that help you protect your position(s). This project helps you set your position(s) to breakeven either when a certain amount of pips you specify is reached or a
FREE

MSX Heikin Ashi Advanced Overview MSX Heikin Ashi Advanced is a MetaTrader 5 indicator designed to provide a smoothed visual representation of price movement using a modified Heikin Ashi calculation. The indicator applies Heikin Ashi calculations to user-selected price sources and displays color-based candles that may assist with trend observation and market structure analysis. Features • Modified Heikin Ashi candle calculation • Real-time candle updates • Multiple applied price options • Color
FREE

Candle color RSI (Relative Strength Index) indicators change candlestick colors on the price chart to visually show RSI conditions like overbought/oversold levels or bullish/bearish momentum, using colors like red for overbought/bearish and green for oversold/bullish, helping traders spot reversals or strength at a glance without looking at the separate RSI pane. These custom indicators often color candles red above 70 (overbought), green below 30 (oversold), and keep default colors in between
FREE
A SmartTrendMA foi projetada para identificar melhor zonas de alta, baixa e consolidação, azul alta, vermelho baixa e branco consolidação, vai te auxiliar a identificar melhor a tendência. Em parâmetro regule melhor conforme sua preferência em grau pois cada par de moeda se adequa diferentemente a cor,mude também o período e se quiser mude exponencial ou simples.
FREE
MetaTraderマーケットは、履歴データを使ったテストと最適化のための無料のデモ自動売買ロボットをダウンロードできる唯一のストアです。
アプリ概要と他のカスタマーからのレビューをご覧になり、ターミナルにダウンロードし、購入する前に自動売買ロボットをテストしてください。完全に無料でアプリをテストできるのはMetaTraderマーケットだけです。

取引の機会を逃しています。
- 無料取引アプリ
- 8千を超えるシグナルをコピー
- 金融ニュースで金融マーケットを探索