 MetaTrader 5
 Experts
 Indicadores
 Bibliotecas
 Utilitários
 Widgets
 Regras
Conheça o Mercado MQL5 no YouTube, assista aos vídeos tutoriais
Como comprar um robô de negociação ou indicador?
Execute seu EA na
hospedagem virtual
hospedagem virtual
Teste indicadores/robôs de negociação antes de comprá-los
Quer ganhar dinheiro no Mercado?
Como apresentar um produto para o consumidor final?
Expert Advisors Grátis e Indicadores para MetaTrader 5 - 94
 Use robôs de negociação e indicadores para aumentar os rendimentos com a negociação em Forex. Com ajuda de robôs de negociação, você pode automatizar o processo de abertura e fechamento de transações, por outra lado, os indicadores o ajudam a prever com mais precisão o comportamento futuro do mercado.
A página contém um catálogo de aplicativos MetaTrader 5.

Did you ever feel irritated by manually adjusting Fibonacci retracement levels? Do you ever want to have a tool that was automatically adjust to certain Fibonacci levels with your trading? Well here is a tool for you: Fast Fibonacci indicator and Grid trader allows you to quickly adjust Fibonacci retracement levels or construct Fibonacci extension grid! You can also quickly setup your grid trading based on these levels - only with few clicks. Adjustable graphics, font sizes and graphics panels m
FREE

For more details, performance records, and strategy breakdown, please visit: [ https://eruo-grid-sniper.vercel.app ]
---
### Overview
EuroGridSniper is a fully automated Expert Advisor designed for the MetaTrader 5 platform. This EA uses a dynamic grid-based trading strategy optimized for trending and ranging market conditions. It combines technical price levels with volatility filters to increase the probability of successful trades.
---
### ️ Key Features
- Smart grid algo
FREE

TEMA Trend Matrix PRO Elite Multi-Timeframe Trend Intelligence System
Trade With Clarity. Execute With Confidence. Stop guessing the market direction. TEMA Trend Matrix PRO is a high-performance trend intelligence dashboard built for traders who demand precision, speed, and clarity. Powered by advanced Triple Exponential Moving Average (TEMA) logic, it delivers a real-time, multi-timeframe view of market structure — all in one clean interface. No more chart switching. No more conflicting
FREE

Multichart Dashboard — Your Central Command Center for Trading
The **Multichart Dashboard** Expert Advisor transforms your MetaTrader interface into a clean, professional trading hub. Manage up to **6 charts simultaneously** , switch between symbols in an instant and always stay in control — all within one compact, fully configurable panel.
What does Multichart Dashboard do?
**Up to 6 charts in parallel** — Set the desired number of charts (1–6) with a single input. All associated charts are
FREE
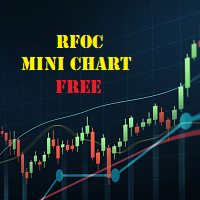
O RFOC Mini Chart foi criado para projetar uma visão macro do mercado, que além de ter a opção de selecionar o timeframe de interesse diferente do gráfico principal, é possível incluir 2 indicadores:
1 - Canal de média móvel No mini gráfico será criado a média móvel baseada nos preços do time frame selecionado para o RFOC Mini Chart. O período da média móvel deve ser selecionado no painel de configurações do indicador.
2 - Banda de Boillinger No mini gráfico será criado banda de boillinger bas
FREE

# MiniBull Report (v1.06) — free
**Your market briefing in a sub-window. MiniBull Report answers the questions an intraday trader asks before every decision — in plain language, in your own time zone, and with the same answers on every chart timeframe.**
*Where is price against the monthly, weekly, daily and 4H trend? How far is it stretched? How much of today's typical range is used? Where are the nearest resistance and support? Is a high-impact event coming? What speaks for a long, what spe
FREE

LZ Fibo Ribbon displays a smooth ribbon of four Exponential Moving Averages (EMAs) calibrated to the popular Fibonacci sequence numbers (21, 34, 55, 89) by default. This combination forms a dynamic band of support and resistance on your chart, making it easy to instantly identify trend direction, momentum, and potential pullback zones.
Feature highlights
- Trend Identification: clearly visualizes the trend direction and strength based on the spacing and order of the moving averages within the
FREE

"Are you tired of losing money on unsuccessful trades? Look no further than EA Trailing Stop! Our program is designed to help you prevent losses and control your trades efficiently. With features such as adjustable stop loss and more, you can rest assured that your trades are in good hands. Don't wait any longer to start making successful trades. Try EA Trailing Stop today!"
You can use this as a starting point and tailor it to your audience and the platform you're using. This EA Trailing Stop
FREE

# Trade Assistant Manager
Stop calculating lot sizes by hand. Trade Assistant Manager is an on-chart panel that turns your risk settings and chart lines into a precise, ready-to-fire order — automatically.
## Key Features
**Automatic Lot Sizing** Set your risk as a percentage of account balance or a fixed dollar amount. The panel reads the distance between your Entry and Stop Loss lines and instantly calculates the exact lot size for that risk — accounting for your broker's commission per lo
FREE

MT5 Alert Indicator Please add Ema moving averages 60/100/200 & Rsi period 10 levels 30/70 to your chart. This indicator alert on a trend reversal strategy were - ema 60 > 100&200 - ema 100 < 200 And the Rsi is below 30 FOR BUY SIGNAL
Use this strategy in confluence with a larger timeframe trend in the same direction. This strategy identifies great entry opportunities to enter an early trend.
FREE
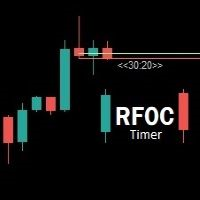
Uma informação de grande valor para o trader se localizar no tempo é a informação de quanto tempo temos para o encerramento do candle atual ou quanto falta para a formação de um novo candle. O RFOC Timer apresenta esta informação de forma clara e alocada à direita do candle atual. Adicionalmente o RFOC Timer acompanha a opção de inclusão das linhas de preços ASK e BID com e sem extensão a direita e/ou esquerda. Esta função auxilia, por exemplo, a não sobreposição das linhas de ASK e BID com as
FREE

O Win Streak Size Creep Mirror lê apenas o histórico de operações já encerradas da sua própria conta e conta um único padrão: abrir uma nova posição durante uma sequência de ganhos, com um lote maior do que o seu volume habitual. A ferramenta não prevê nada e não dá nenhum conselho. Cada número no painel é algo que já aconteceu nesta conta.
Como os números são construídos: ela lê até 31 dias de negociações encerradas em todos os símbolos e todos os números mágicos - é uma visão de toda a conta,
FREE

Entrar em uma operação quando o spread se ampliou discretamente custa mais do que o esperado, e isso é fácil de passar despercebido quando você está observando apenas o gráfico de um símbolo.
O Phoenix Spread Panel exibe uma tabela em tempo real com os spreads de vários símbolos ao mesmo tempo, codificados por cores em relação à média de cada símbolo, de modo que um spread em expansão fica visível antes de você colocar a ordem.
Como ele mantém os custos do spread visíveis
- Spread atua
FREE

Linhas Verticais FTU Este indicador desenha linhas verticais nos momentos de sua escolha, minuto ou hora, para mostrar o tempo passado e futuro no gráfico. Recursos: Vários horários ajustáveis Alteração da cor e quantidade de linhas Uso: Objetivo: estudar ou mensurar o preço no fechamento de barras específicas, planejar notícias futuras ou fechamento de hora, etc. Alteração da cor e quantidade de barras em relação ao intervalo. Use em qualquer período, produto/par, sem necessidade de repintura,
FREE

ATR Short Box Anchor MT5 ATR Short Box Anchor MT5 is a visual risk-reward indicator for MetaTrader 5, specifically designed for planning short setups. The indicator creates an ATR-based short box directly on the chart, including entry, stop-loss zone, take-profit zone, and optional risk-reward information. The indicator works with a freely movable anchor point. This anchor defines the desired entry price and the candle whose ATR value is used for the calculation. This allows a short setup to be
FREE

Santa Bollinger Indicator is an efficient way to detect price retracement in any market. A common approach is to identify overbought or oversold market conditions. When the price of the asset breaks below the lower band of the Bollinger Bands, prices have perhaps fallen too much and are due to bounce. On the other hand, when price breaks above the upper band, the market is perhaps overbought and due for a pullback . Advantages Generates instant buy and sell signals. Never repaints, never back
FREE
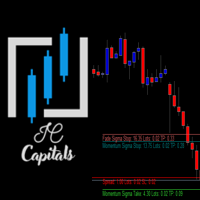
Key Features: Multi-Target Volatility: Configure multiple Take Profit and Stop Loss levels based on real-time market volatility. Fully Customizable: Set specific volatility multipliers (e.g., 4x for Stop, 10x for Take) using any look-back period (e.g., previous 20 bars on a 2-minute chart). Clear Visuals: Assign unique names to each level to be displayed directly on your symbol's chart for easy monitoring. Consistency: Every level calculated is synchronized with the volatility of your chosen per
FREE

Prop Guardian — Monitor de Perda Diária e Drawdown (Gratuito) De acordo com os dados publicados pela própria OneFunded, 78,7% das avaliações de prop firms fracassadas terminam devido à violação do limite de perda diária — não pelo drawdown global. A maioria dos traders não perde porque sua estratégia falha; eles perdem porque o único número que realmente importava não estava na tela no momento certo. O Prop Guardian coloca esse número diante dos seus olhos. O QUE ELE FAZ Monitoramento em tempo r
FREE
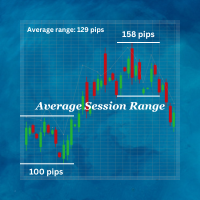
Average Session Range: Calculate and Average the Sessions High-Low Range of Specific Time Sessions Over Multiple Days. The Session Average Range is a sophisticated and precise tool designed to calculate the volatility of specific time sessions within the trading day. By meticulously analyzing the range between the high and low prices of a defined trading session over multiple days, this tool provides traders with a clear and actionable average range. **Note:** When the trading platform is closed
FREE

The Chicken Trader
Description: The Chicken Trader is a whimsical and entertaining trading algorithm inspired by the viral "Trading Chicken" sensation on social media. This Expert Advisor (EA) replicates the unpredictable trading style of the famous chicken, offering a lighthearted approach to trading.
Features: Random Market Direction : The EA randomly chooses between placing a Buy or Sell trade. Session Selection : It randomly selects one of the three major trading sessions for entry:
FREE
This is MT5 version ,MT4 version: https://www.mql5.com/zh/market/product/135163 Warning: This is Martingale EA, with extremely high risk!!! Expert Advisor (EA) is not omnipotent, using this EA means agreeing to bear the risk of all losses incurred by the EA Trading financial products such as foreign exchange and gold are high-risk products that may result in zero principal. Please be aware of the risks before trading
This is Laodengxi 429 EA FREE! This is a Martingale EA
FREE
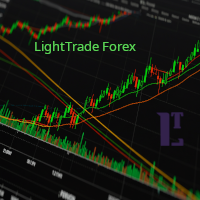
EMA Line Visualizer with Trend Analysis Description:
The Exponential Moving Average (EMA) Line Visualizer EA plots multiple EMAs on your chart (25, 50, 100, 200, and a custom EMA) and analyzes real-time trend direction. It detects whether the market is currently in an Uptrend , Downtrend , or Flat condition based on the latest EMA relationships. Features: Multi-EMA Display
Plot multiple EMAs with customizable periods. Custom Colors
Set distinct colors for each EMA line for better visual trac
FREE

Antes de instalar: o que esta ferramenta não faz. Leia isto primeiro. Se algum destes itens for o que você procura, esta é a ferramenta errada, e é melhor saber disso antes de colocá-la no seu gráfico.
- Nada de stops virtuais ou ocultos, nunca. Todo stop é um stop real no servidor da corretora, visível para a corretora e para a sua mesa proprietária. Nada é escondido de nenhuma das duas, por decisão de projeto. - Um símbolo por gráfico. A versão gratuita opera o símbolo do gráfico ao qual est
FREE

Click2FiboDrawer – Instantly Draw Fibonacci Retracement Lines with 2 Clicks Click2FiboDrawer is a powerful manual drawing tool for discretionary traders who use Fibonacci retracements in their technical analysis.
With just two mouse clicks, you can draw clean and precise Fibonacci levels directly on your chart — no clutter, no menus, no hassle. Even during fast-paced scalping sessions, this tool enables you to quickly add Fibonacci retracement levels and react to market moves in real-time.
It’s
FREE

LM Donchian Channel MT5 LM Donchian Channel MT5 is a clean and configurable technical indicator for MetaTrader 5. It displays the highest high and lowest low over a selected number of bars, creating a channel that helps users visualise recent price ranges on any chart and timeframe. The indicator is based on the classic Donchian Channel concept: Upper Channel: Highest high over the selected lookback period. Lower Channel: Lowest low over the selected lookback period. It can be used as part of yo
FREE

Pivot Point Slim Indicator Overview A professional-grade pivot point indicator equipped with 6 types of pivots. With a clean, easy-to-read design, it automatically displays important support and resistance levels on your chart. Customizable Display Settings Individual color settings for each level (P, S1-S5, R1-R5) Show/hide toggle for each level Label display on/off Price display on/off Label position (left/right) Label offset adjustment (spacing between lines and text) Line width adjustment Hi
FREE

Este indicador é baseado no indicador Média Móvel. Ele ajuda o usuário a identificar se é para comprar ou vender. Ele vem com um alerta que soará sempre que um novo sinal aparece. Ele também possui uma facilidade de e-mail. O seu endereço de e-mail e configurações do servidor SMTP devem ser especificados na janela de configurações do guia "caixa de correio" no seu MetaTrader 5. Seta azul para cima = Compra. Seta vermelha para baixo = Sell. Linha = stop móvel. Você pode usar um dos meus produtos
FREE

Free Global Stop Loss and Take Profit Setter with Break Even
Free one click Stop Loss and Take Profit tool for manual trading. Apply a fixed SL and TP to every open position on the symbol, or move them all to break even, with a single button. It only modifies Stop Loss and Take Profit levels — it never opens or closes a trade. Set your SL and TP distance in points, click once, and every position on the current symbol is protected. The break even button moves stops to entry (or a configurable num
FREE

EXPERT AMAZO DEMO é um Expert Advisor projetado especificamente para negociar WIN (mini índice) e WDO (mini dólar) e para ser usado somente em contas DEMO. A operação é baseada na abertura de ordens utilizando alguns indicadores como Sars parabólicos, médias móveis, Bandas de Bollinger, Fibonacci, etc., trabalhando de acordo com 3 modalidades de estratégia, o AMAZO procura prever os movimentos do mercado com operações contra ea favor da tendência.
Entre em nosso Grupo de WhatsAp
FREE

Ultimate Candle Countdown – Nunca mais perca o fechamento de uma vela! Leve a sua precisão no trading para o próximo nível com o Ultimate Candle Countdown – o temporizador de contagem regressiva para velas, limpo, leve e poderoso, projetado para todos os timeframes e todos os símbolos.
Seja fazendo scalping no M1, swing trade no H1 ou acompanhando fechamentos diários/semanais, esta ferramenta garante que você sempre saiba exatamente quanto tempo resta antes da próxima vela abrir. Chega de a
FREE

RaysFX Elastic Order Flow Matrix (EOFM) L'indicatore definitivo per gli Scalper e i Day Trader che operano su timeframe rapidi (M1). Il RaysFX Elastic Order Flow Matrix non è un semplice oscillatore. È un motore analitico avanzato progettato per decodificare la vera pressione compratrice o venditrice del mercato, filtrando il "rumore" tipico dei grafici a 1 minuto. Se sei stanco di farti fermare dai falsi segnali generati dalle candele di basso volume o dalla congestione, questo strumento ti
FREE

Correlation Coefficient PRO + Moving Average Advanced dual-asset correlation indicator with dynamic smoothing Overview Correlation Coefficient PRO + MA is a powerful indicator that measures the statistical correlation between the current chart symbol and any secondary instrument in real time. Displayed in a separate window, it gives traders an immediate visual reading of how two assets move in relation to each other — whether they trend together, diverge, or move inversely. The built-in Moving A
FREE

Samurai VFX Samurai VFX is a visual indicator that displays an animated samurai character directly on the chart window. It does not generate trading signals and does not modify chart data. The indicator is intended to enhance the visual appearance of the trading workspace. Features The indicator renders an animated samurai figure with multiple visual phases that cycle automatically. Each phase presents a different pose and visual effect, including a resting stance, energy aura, and a charge seq
FREE

Attention ! !! Buffer indicator, PERFECT FOR USE IN THE EXPERT ADVISOR! The DynamicFibo indicator automatically indicates horizontal Fibonacci levels on the chart online. The levels are recalculated automatically online. The levels can be calculated from the current chart as well as from any other time frame. It is convenient to use levels from an older time frame, and trade on a shorter time frame. Any levels are set manually in the indicator settings. IT is IMPORTANT to separate the levels i
FREE

RBM Volume Real PRO 3.0
O RBM Volume Real PRO 3.0 foi desenvolvido para transformar volume em informação operacional de alta precisão. Enquanto a maioria dos traders analisa apenas o deslocamento do preço, este indicador permite identificar a atuação dos participantes que realmente movimentam o mercado, revelando o equilíbrio de forças entre compradores e vendedores em tempo real.
O primeiro componente da análise é o Volume Comprador, que representa a agressão dos participantes dispostos a ex
FREE

This is a very simple backtesting tool. It starts from the most old chart in the past chart. It has 0.2pips spread, and you can do averaging 10 times. You can set the size of bars and the time frame as a parameter. You can't change the time frame during the backtest. These are the functions of buttons. ------------------------------------------------------------ Resume/Pause: Auto scroll stop and resume. Next bar: Showing candle sticks one by one. Speed1,2,3: The speed of auto scroll. Skip: ski
FREE
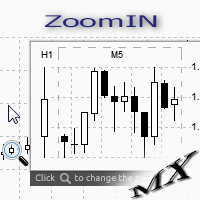
The ZoomIN MT5 indicator is designed for quickly viewing the selected bar on the smaller timeframes in a pop-up window. Once launched, the indicator works in the background, does not take up space on the chart and does not consume system resources. When the indicator is activated by the Shift + i combination (can be changed in the settings), a pop-up window with a chart of a smaller timeframe is created. The displayed timeframe can be changed by a left-click on the magnifying glass icon. To hide
FREE
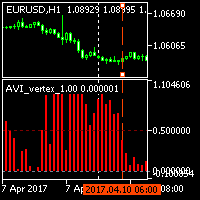
The indicator displays trend slowdown or possible end of trend and price reversal. The indicator has no parameters. When red bars appear and when they become shorter, we can talk about the approaching end of the downtrend. When green bars become shorter, we can expect the approaching end of the uptrend.
FREE

Signal Navigator - Multi-Timeframe Trend and Momentum Indicator for MetaTrader 5 Signal Navigator is a technical analysis indicator for MetaTrader 5 that combines trend analysis, momentum confirmation
and multi-timeframe market information in a single chart interface.
The indicator uses Moving Average slope analysis together with RSI conditions to evaluate the current market direction and
generate visual Buy and Sell signals. In addition, it provides an overview of the trend situation across sev
FREE
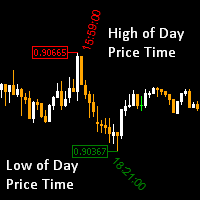
High of the Day and Low of the day Time and Price Fractal Studies is an indicator that will help you identify certain patterns that tend to repeat themseleves at certail times of the day or at certain prices.
It is used to study Daily Highs ad Lows in relation to time and price.
You will get to answer certail questions like:
At what time of day does this market usually turn around. At what price does the market turn. Is it at round numbers etc
FREE
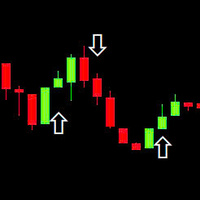
This indicator is based on the RSI (Relative Strength Index) to identify potential Breakout points and draw arrows on the chart to suggest buy/sell signals. Use RSI to find breakout signals. Draw Buy/Sell arrows on the chart. Send alerts when there is a trading signal. Buy (Orange Arrow - 0xFFAA00): When a buy signal appears. Sell (Blue Arrow - 0x0000FF): When a sell signal appears. DRAW_ARROW: Used to draw arrows on the chart.
FREE
BBTrend is a powerful trend analysis tool designed to provide a clear overview of market volatility and trends at a glance.
This indicator calculates the difference between two Bollinger Bands of different periods,
visually indicating the strength of upward or downward trends to traders. Clear Trend Visualization: The upward trend is represented in green, and the downward trend in red,
allowing traders to intuitively grasp the direction and strength of the trend. Standardized Percentage Disp
FREE
The Kalires Channel Indicator is a technical indicator used to evaluate trend direction and potential trading opportunities. This is a hybrid indicator that combines Kauffman Adaptive Moving Average (KAMA), linear regression and smoothing. The Kalires Channel Indicator consists of two lines: one central and two outer bands. The central line is a smoothed KAMA modified according to the direction of the trend. The outer bars represent two linear regression lines drawn above and below the center l
FREE
A simple tick indicator of Bid and Ask prices. The period separator (1 minute) is displayed as a histogram. Parameters Show Bid Line - show/hide the Bid line; Show Ask Line - show/hide the Ask line; Show Labels - show/hide the last price values.
FREE

This indicator shows the direction of the trend and trend change. Ganesha Trend Viewer is a trend indicator designed specifically for gold and can also be used on any financial instrument. The indicator does not redraw. Recommended time frame H1. Ganesha Trend Viewer is perfect for all Meta Trader symbols. (currencies, metals, cryptocurrencies, stocks and indices..)
Parameter setting
MA Short Period ----- Moving Average short period MA Long Period ----- Moving Average long period Alerts ON
FREE
Hello, This indicator is a unique high reliability 7-in-1 multicurrency indicator comprising these sub-indicator’s: A Trend Power Crossover Indicator. A Percent Change Crossover Indicator. A Currency Overbought/Oversold Indicator. A Currency Deviation Indicator. A Currency Impulse Signal Indicator. A Trend Power Indicator. A Currency Volatility Indicator. The main advantage of this indicator is that it's reasoning by currency and not by currency pair. The values of each sub-indicator are calcula
FREE
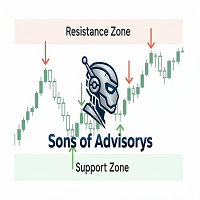
Sons of Advisorys: QuantumLevel This advanced MT5 Expert Advisor automates trading decisions based on a robust Support and Resistance breakout and retest strategy. It performs multi-timeframe analysis across H4, H1, and M15 charts to identify high-probability trade setups with precise zone validation. Key Features: Strategy: Support/Resistance breakout with retest continuation. Multi-Timeframe Detection: Independent analysis and toggle options for H4, H1, and M15 timeframes. Auto-Trading:
FREE

OmniChart is a lightweight, ultra-smooth Picture-in-Picture (PIP) chart indicator designed for professional traders who need seamless multi-timeframe analysis. Keep a close eye on lower timeframes (like M1 or M2) directly on your higher timeframe chart (like M15 or M30) without cluttering your workspace or switching profiles! Designed with a focus on pure price action , OmniChart removes all distractions. No grids, no confusing axes, no volumes—just pure, clean candlesticks to help you spot
FREE

Multi-timeframe trend indicator based on the ADX / ADXWilder indicator with Fibonacci levels
The indicator shows trend areas using ADX or ADXWilder indicator data from multiple timeframes. The impulse mode of the indicator allows you to catch the beginning of a trend, and several "Screens" with different timeframes allow you to filter out market noise. Fibonacci levels are added to the price chart, which have flexible settings.
How the indicator works: if PDI is greater than NDI, then it`s
FREE

Collective TP SL Manager is a MetaTrader 5 utility that manages a combined take-profit and stop-loss across many open positions on one symbol. Instead of setting TP/SL per order, it watches the net profit or loss of all (or filtered) positions and closes the basket when your target is reached. Features Basket-level targets: one collective take-profit and one collective stop-loss for the whole group of positions. Net P/L monitoring: continuously sums the profit/loss of all selected positions in
FREE
Introduction to GARCH Indicator GARCH is the short initial for Generalized Autoregressive Conditional Heteroskedasticity and it is the volatility prediction model commonly used in financial industry. GARCH model was first appeared in the work by Danish Economist, Tim Peter Bollerslev in 1986. The 2003 Nobel Prize winner, Robert F Engle also added much contribution for the refinement of GARCH model with Tim’s work. Our GARCH INM predictor took the original method of Nelder Mead for GARCH model bu
FREE

Reversal Oscillator — Advanced Momentum Shift Detector
Reversal Oscillator is a free indicator designed to highlight price zones that are statistically outside their normal movement patterns, helping traders anticipate potential turning points before they occur. Unlike traditional oscillators that react mainly to overbought/oversold conditions, this indicator applies third derivative analysis (the "acceleration of the acceleration" of price) calculated using two independent methods within a n
FREE

After downloading, message me via MQL5 inbox to receive your FREE User Kit - setup guide, practical checklist, and workflow resources built specifically for XAUUSD traders. If you've been trading Gold long enough, you already know the drill. Before the session opens, you pull up the chart and start looking for the same levels you've been marking every week: previous week high, previous week low, the midpoint, and yesterday's high and low. You draw them manually, label them, and keep an eye on t
FREE

Non-proprietary study of Joe Dinapoli used for overbought/oversold evaluation. Uses of Detrended Oscillator indicator Profit taking. Filter for market entry technics. Stop placement. Part of volatility breakout pattern. Determining major trend changes. Part of Dinapoli Stretch pattern. Inputs lnpPeriod: Perid of moving average Method: Calculation method ********************************************************************************* If you want to know market Overb
FREE

O indicador ColorCandlesDaily desenha candles com cores diferentes, dependendo do dia da semana.
FREE

Path of Candle Stick (Version.2) — Advanced Multi-Bollinger Band Volatility Navigator. "Not flawless, but priceless in purpose."
*** Push notifications are now available in this second version. "เปิดใช้งานระบบแจ้งเตือนแบบ Push notification แล้วในเวอร์ชันที่สองนี้"
Path of Candle Stick - The Quad-Bollinger Band Signal for MT5. *** Stop guessing where the next candle will close! *** Stop trading inside messy, cluttered charts! Maps out the exact mathematical corridors of the market using
FREE
Se você gosta deste projeto, deixe uma revisão de 5 estrelas. Como as instituições comercializam grandes volumes, não é incomum que eles
tentem tentar
defender sua posição em níveis específicos de porcentagem. Estes níveis servirão como um suporte natural e resistência que você pode usar
ou para entrar em um comércio ou estar ciente de possíveis perigos contra sua
posição. Este oscilador irá mostrar-lhe a variação percentual para o: Dia. Semana. Mês. Quarto. Ano. Em uma subjanela onde você ras
FREE

Todo trader conhece o ritual: abrir as configurações do indicador, mudar um número, clicar em OK, apertar os olhos para o gráfico, concluir que está errado e abrir as configurações de novo. O Relative Vigor Index tem só um número para definir — o período — mas essa única ida à janela de configurações continua custando o mesmo ciclo de tentativa e olhar apertado sempre que você quer comparar 10 com 14 no seu próprio ativo. O RVI Live Tuner acaba com isso. É o clássico RVI de duas linhas (RVI e o
FREE
One of the simplest Pivot Point indicator, easy to operate, and most complete for a single chart in determining Resistance and Support level lines.
In single chart, it will show R&S Level Line with 5 popular types of Pivot Point, Highest&Lowest of closing price Include the Trend and up to 3 Time Frames.
Five types (Floor, Woodie, Camarilla, DeMark, & Fibonacci) of popular Pivot Points in determining Resistance and Support levels. With just using simple button on the
FREE

Volatility Channel Indicator Ride the Waves of Market Volatility with Precision ... please leave a 5 star rating if you love this product The Indicator is free. The source code is available for just 30usd.
Are you tired of entering trades too early or too late? Missing breakouts? Getting caught in false signals? The Volatility Channel Indicator transforms chaotic price action into crystal-clear trading opportunities. What You Get (MT4 & MT5) Smart Channel Bands that
FREE

The FXmans Position Calculator is a high-precision trading tool designed for algorithmic risk management. Below is an explanation of its core components and functions in English: 1. Risk Management Engine The indicator calculates your position size based on the specific risk you are willing to take per trade. Risk Mode: You can toggle between Percent (a fixed percentage of your account balance) or Fixed USD (a static dollar amount). R/R Ratio: This determines where your Take Profit (TP) level
FREE

Trade Manager Pro is a professional MT5 trade management panel designed to simplify and speed up your trading execution. Open, manage, and close trades directly from your chart with one click — no manual calculations or menu navigation required. Key Features Automatic Risk-Based Lot Size Calculates position size automatically based on: Account balance Risk percentage Stop Loss distance Works on all instruments: Forex, Gold, Crypto, Indices One-Click Trade Execution Instantly open BUY a
FREE
Indicador “Step Channel Momentum Trend” (MT5 Indicator) Step Channel Momentum Trend é um poderoso indicador baseado em momentum projetado para dar aos traders uma vantagem adaptativa ao combinar a estrutura do mercado com a análise dinâmica de volatilidade. Esta ferramenta ajuda a distinguir claramente entre tendência e faixa, sem depender de técnicas de suavização sujeitas a atrasos, usando uma linha média de degraus exclusiva e um canal filtrado pelo ATR. Principais Recursos Linha Média Estr
FREE

Risk Basket Planner Risk Basket Planner é uma utilidade de planejamento manual de risco para MetaTrader 5. Ela ajuda o trader a planejar várias entradas, definir um Stop Loss técnico e calcular o lote e o risco real de cada camada antes da execução manual. Principais recursos Planejamento de 1 a 5 camadas de entrada . Direção BUY ou SELL . Risco definido como percentual do equity da conta . Preços L1-L5 podem ser digitados ou arrastados no gráfico. Um Stop Loss técnico comum para a cesta. Modo A
FREE

Este é um produto gratuito que pode utilizar de acordo com as suas necessidades!
Se você gostou deste indicador, por favor, deixe um breve comentário positivo! Muito obrigado!
Clique aqui para ver robôs e indicadores de negociação de alta qualidade!
Forex Indicator SWAP Display para MT5, ótima ferramenta auxiliar de negociação. - O indicador SWAP Display mostra os SWAPs atuais para negociações longas e curtas do par forex onde está anexado. - É possível localizar os valores do SWAP Display e
FREE
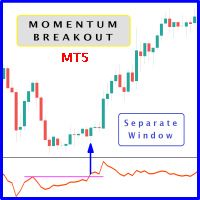
When prices breakout resistance levels are combined with momentum oscillator breaks out its historical resistance levels then probability emerges to record farther higher prices. It's strongly encouraged to confirm price breakout with oscillator breakout since they have comparable effects to price breaking support and resistance levels; certainly short trades will have the same perception. Concept is based on find swing levels which based on number of bars by each side to confirm peak or trough
FREE

Hello, trading champs! I trust you are doing well. Have you experienced entering a position where the market initially moves in your favour or approach your takeprofit then suddenly the market reversed opposite your position? Well, it has happened to me numerous times and today I decide to fight back.
I present to you a trade manager that help you protect your position(s). This project helps you set your position(s) to breakeven either when a certain amount of pips you specify is reached or a
FREE

MSX Heikin Ashi Advanced Overview MSX Heikin Ashi Advanced is a MetaTrader 5 indicator designed to provide a smoothed visual representation of price movement using a modified Heikin Ashi calculation. The indicator applies Heikin Ashi calculations to user-selected price sources and displays color-based candles that may assist with trend observation and market structure analysis. Features • Modified Heikin Ashi candle calculation • Real-time candle updates • Multiple applied price options • Color
FREE

Candle color RSI (Relative Strength Index) indicators change candlestick colors on the price chart to visually show RSI conditions like overbought/oversold levels or bullish/bearish momentum, using colors like red for overbought/bearish and green for oversold/bullish, helping traders spot reversals or strength at a glance without looking at the separate RSI pane. These custom indicators often color candles red above 70 (overbought), green below 30 (oversold), and keep default colors in between
FREE
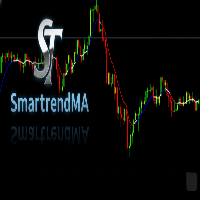
A SmartTrendMA foi projetada para identificar melhor zonas de alta, baixa e consolidação, azul alta, vermelho baixa e branco consolidação, vai te auxiliar a identificar melhor a tendência. Em parâmetro regule melhor conforme sua preferência em grau pois cada par de moeda se adequa diferentemente a cor,mude também o período e se quiser mude exponencial ou simples.
FREE
O Mercado MetaTrader é o melhor lugar para vender robôs de negociação e indicadores técnicos.
Você apenas precisa desenvolver um aplicativo para a plataforma MetaTrader com um design atraente e uma boa descrição. Nós vamos explicar como publicar o seu produto no Mercado e oferecer a milhões de usuários MetaTrader.

Você está perdendo oportunidades de negociação:
- Aplicativos de negociação gratuitos
- 8 000+ sinais para cópia
- Notícias econômicas para análise dos mercados financeiros
Registro
Login
Você concorda com a política do site e com os termos de uso
Se você não tem uma conta, por favor registre-se