 MetaTrader 5
 Experts
 Indicateurs
 Bibliothèque
 Utilitaires
 Widgets
 Règles
Regardez les tutoriels vidéo de Market sur YouTube
Comment acheter un robot de trading ou un indicateur
Exécutez votre EA sur
hébergement virtuel
hébergement virtuel
Test un indicateur/robot de trading avant d'acheter
Vous voulez gagner de l'argent sur Market ?
Comment présenter un produit pour qu'il se vende bien
Expert Advisors et indicateurs gratuits pour MetaTrader 5 - 94
 Utilisez des robots de trading et des indicateurs pour rendre le trading de forex plus rentable. Les robots de trading vous permettent d'automatiser l'ouverture et la clôture des transactions, tandis que les indicateurs vous aident à prédire le comportement du marché avec plus de précision. La page présente le catalogue des applications MetaTrader 5.

The Phoenix FVG & S&R Toolkit is a professional-grade visual engine designed to pinpoint institutional liquidity and market imbalances with surgical precision. By automating the detection of Fair Value Gaps (FVG) and Support & Resistance (S&R) zones, this tool removes the guesswork from technical analysis and helps you focus on high-probability "Smart Money" setups. The indicator identifies areas where price has moved too quickly, leaving behind "unmitigated" gaps that act as magnets for future
FREE

Inicialmente este indicador foi elaborado e pensado para rastrear pontos ou velas onde há força de tendência. Como nas grandes descobertas, cheguei ao indicador que mostra principalmente velas de reversão, pontos de tensão, alta liquidez, resistência. O indicador traz simplificação ao gráfico, indicando todos os pontos onde possivelmente teríamos lta´s, ltb´s, médias móveis, bandas, ifr alto. O indicador não faz o gerenciamento de risco, apenas mostra as velas onde podem ocorrer reversão. Lembre
FREE
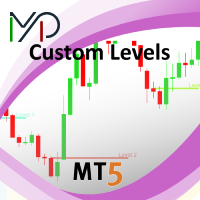
This utility identifies certain candle open times on chart, this can help you to see your favorite candle open and use it as it fits in your strategy. This tool is very useful for intraday charting and indicating your sessions. ___________________________________________________________________________________
Disclaimer: Do NOT trade or invest based upon the analysis presented on this channel. Always do your own research and due diligence before investing or trading. I’ll never tell you what
FREE
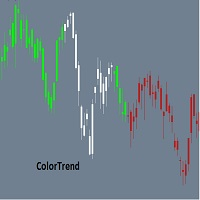
Combining the best of Price Action , Directional Movement , and Divergence / Convergence analysis, the Candle Color Trend is the easy and reliable way to identify the direction of the trend. The indicator automatically paints the candles according to the premise that the upward trend is defined by prices that form a series of ascending tops and bottoms. On the other hand, the downward trend is defined by prices that form a series of descending tops and bottoms.
Color Trend is certainly one of
FREE

MA Cross Histogram Oscillator (MT5) The MA Cross Histogram Oscillator is a custom indicator designed to visualize the relationship between two moving averages in the form of a color-coded histogram. Instead of drawing standard MA lines on the chart, it highlights the strength and direction of the trend by comparing the difference between a fast and a slow moving average. Green bars – bullish momentum (fast MA is above slow MA and rising). Red bars – bearish momentum (fast MA is below slow MA and
FREE

The "Alligator" indicator is a powerful technical analysis tool designed to assist traders on the MetaTrader 5 (MT5) platform in identifying market trends and potential price reversal points. This indicator is based on a concept developed by Bill Williams, a renowned technical analyst in the world of trading. How the Indicator Works: The Alligator indicator operates by using three Moving Average (MA) lines with different periods. These three lines are: Jaws: This is a Moving Average line with a
FREE

Volume Above Average Indicator - MQL5 Introduction The Volume Above Average Indicator is a custom indicator for the MetaTrader 5 (MQL5) platform that helps traders identify the current trading volume compared to the historical average. The indicator uses three different sensitivity levels to classify volume into weak, medium, and strong, providing a clear visualization of market momentum. Key Features Displays trading volume in a separate window. Compares the current volume with the historical a
FREE

Cyclic Trend is a MetaTrader 5 indicator that presents a confirmed market bias and an adaptive price zone. It processes price data through a proprietary cycle-detection framework and outputs two visual elements: a trend label (BULLISH, BEARISH, or NEUTRAL) and a dynamic channel that appears on the relevant side of price (lower band during bullish phases, upper band during bearish phases). Visual Output A text label in a user‑selectable corner, with customisable font, size, colour, and offset. A
FREE
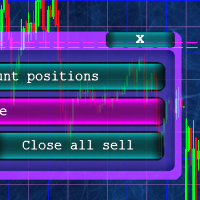
Кнопочная панель для одновременного закрывания большого числа позиций. Всего четыре варианта закрывания: Закрыть все позиции на счёте ( Close all account positions ). Закрыть все позиции по символу графика, на котором находится панель ( Close all positions ). Закрыть все Buy позиции по символу графика, на котором находится панель ( Close all Buy positions ). Закрыть все Sell позиции по символу графика, на котором находится панель ( Close all Sell positions ).
FREE
What are Donchian Channels? Donchian Channels are three lines generated by moving average calculations that comprise an indicator formed by upper and lower bands around a mid-range or median band. The upper band marks the highest price of a security over N periods while the lower band marks the lowest price of a security over N periods. The area between the upper and lower bands represents the Donchian Channel. Career futures trader Richard Donchian developed the indicator in the mid-twentieth c
FREE

ST Flow Context: The Professional Trader’s Compass ST Flow Context is a macro analysis tool developed to identify the predominant direction of institutional money. It filters out intraday noise and delivers the real market context, helping the trader never to trade against the main tide. Key Features: Trend Alignment: Identifies whether the daily flow is bullish or bearish based on multiple timeframes. Interest Zones: Maps where institutional volume is defending positions. Entry Filter: Use Flow
FREE
MACD-V — Volatility-Normalized Momentum Indicator Inspired by award-winning quantitative trader Alex Spiroglou ,
the MACD-V is a powerful evolution of the classic MACD — delivering a volatility-normalized momentum framework that produces consistent, actionable signals across all securities and timeframes. While the traditional MACD measures the difference between two EMAs, the MACD-V goes a step further by dividing this difference by the market’s volatility (ATR).
This normalization makes the
FREE

Account Profit & Loss Killer
Full Account-Level Intelligent Risk Management EA (MT5)
⸻
Product Introduction
Account Profit & Loss Killer is a true "overall account control and risk management tool".
It does not participate in any trading strategy; it focuses on only one thing:
When the total floating profit or total floating loss of all positions in the account reaches your set amount, it immediately and within milliseconds forcibly closes all orders in the account.
This is a true "
FREE

DESCRIPTION
MYTabogFX Market Structure is a clean, non-repainting indicator built to help traders identify key price action structure with clarity and precision. It highlights essential market structure movements such as Higher High (HH), Higher Low (HL), Lower High (LH), and Lower Low (LL), along with Break of Structure (BOS) and Change of Character (CHOCH). Designed for traders who rely on price action and structure-based strategies, this tool delivers a simplified, noise-free view of the
FREE

SM Telegram Scanner (Free Edition) is an efficient multi-currency market scanner for MetaTrader 5 that automatically tracks overbought and oversold conditions using the RSI indicator for EURUSD and GBPUSD , sending instant notifications directly to your Telegram. No more staring at charts for hours. The scanner works in the background and sends detailed signal alerts (currency pair, timeframe, RSI value, and current price) straight to your phone. How It Works: The Expert Advisor continuously an
FREE

️ IMPORTANT: PLEASE READ BEFORE DOWNLOADING This is a functional Core Engine to secure your license. This is NOT the full trading strategy. You can obtain the Full Spartan Forex Twin V7 Suite (the actual multi-asset profitable system) in two ways: DIRECT DOWNLOAD: Get the full package (including .set files and the setup manual) from my official repository: Notorius52/Spartan-Forex-Twin-Suite: Advanced Automated Trading System for MetaTrader 5 STEP-BY-STEP GUIDE: If you need help with installat
FREE

Super Fast Second Chart is a next-generation multi-symbol second-chart dashboard designed for traders who want to handle second charts at high speed and with lightweight performance. Equipped with second-generation that uses zero HST files —which is impossible with standard MT5—a Canvas-based ultra-high-speed rendering engine , and an optimized structure that remains lightweight even with multi-currency simultaneous display . Experience all of the ultra-high-speed chart features and cutting-edge
FREE
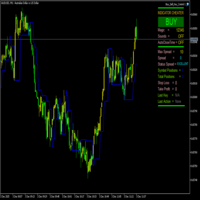
FractalBreakoutLevels Aperçu :
Cet indicateur trace des niveaux de prix dynamiques basés sur l'analyse des mouvements de prix. Il combine des données de prix historiques pour identifier des niveaux clés pouvant servir de référence pour le trading. Fonctionnement :
L'indicateur analyse la structure du marché en examinant la relation entre les données de prix actuelles et historiques. Il trace une ligne continue qui s'adapte aux conditions changeantes du marché, servant de niveau de support/rési
FREE

General Description Candle Countdown is a visual indicator for MetaTrader 5 that displays the time remaining until the current candle closes in real-time. The indicator presents information panels attached to Bid and Ask lines, showing countdown timers, current candle type, and other useful information. Key Features 1. Candle Time Display Countdown Timer : Time until candle close in MM:SS format Elapsed Time : Time since candle opening Percentage Completion : Real-time percentage of candle c
FREE

Hi everyone, I had make that product for try help you get another lever without so hard work and painful... This work on most EUR pairs, maked that for EURUSD but work one anothers, becouse the simple strategie is just follow some nicelh indicators that i use for trade... and is my strategie in a program ... i don't advise start with less that -1000 and more than 0.01 but you can find too how work the tool and how you can work with that so , i will let there a group of telegram for that , try ha
FREE

TEMA Trend Matrix PRO Elite Multi-Timeframe Trend Intelligence System
Trade With Clarity. Execute With Confidence. Stop guessing the market direction. TEMA Trend Matrix PRO is a high-performance trend intelligence dashboard built for traders who demand precision, speed, and clarity. Powered by advanced Triple Exponential Moving Average (TEMA) logic, it delivers a real-time, multi-timeframe view of market structure — all in one clean interface. No more chart switching. No more conflicting
FREE
This indicator will mirror the assets in use in another metatrader, being able to choose the timeframe and a template. This is the Metatrader 5 Client, it needs the Metatrader 4 or 5 Server versions: Metatrader 4 Mirror Chart Server: https://www.mql5.com/en/market/product/88644
Metatrader 5 Mirror Chart Server: https://www.mql5.com/en/market/product/88652 Details of how it works in the video.
FREE
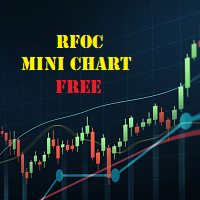
The RFOC Mini Chart was created to project a macro view of the market, which the option to select the timeframe of interest other than the main chart, it is possible to include 2 indicators: 1 - Moving average channel On the mini chart, the moving average will be created based on the prices of the selected time frame for the RFOC Mini Chart. The moving average period must be selected in the indicator settings pannel.
2 - Boillinger Band In the mini chart, a boillinger band will be created based
FREE

# MiniBull Report (v1.06) — free
**Your market briefing in a sub-window. MiniBull Report answers the questions an intraday trader asks before every decision — in plain language, in your own time zone, and with the same answers on every chart timeframe.**
*Where is price against the monthly, weekly, daily and 4H trend? How far is it stretched? How much of today's typical range is used? Where are the nearest resistance and support? Is a high-impact event coming? What speaks for a long, what spe
FREE

================================================================ MATRIX CONDITION MONITOR Live Trade Condition Panel for MetaTrader 5 Fully Automatic -- Works with ALL Matrix EAs ================================================================
NEVER MISS A TRADE SETUP AGAIN
Matrix Condition Monitor is a free utility that attaches to any chart and automatically checks all 10 trade conditions in real time -- showing you exactly why a trade will or will not open, and alerting you the moment ever
FREE

LZ Fibo Ribbon displays a smooth ribbon of four Exponential Moving Averages (EMAs) calibrated to the popular Fibonacci sequence numbers (21, 34, 55, 89) by default. This combination forms a dynamic band of support and resistance on your chart, making it easy to instantly identify trend direction, momentum, and potential pullback zones.
Feature highlights
- Trend Identification: clearly visualizes the trend direction and strength based on the spacing and order of the moving averages within the
FREE

"Are you tired of losing money on unsuccessful trades? Look no further than EA Trailing Stop! Our program is designed to help you prevent losses and control your trades efficiently. With features such as adjustable stop loss and more, you can rest assured that your trades are in good hands. Don't wait any longer to start making successful trades. Try EA Trailing Stop today!"
You can use this as a starting point and tailor it to your audience and the platform you're using. This EA Trailing Stop
FREE
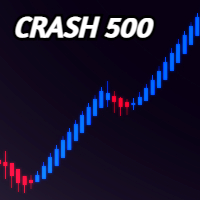
FOR CRASH 500 ONLY!! MT5
*This is a smooth heiken ashi setup meant to be used on CRASH 500 in combination with other indicators. *You are welcome to test it on other markets aswell. *I will be posting other indicators aswell to help with trading the crash 500 market. *You can use this to help smooth out price if you do struggle with reading the charts as is. * Just note heiken ashi doesnt represent real price action only smoothes it out for ease of read.
FREE

# Trade Assistant Manager
Stop calculating lot sizes by hand. Trade Assistant Manager is an on-chart panel that turns your risk settings and chart lines into a precise, ready-to-fire order — automatically.
## Key Features
**Automatic Lot Sizing** Set your risk as a percentage of account balance or a fixed dollar amount. The panel reads the distance between your Entry and Stop Loss lines and instantly calculates the exact lot size for that risk — accounting for your broker's commission per lo
FREE

MT5 Alert Indicator Please add Ema moving averages 60/100/200 & Rsi period 10 levels 30/70 to your chart. This indicator alert on a trend reversal strategy were - ema 60 > 100&200 - ema 100 < 200 And the Rsi is below 30 FOR BUY SIGNAL
Use this strategy in confluence with a larger timeframe trend in the same direction. This strategy identifies great entry opportunities to enter an early trend.
FREE
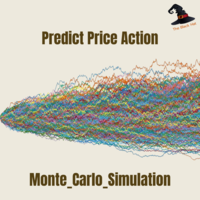
Monte Carlo simulation is an Indicator that uses a Monte Carlo model to calculate the probability of the price going up or down. If the price has a probability of going up or down more than 90%, the system will enter a trade by doing a back test of gold assets. It was found that it was able to generate a return of more than 20% in a period of 5 months while having a MAX DD of less than 7%.
What is a Monte Carlo simulation?
A Monte Carlo simulation is a model used to predict the probability of
FREE
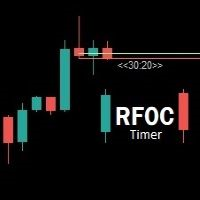
Uma informação de grande valor para o trader se localizar no tempo é a informação de quanto tempo temos para o encerramento do candle atual ou quanto falta para a formação de um novo candle. O RFOC Timer apresenta esta informação de forma clara e alocada à direita do candle atual. Adicionalmente o RFOC Timer acompanha a opção de inclusão das linhas de preços ASK e BID com e sem extensão a direita e/ou esquerda. Esta função auxilia, por exemplo, a não sobreposição das linhas de ASK e BID com as
FREE

ARC VELOCITY PULSE Parabolic SAR Direction + ROC Recovery for XAUUSD
Arc Velocity Pulse is a professional Gold trading indicator designed to identify trend-aligned recovery opportunities supported by directional movement, momentum acceleration, and volatility-based trade levels.
The indicator combines Parabolic SAR direction analysis with Rate of Change recovery confirmation, an internal Gann and Fibonacci price-alignment engine, confi
FREE

Win Streak Size Creep Mirror lit uniquement l'historique des transactions déjà clôturées de votre propre compte et compte un seul phénomène précis : l'ouverture d'une nouvelle position pendant une série de gains, avec un lot plus important que votre volume habituel. L'outil ne prédit rien et ne conseille rien. Chaque chiffre du panneau correspond à quelque chose qui s'est déjà produit sur ce compte.
Comment les chiffres sont construits : l'outil lit jusqu'à 31 jours de transactions clôturées, t
FREE

Passer un ordre alors que le spread s'est discrètement élargi coûte plus cher que prévu, et cela passe facilement inaperçu lorsque l'on ne surveille que le graphique d'un seul symbole.
Phoenix Spread Panel affiche un tableau en temps réel des spreads de plusieurs symboles à la fois, avec un code couleur correspondant à la moyenne de chaque symbole, ce qui permet de repérer un élargissement du spread avant de passer l'ordre.
Comment il permet de garder une vue d’ensemble des coûts liés aux
FREE

Lignes verticales FTU Cet indicateur trace des lignes verticales aux moments de votre choix (minutes ou heures) pour afficher le passé et le futur sur le graphique. Caractéristiques : Plusieurs heures réglables Modification de la couleur et du nombre de lignes Utilisation : Son objectif est d'étudier ou de mesurer le prix à la clôture de barres spécifiques, de planifier les actualités futures ou la clôture horaire, etc. Modification de la couleur et du nombre de barres à partir de la plage. Util
FREE
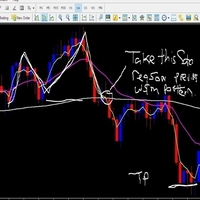
About. This indicator is the combination of 3 Exponential Moving averages, 3,13 and 144. it features Taking trades in the direction of trend, and also helps the trade to spot early trend change through Small moving averages crossing Big Moving averages Product features 1. Have built in Notification system to be set as the user desires (Alerts, Popup notification and Push Notification to Mobile devices) so with notification on, you do not need to be at home, or glued to the computer, only set and
FREE

ATR Short Box Anchor MT5 ATR Short Box Anchor MT5 is a visual risk-reward indicator for MetaTrader 5, specifically designed for planning short setups. The indicator creates an ATR-based short box directly on the chart, including entry, stop-loss zone, take-profit zone, and optional risk-reward information. The indicator works with a freely movable anchor point. This anchor defines the desired entry price and the candle whose ATR value is used for the calculation. This allows a short setup to be
FREE

If you love this indicator, please leave a positive rating and comment, it will be a source of motivation to help me create more products <3 How to use Aroon Indicator? The AroonUp and the AroonDown measure the strength of the uptrend and the strength of the downtrend, respectively. These lines fluctuate between zero and 100. Values close to 100 indicate a strong trend and values near zero indicate a weak trend where the lower the AroonUp, the weaker the uptrend and the stronger the downtrend,
FREE
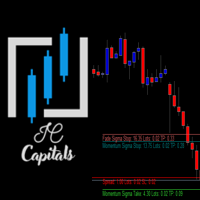
Key Features: Multi-Target Volatility: Configure multiple Take Profit and Stop Loss levels based on real-time market volatility. Fully Customizable: Set specific volatility multipliers (e.g., 4x for Stop, 10x for Take) using any look-back period (e.g., previous 20 bars on a 2-minute chart). Clear Visuals: Assign unique names to each level to be displayed directly on your symbol's chart for easy monitoring. Consistency: Every level calculated is synchronized with the volatility of your chosen per
FREE

The standard Bollinger Bands indicator has been improved by integrating additional indications from the Standard Deviation indicator (StdDev), which gives an additional filter for confirming trading signals. In addition, the color of the indicator's lines shows the beginning of a trend, its development and exhaustion. This indicator has a signal block that notifies the trader of the beginning of the trend on any time frame to which it is attached.
Settings Type of messages - select the type of
FREE

Prop Guardian — Moniteur de Perte Quotidienne et de Drawdown (Gratuit) Selon les données publiées par OneFunded elle-même, 78,7 % des évaluations échouées en prop firm se terminent par un dépassement de la limite de perte quotidienne — et non par le drawdown global. La plupart des traders ne perdent pas parce que leur stratégie échoue ; ils perdent parce que le seul chiffre qui importait vraiment n'était pas sur leur écran au bon moment. Prop Guardian l'affiche directement sous vos yeux. CE QU'I
FREE
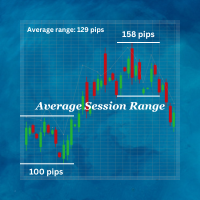
Average Session Range: Calculate and Average the Sessions High-Low Range of Specific Time Sessions Over Multiple Days. The Session Average Range is a sophisticated and precise tool designed to calculate the volatility of specific time sessions within the trading day. By meticulously analyzing the range between the high and low prices of a defined trading session over multiple days, this tool provides traders with a clear and actionable average range. **Note:** When the trading platform is closed
FREE

http://www.tradepositive.lat
ALGO Smart Flow Structure Indicator The ALGO Smart Flow Structure Indicator is designed for serious traders who use objective Market structure. Forget noise and slow indicators; this tool provides you with a crystal-clear, unambiguous view of structural breakouts across all timeframes. Based on the rigorous rules of the ALGO Smart Flow methodology, the indicator filters out internal structure and only shows you the Major Structural Points (Swing Points) , ensuri
FREE
(Multiple Close All) for MT5 a lightweight and efficient utility designed to help traders close their open positions and pending orders directly from the chart.
It provides a clean panel with interactive buttons, allowing quick closing of opened trades and deleting the Pending Orders with one click. Key Features: Close all BUY , SELL , or ALL positions with one click. Close only profitable trades or only losing trades . Close trades filtered by Magic Number or Ticket Number . Perform par
FREE
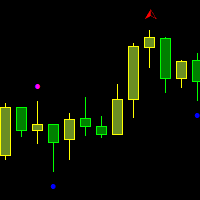
Fractals Broken/Unbroken This indicator detects classic Bill Williams fractals and separates them into two categories: broken and unbroken fractals. The tool helps traders quickly identify which fractal levels have already been broken by price action and which levels remain intact as potential support or resistance zones. The indicator works directly on the chart and displays different fractal types using separate colors for easier visual analysis. How It Works The indicator uses the standard 5-
FREE
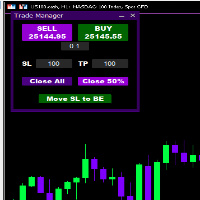
Introducing * *Trader Manager** for MetaTrader 5 - the most efficient tool for managing your trades and it's free! This smart assistant automatically sets **Stop Loss** and **Take Profit** immediately after opening a trade, saving you time and reducing the risk of errors.
With the ability to set a **Maximum Daily Loss** , you'll protect yourself from the dangers of **overtrading** and keep control of your finances.
Plus, you'll get a host of other features for easy position management: -
FREE
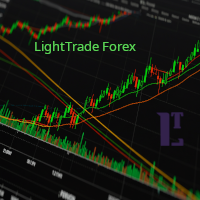
EMA Line Visualizer with Trend Analysis Description:
The Exponential Moving Average (EMA) Line Visualizer EA plots multiple EMAs on your chart (25, 50, 100, 200, and a custom EMA) and analyzes real-time trend direction. It detects whether the market is currently in an Uptrend , Downtrend , or Flat condition based on the latest EMA relationships. Features: Multi-EMA Display
Plot multiple EMAs with customizable periods. Custom Colors
Set distinct colors for each EMA line for better visual trac
FREE

Avant d'installer : ce que cet outil ne fait pas. Lisez ceci en premier. Si l'un de ces points est ce que vous cherchez, ce n'est pas le bon outil, et il vaut mieux le savoir avant qu'il ne soit sur votre graphique.
- Aucun stop virtuel ou caché, jamais. Chaque stop est un vrai stop placé côté courtier, visible par votre courtier et par votre société de prop trading. Rien n'est dissimulé à l'un ou à l'autre, par conception. - Un symbole par graphique. La version gratuite trade le symbole du gr
FREE

Click2FiboDrawer – Instantly Draw Fibonacci Retracement Lines with 2 Clicks Click2FiboDrawer is a powerful manual drawing tool for discretionary traders who use Fibonacci retracements in their technical analysis.
With just two mouse clicks, you can draw clean and precise Fibonacci levels directly on your chart — no clutter, no menus, no hassle. Even during fast-paced scalping sessions, this tool enables you to quickly add Fibonacci retracement levels and react to market moves in real-time.
It’s
FREE
EdgeZone EA Inspector - FREE Edition Monte Carlo Analysis Tool for Trading Strategies Important: This is an analysis tool, not a trading robot. It does not execute trades but analyzes strategy data through statistical simulations. The Problem Many Expert Advisors show impressive backtest results but fail in live trading. The most common reason: over-optimization - the strategy was adjusted until it looks perfect for past data, but doesn't work for the future. The Solution: EdgeZone EA Inspector
FREE

MT5 Tick History Sync – Real Tick Downloader, History Verification & Data Export Download. Synchronize. Verify. Export. Make Every Backtest Count. Are you confident that your MetaTrader 5 backtests are using complete real tick history? Missing historical ticks can compromise the reliability of your backtesting results, especially when testing scalping strategies, high-frequency trading systems, and Expert Advisors that depend on precise price movements. MT5 Tick History Sync by Zistilo is a prof
FREE
Breakout Shift Trader – MT5 Indicator Trade Like the Market Architects — Not the Victims. Most traders are fighting blind against a rigged game. Market makers engineer false breakouts, liquidity grabs, and “stop hunts” that wipe out retail accounts in seconds. Breakout Shift Trader flips the script. This MT5 indicator decodes the footprints left by institutional manipulation and aligns your trades with the power brokers driving real price action. Proven Results – Tested, Verified, Relentless N
FREE

This indicator automatically draws horizontal lines at 00s, 20s, 50s and 80s levels. If you trade ICT concepts and are an ICT Student, then you know that these levels are used as institutional support/resistance levels and/or fibonacci retracement anchor points. Features
Draws horizontal lines at 00, 20, 50 and 80 levels above and below current market price . Choose the amount of levels to show on chart Customizable line colors Recommended for forex currency pairs. Saves time looking for thes
FREE

Correlation Coefficient PRO + Moving Average Advanced dual-asset correlation indicator with dynamic smoothing Overview Correlation Coefficient PRO + MA is a powerful indicator that measures the statistical correlation between the current chart symbol and any secondary instrument in real time. Displayed in a separate window, it gives traders an immediate visual reading of how two assets move in relation to each other — whether they trend together, diverge, or move inversely. The built-in Moving A
FREE
Description This is a utility tool for MT5, and it displays some useful information on charts for discretionary trading. Some of the information obtained by using indicators that are standardly installed by MT5 or by manual calculation is displayed on the chart from the beginning.
Benefits of the This Is Something Useful MT5 The minimum necessary information that needs to be confirmed in discretionary trading can be displayed on the chart at any time. By using this tool, you can quickly access
FREE

Colors generated according to the Height and Depth parameter.
The analysis is carried out following the direction of the price and volume traded if the traded value exceeds the calculation base the system changes the color to green, informing you that the price direction is strong to buy, if the traded value is less than the calculation base the system changes to red, indicating that the price is strong for sale.
FREE

Samurai VFX Samurai VFX is a visual indicator that displays an animated samurai character directly on the chart window. It does not generate trading signals and does not modify chart data. The indicator is intended to enhance the visual appearance of the trading workspace. Features The indicator renders an animated samurai figure with multiple visual phases that cycle automatically. Each phase presents a different pose and visual effect, including a resting stance, energy aura, and a charge seq
FREE

Multichart Dashboard — Your Central Command Center for Trading
The **Multichart Dashboard** Expert Advisor transforms your MetaTrader interface into a clean, professional trading hub. Manage up to **6 charts simultaneously** , switch between symbols in an instant and always stay in control — all within one compact, fully configurable panel.
What does Multichart Dashboard do?
**Up to 6 charts in parallel** — Set the desired number of charts (1–6) with a single input. All associated charts are
FREE

Attention ! !! Buffer indicator, PERFECT FOR USE IN THE EXPERT ADVISOR! The DynamicFibo indicator automatically indicates horizontal Fibonacci levels on the chart online. The levels are recalculated automatically online. The levels can be calculated from the current chart as well as from any other time frame. It is convenient to use levels from an older time frame, and trade on a shorter time frame. Any levels are set manually in the indicator settings. IT is IMPORTANT to separate the levels i
FREE
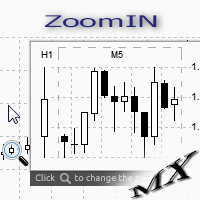
The ZoomIN MT5 indicator is designed for quickly viewing the selected bar on the smaller timeframes in a pop-up window. Once launched, the indicator works in the background, does not take up space on the chart and does not consume system resources. When the indicator is activated by the Shift + i combination (can be changed in the settings), a pop-up window with a chart of a smaller timeframe is created. The displayed timeframe can be changed by a left-click on the magnifying glass icon. To hide
FREE

Signal Navigator - Multi-Timeframe Trend and Momentum Indicator for MetaTrader 5 Signal Navigator is a technical analysis indicator for MetaTrader 5 that combines trend analysis, momentum confirmation
and multi-timeframe market information in a single chart interface.
The indicator uses Moving Average slope analysis together with RSI conditions to evaluate the current market direction and
generate visual Buy and Sell signals. In addition, it provides an overview of the trend situation across sev
FREE

RTrade panel is easy trading panel use both (Stop Loss & Take Profit) based on pips with easy interface can be use by anyone
Panel Feature: -Open position based on (Lot) size
-Auto detect entry price -Use Stop Loss based on (pips) -Use Take Profit based on ( pips ) -Close all position in one button click
i will add more function in future update if you like it write your review
FREE

A indicator for detecting FVGS
I hope this helps you scalp and generate money for yourself
NOTE BETTER:
Trading is risky and you can lose all your funds , use the money you are willing to lose
NOTE BETTER:
Trading is risky and you can lose all your funds , use the money you are willing to lose
NOTE BETTER:
Trading is risky and you can lose all your funds , use the money you are willing to lose
FREE
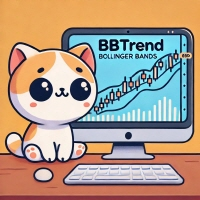
BBTrend is a powerful trend analysis tool designed to provide a clear overview of market volatility and trends at a glance.
This indicator calculates the difference between two Bollinger Bands of different periods,
visually indicating the strength of upward or downward trends to traders. Clear Trend Visualization: The upward trend is represented in green, and the downward trend in red,
allowing traders to intuitively grasp the direction and strength of the trend. Standardized Percentage Disp
FREE
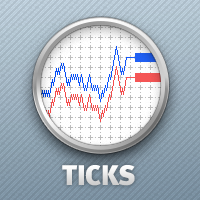
A simple tick indicator of Bid and Ask prices. The period separator (1 minute) is displayed as a histogram. Parameters Show Bid Line - show/hide the Bid line; Show Ask Line - show/hide the Ask line; Show Labels - show/hide the last price values.
FREE

Santa Donchian Indicator is an efficient way to detect support, resistence and break outs in any market.
The Donchian channel measures the high and the low of a previously defined range. Typically, a trader would look for a well-defined range and then wait for the price to break out to either one side for a trade entry trigger. Advantages Never repaints, never backpaints, never recalculates. Works in all symbols and all timeframes. Perfect trend filter for any strategy or expert advisor. Full
FREE
The Buffer Reader will help you to check and export the custom indicators buffers data for your current chart and timeframe. You can select the number of buffer and historical bars to read/export. The data can be exported in a CSV format and the files will be stored in the folder: \MQL5\Files .
How it works Put the number of buffers to read in the Buffers_Total input parameter. Put the number of rows to display in the Rows_Total. Choose the CSV separator in the parameter. Copy the correct nam
FREE
Sons of Advisorys: QuantumLevel This advanced MT5 Expert Advisor automates trading decisions based on a robust Support and Resistance breakout and retest strategy. It performs multi-timeframe analysis across H4, H1, and M15 charts to identify high-probability trade setups with precise zone validation. Key Features: Strategy: Support/Resistance breakout with retest continuation. Multi-Timeframe Detection: Independent analysis and toggle options for H4, H1, and M15 timeframes. Auto-Trading:
FREE

Multi-timeframe trend indicator based on the ADX / ADXWilder indicator with Fibonacci levels
The indicator shows trend areas using ADX or ADXWilder indicator data from multiple timeframes. The impulse mode of the indicator allows you to catch the beginning of a trend, and several "Screens" with different timeframes allow you to filter out market noise. Fibonacci levels are added to the price chart, which have flexible settings.
How the indicator works: if PDI is greater than NDI, then it`s
FREE
Savez-vous pourquoi MetaTrader Market est le meilleur endroit pour vendre des stratégies de trading et des indicateurs techniques ? Pas besoin de publicité ou de protection logicielle, pas de problèmes de paiement. Tout est fourni dans le MetaTrader Market.

Vous manquez des opportunités de trading :
- Applications de trading gratuites
- Plus de 8 000 signaux à copier
- Actualités économiques pour explorer les marchés financiers
Inscription
Se connecter
Vous acceptez la politique du site Web et les conditions d'utilisation
Si vous n'avez pas de compte, veuillez vous inscrire