 MetaTrader 5
 专家
 指标
 程序库
 实用工具
 窗口小部件
 规则
适用于MetaTrader 5的免费EA交易和指标 - 94
 使用EA交易和指标,使外汇交易获得更多盈利。EA交易可使您自动开启和关闭交易,而指标将帮助您更准确地预测市场行为。
该页面提供MetaTrader 5应用程序的目录。
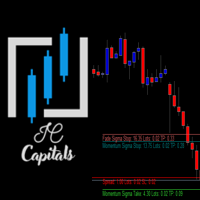
Key Features: Multi-Target Volatility: Configure multiple Take Profit and Stop Loss levels based on real-time market volatility. Fully Customizable: Set specific volatility multipliers (e.g., 4x for Stop, 10x for Take) using any look-back period (e.g., previous 20 bars on a 2-minute chart). Clear Visuals: Assign unique names to each level to be displayed directly on your symbol's chart for easy monitoring. Consistency: Every level calculated is synchronized with the volatility of your chosen per
FREE

Prop Guardian — 每日亏损与回撤监控器(免费) 根据 OneFunded 自身公布的数据,在自营交易公司(prop-firm)评估失败的案例中,有 78.7% 是因为触碰了每日亏损上限——而不是总体回撤。大多数交易员失败并不是因为他们的策略失效;他们失败是因为在关键时刻,那个至关重要的数字并没有显示在他们的屏幕上。 Prop Guardian 将其呈现在您眼前。 它的功能 实时并排追踪您的每日亏损上限和最大回撤(金额与百分比双重显示) 根据您设定的单笔交易风险,将剩余的预算换算为您还能承受的亏损交易次数 三种回撤模式:静态(static)、移动(trailing)和移动锁定(trailing-with-lock)——精准匹配不同自营公司对规则的实际定义 可配置的提前预警提醒(弹窗、声音、推送),在您接近极限之前发出警告,而非事后 它的独特之处 每一个每日亏损的计算都取决于一个数字:服务器换日时的初始净值。如果在午夜时您的终端是关闭状态,这个数字便不存在——大多数工具只会默默地进行猜测。Prop Guardian 会明确告诉您,其数值是由以下三种状态中的哪一种得出的:Li
FREE
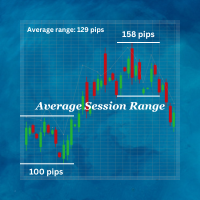
Average Session Range: Calculate and Average the Sessions High-Low Range of Specific Time Sessions Over Multiple Days. The Session Average Range is a sophisticated and precise tool designed to calculate the volatility of specific time sessions within the trading day. By meticulously analyzing the range between the high and low prices of a defined trading session over multiple days, this tool provides traders with a clear and actionable average range. **Note:** When the trading platform is closed
FREE

The Chicken Trader
Description: The Chicken Trader is a whimsical and entertaining trading algorithm inspired by the viral "Trading Chicken" sensation on social media. This Expert Advisor (EA) replicates the unpredictable trading style of the famous chicken, offering a lighthearted approach to trading.
Features: Random Market Direction : The EA randomly chooses between placing a Buy or Sell trade. Session Selection : It randomly selects one of the three major trading sessions for entry:
FREE

这是 MT5版 ,MT4版: https://www.mql5.com/zh/market/product/135163
警告:这是马丁格尔EA,风险极高!!! 专家顾问 (EA) 并非万能 ,使用该EA则同意承担EA所产生的一切损失的风险 外汇、黄金等金融产品交易是 高风险 产品,有可能让 本金归零 ,在交易前请一定了解风险 这是老登熙429EA 完全免费! 这是一款马丁格尔EA,它具有如下特征: (1倍仓位情况下)第一单是0.01手,最后一单(取决于设置的单数)是4.29手 按照等比数列加仓 自定义止盈、止损、加仓间距 自定义魔术号、注释 点差限制 重点:完全免费! 参数设置: MagicNumber = 20070429; // 魔术号 TradeComment = "Laodengxi"; // 注释 LotMultiplier = 1.0; // 仓位倍数 (1.0=标准) MaxLayers = 10; // 最大单数 StepPoints = 150; // 加仓间距 GlobalTP = 600;
FREE
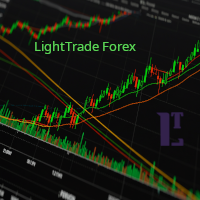
EMA Line Visualizer with Trend Analysis Description:
The Exponential Moving Average (EMA) Line Visualizer EA plots multiple EMAs on your chart (25, 50, 100, 200, and a custom EMA) and analyzes real-time trend direction. It detects whether the market is currently in an Uptrend , Downtrend , or Flat condition based on the latest EMA relationships. Features: Multi-EMA Display
Plot multiple EMAs with customizable periods. Custom Colors
Set distinct colors for each EMA line for better visual trac
FREE

安装之前:先了解本工具不做什么。请先阅读这一部分。如果以下某一项正是您想要的功能,那么这个工具并不适合您,最好在把它挂到图表之前就知道这一点。
- 绝不使用虚拟或隐藏止损。每一个止损都是真实的服务器端止损,您的经纪商和自营交易公司(prop firm)都能看到。设计上不向任何一方隐瞒任何东西。 - 每个图表只交易一个品种。免费版只交易其所挂图表的品种。其剩余风险额度预测只覆盖本面板在该品种上的交易。如果您同时交易多个品种,预测无法看到整个账户——这是单图表工具的真实能力边界,不是被关闭的功能。 - 不支持在策略测试器中交易。点击面板在测试器中无法被有意义地点击;面板只会在那里绘制出来,仅此而已。 - 不要与 Risk Sentinel 或 Prop Guardian 挂在同一图表。MetaTrader 5 每个图表只能运行一个 EA。请把账户级管理工具放在单独的图表上;Order Gatehouse 留在您实际交易的图表上。 - 不对 Mac ARM 模拟环境或内存低于 8 GB 的机器作任何承诺。本工具是免费的:请先在您自己的环境中挂载并验证,再依赖它。 - 迁移到 MQL5 V
FREE

Click2FiboDrawer – Instantly Draw Fibonacci Retracement Lines with 2 Clicks Click2FiboDrawer is a powerful manual drawing tool for discretionary traders who use Fibonacci retracements in their technical analysis.
With just two mouse clicks, you can draw clean and precise Fibonacci levels directly on your chart — no clutter, no menus, no hassle. Even during fast-paced scalping sessions, this tool enables you to quickly add Fibonacci retracement levels and react to market moves in real-time.
It’s
FREE

LM Donchian Channel MT5 LM Donchian Channel MT5 is a clean and configurable technical indicator for MetaTrader 5. It displays the highest high and lowest low over a selected number of bars, creating a channel that helps users visualise recent price ranges on any chart and timeframe. The indicator is based on the classic Donchian Channel concept: Upper Channel: Highest high over the selected lookback period. Lower Channel: Lowest low over the selected lookback period. It can be used as part of yo
FREE

枢轴点_精简版 指标 概述 这是一款专业级枢轴点指标,搭载6种枢轴计算方式。采用清晰易读的设计,自动在图表上显示重要的支撑位和阻力位。 可自定义的显示设置 各级别(P、S1-S5、R1-R5)的独立颜色设置 各级别的显示/隐藏切换 标签显示/隐藏 价格显示/隐藏 标签位置(左/右) 标签偏移调整(线条与文字间距) 线条宽度调整 历史显示数量(最多15个周期) 基本参数 Pivot Type - 枢轴计算方式选择 Traditional(传统型) - 最常见的标准枢轴计算公式(S1-S5、R1-R5) 5个支撑位和阻力位级别 适用于所有交易风格 Fibonacci(斐波那契) - 使用斐波那契比率的枢轴(S1-S3、R1-R3) 使用斐波那契比率(38.2%、61.8%) 3个支撑位和阻力位级别 最适合斐波那契交易者 Woodie(伍迪) - 重视收盘价的计算公式(S1-S4、R1-R4) 4个支撑位和阻力位级别 适合日内交易 Classic(经典型) - 经典枢轴计算公式(S1-S4、R1-R4) 4个支撑位和阻力位级别 遵循传统技术分析 DM(德马克) - 汤姆·德马克开发的计算公式
FREE

本指标基于移动平均线指标。它可帮助用户识别何处进行买入、卖出。当新信号出现时,它可发出提示和声音。它还具有发送邮件功能。您的邮件地址和 SMTP 服务器设置应该在 MetaTrader 5 的 "邮箱" 标栏里的设置窗口里指定。 蓝色向上箭头 = 买。 红色向下箭头 = 卖。 Line = 尾随终止。 您可以使用一款我的移动止损产品,来自动移动止损,并包括设置盈亏平衡。 ROMAN5 分形尾随终止 ROMAN5 抛物线SAR 尾随终止 ROMAN5 布林带尾随终止 ROMAN5 HeikenAshi 尾随终止 ROMAN5 均线尾随终止 ROMAN5 高级尾随停止
FREE

Free Global Stop Loss and Take Profit Setter with Break Even
Free one click Stop Loss and Take Profit tool for manual trading. Apply a fixed SL and TP to every open position on the symbol, or move them all to break even, with a single button. It only modifies Stop Loss and Take Profit levels — it never opens or closes a trade. Set your SL and TP distance in points, click once, and every position on the current symbol is protected. The break even button moves stops to entry (or a configurable num
FREE

EXPERT AMAZO DEMO é um Expert Advisor projetado especificamente para negociar WIN (mini índice) e WDO (mini dólar) e para ser usado somente em contas DEMO. A operação é baseada na abertura de ordens utilizando alguns indicadores como Sars parabólicos, médias móveis, Bandas de Bollinger, Fibonacci, etc., trabalhando de acordo com 3 modalidades de estratégia, o AMAZO procura prever os movimentos do mercado com operações contra ea favor da tendência.
Entre em nosso Grupo de WhatsAp
FREE

Ultimate Candle Countdown – 再也不会错过蜡烛收盘! 用 Ultimate Candle Countdown 将你的交易精确度提升到全新水平——这是一个简洁、轻量且强大的蜡烛倒计时工具,适用于所有周期和所有品种。
无论你是在 M1 上剥头皮,在 H1 上波段交易,还是盯着日线/周线收盘,这个工具都能确保你随时清楚下一根蜡烛开启前还剩多少时间。告别猜测 —— 保持敏锐,领先一步。 核心功能 支持所有周期 —— 从 1 分钟到月线,可靠又精准。 可视化倒计时 —— 以 时:分:秒 格式显示剩余时间,每秒平滑更新。 颜色提示 —— 可自定义普通、警告和关键颜色,一眼识别时间是否将尽。 可选百分比显示 —— 一目了然地看到蜡烛已完成的进度。 进度条 —— 倒计时下方的简洁视觉条。 周期标签 —— 始终知道自己在监控哪个图表周期。 智能定位 —— 倒计时“悬浮”在最新蜡烛附近,自动避免与价格线重叠。 交易者为什么喜欢它 超轻量级 —— 专为 MT5 优化,无延迟,无冗余。 完全可定制 —— 可切换进度条、百分比和周期标签,匹配你的交易风格。 专业设计
FREE

RaysFX Elastic Order Flow Matrix (EOFM) L'indicatore definitivo per gli Scalper e i Day Trader che operano su timeframe rapidi (M1). Il RaysFX Elastic Order Flow Matrix non è un semplice oscillatore. È un motore analitico avanzato progettato per decodificare la vera pressione compratrice o venditrice del mercato, filtrando il "rumore" tipico dei grafici a 1 minuto. Se sei stanco di farti fermare dai falsi segnali generati dalle candele di basso volume o dalla congestione, questo strumento ti
FREE

Correlation Coefficient PRO + Moving Average Advanced dual-asset correlation indicator with dynamic smoothing Overview Correlation Coefficient PRO + MA is a powerful indicator that measures the statistical correlation between the current chart symbol and any secondary instrument in real time. Displayed in a separate window, it gives traders an immediate visual reading of how two assets move in relation to each other — whether they trend together, diverge, or move inversely. The built-in Moving A
FREE

FREE

Attention ! !! Buffer indicator, PERFECT FOR USE IN THE EXPERT ADVISOR! The DynamicFibo indicator automatically indicates horizontal Fibonacci levels on the chart online. The levels are recalculated automatically online. The levels can be calculated from the current chart as well as from any other time frame. It is convenient to use levels from an older time frame, and trade on a shorter time frame. Any levels are set manually in the indicator settings. IT is IMPORTANT to separate the levels i
FREE

RBM Volume Real PRO 3.0
RBM Volume Real PRO 3.0 was developed to transform volume data into actionable market intelligence. While most traders focus exclusively on price movement, this indicator allows users to identify the participants truly driving the market by revealing the balance of power between buyers and sellers in real time.
The first component is Buy Volume, which represents the aggression of participants willing to execute orders at the asking price. Conversely, Sell Volume measur
FREE

This is a very simple backtesting tool. It starts from the most old chart in the past chart. It has 0.2pips spread, and you can do averaging 10 times. You can set the size of bars and the time frame as a parameter. You can't change the time frame during the backtest. These are the functions of buttons. ------------------------------------------------------------ Resume/Pause: Auto scroll stop and resume. Next bar: Showing candle sticks one by one. Speed1,2,3: The speed of auto scroll. Skip: ski
FREE
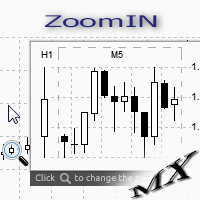
The ZoomIN MT5 indicator is designed for quickly viewing the selected bar on the smaller timeframes in a pop-up window. Once launched, the indicator works in the background, does not take up space on the chart and does not consume system resources. When the indicator is activated by the Shift + i combination (can be changed in the settings), a pop-up window with a chart of a smaller timeframe is created. The displayed timeframe can be changed by a left-click on the magnifying glass icon. To hide
FREE
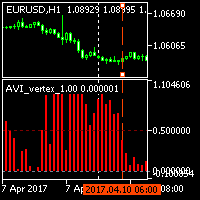
The indicator displays trend slowdown or possible end of trend and price reversal. The indicator has no parameters. When red bars appear and when they become shorter, we can talk about the approaching end of the downtrend. When green bars become shorter, we can expect the approaching end of the uptrend.
FREE

Signal Navigator - Multi-Timeframe Trend and Momentum Indicator for MetaTrader 5 Signal Navigator is a technical analysis indicator for MetaTrader 5 that combines trend analysis, momentum confirmation
and multi-timeframe market information in a single chart interface.
The indicator uses Moving Average slope analysis together with RSI conditions to evaluate the current market direction and
generate visual Buy and Sell signals. In addition, it provides an overview of the trend situation across sev
FREE
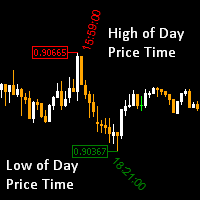
High of the Day and Low of the day Time and Price Fractal Studies is an indicator that will help you identify certain patterns that tend to repeat themseleves at certail times of the day or at certain prices.
It is used to study Daily Highs ad Lows in relation to time and price.
You will get to answer certail questions like:
At what time of day does this market usually turn around. At what price does the market turn. Is it at round numbers etc
FREE
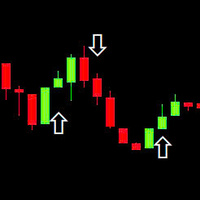
This indicator is based on the RSI (Relative Strength Index) to identify potential Breakout points and draw arrows on the chart to suggest buy/sell signals. Use RSI to find breakout signals. Draw Buy/Sell arrows on the chart. Send alerts when there is a trading signal. Buy (Orange Arrow - 0xFFAA00): When a buy signal appears. Sell (Blue Arrow - 0x0000FF): When a sell signal appears. DRAW_ARROW: Used to draw arrows on the chart.
FREE
BBTrend is a powerful trend analysis tool designed to provide a clear overview of market volatility and trends at a glance.
This indicator calculates the difference between two Bollinger Bands of different periods,
visually indicating the strength of upward or downward trends to traders. Clear Trend Visualization: The upward trend is represented in green, and the downward trend in red,
allowing traders to intuitively grasp the direction and strength of the trend. Standardized Percentage Disp
FREE
The Kalires Channel Indicator is a technical indicator used to evaluate trend direction and potential trading opportunities. This is a hybrid indicator that combines Kauffman Adaptive Moving Average (KAMA), linear regression and smoothing. The Kalires Channel Indicator consists of two lines: one central and two outer bands. The central line is a smoothed KAMA modified according to the direction of the trend. The outer bars represent two linear regression lines drawn above and below the center l
FREE

This indicator shows the direction of the trend and trend change. Ganesha Trend Viewer is a trend indicator designed specifically for gold and can also be used on any financial instrument. The indicator does not redraw. Recommended time frame H1. Ganesha Trend Viewer is perfect for all Meta Trader symbols. (currencies, metals, cryptocurrencies, stocks and indices..)
Parameter setting
MA Short Period ----- Moving Average short period MA Long Period ----- Moving Average long period Alerts ON
FREE
Hello, This indicator is a unique high reliability 7-in-1 multicurrency indicator comprising these sub-indicator’s: A Trend Power Crossover Indicator. A Percent Change Crossover Indicator. A Currency Overbought/Oversold Indicator. A Currency Deviation Indicator. A Currency Impulse Signal Indicator. A Trend Power Indicator. A Currency Volatility Indicator. The main advantage of this indicator is that it's reasoning by currency and not by currency pair. The values of each sub-indicator are calcula
FREE
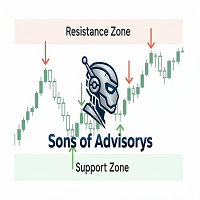
Sons of Advisorys: QuantumLevel This advanced MT5 Expert Advisor automates trading decisions based on a robust Support and Resistance breakout and retest strategy. It performs multi-timeframe analysis across H4, H1, and M15 charts to identify high-probability trade setups with precise zone validation. Key Features: Strategy: Support/Resistance breakout with retest continuation. Multi-Timeframe Detection: Independent analysis and toggle options for H4, H1, and M15 timeframes. Auto-Trading:
FREE

OmniChart is a lightweight, ultra-smooth Picture-in-Picture (PIP) chart indicator designed for professional traders who need seamless multi-timeframe analysis. Keep a close eye on lower timeframes (like M1 or M2) directly on your higher timeframe chart (like M15 or M30) without cluttering your workspace or switching profiles! Designed with a focus on pure price action , OmniChart removes all distractions. No grids, no confusing axes, no volumes—just pure, clean candlesticks to help you spot
FREE

Multi-timeframe trend indicator based on the ADX / ADXWilder indicator with Fibonacci levels
The indicator shows trend areas using ADX or ADXWilder indicator data from multiple timeframes. The impulse mode of the indicator allows you to catch the beginning of a trend, and several "Screens" with different timeframes allow you to filter out market noise. Fibonacci levels are added to the price chart, which have flexible settings.
How the indicator works: if PDI is greater than NDI, then it`s
FREE

Collective TP SL Manager is a MetaTrader 5 utility that manages a combined take-profit and stop-loss across many open positions on one symbol. Instead of setting TP/SL per order, it watches the net profit or loss of all (or filtered) positions and closes the basket when your target is reached. Features Basket-level targets: one collective take-profit and one collective stop-loss for the whole group of positions. Net P/L monitoring: continuously sums the profit/loss of all selected positions in
FREE
Introduction to GARCH Indicator GARCH is the short initial for Generalized Autoregressive Conditional Heteroskedasticity and it is the volatility prediction model commonly used in financial industry. GARCH model was first appeared in the work by Danish Economist, Tim Peter Bollerslev in 1986. The 2003 Nobel Prize winner, Robert F Engle also added much contribution for the refinement of GARCH model with Tim’s work. Our GARCH INM predictor took the original method of Nelder Mead for GARCH model bu
FREE

Reversal Oscillator — Advanced Momentum Shift Detector
Reversal Oscillator is a free indicator designed to highlight price zones that are statistically outside their normal movement patterns, helping traders anticipate potential turning points before they occur. Unlike traditional oscillators that react mainly to overbought/oversold conditions, this indicator applies third derivative analysis (the "acceleration of the acceleration" of price) calculated using two independent methods within a n
FREE

After downloading, message me via MQL5 inbox to receive your FREE User Kit - setup guide, practical checklist, and workflow resources built specifically for XAUUSD traders. If you've been trading Gold long enough, you already know the drill. Before the session opens, you pull up the chart and start looking for the same levels you've been marking every week: previous week high, previous week low, the midpoint, and yesterday's high and low. You draw them manually, label them, and keep an eye on t
FREE

Non-proprietary study of Joe Dinapoli used for overbought/oversold evaluation. Uses of Detrended Oscillator indicator Profit taking. Filter for market entry technics. Stop placement. Part of volatility breakout pattern. Determining major trend changes. Part of Dinapoli Stretch pattern. Inputs lnpPeriod: Perid of moving average Method: Calculation method ********************************************************************************* If you want to know market Overb
FREE


Path of Candle Stick (Version.2) — Advanced Multi-Bollinger Band Volatility Navigator. "Not flawless, but priceless in purpose."
*** Push notifications are now available in this second version. "เปิดใช้งานระบบแจ้งเตือนแบบ Push notification แล้วในเวอร์ชันที่สองนี้"
Path of Candle Stick - The Quad-Bollinger Band Signal for MT5. *** Stop guessing where the next candle will close! *** Stop trading inside messy, cluttered charts! Maps out the exact mathematical corridors of the market using
FREE
如果你象这个项目一样,就有5个饥饿审查。 由于机构贸易量很大,因此它们不愿意努力设法争取。
在特定百分比上捍卫立场。 这些级别将成为你可以利用的自然支持和抵抗力。
进入贸易或了解对你立场的可能危险。 提名人将显示: 日。 周。 Month. 资格。 年。 在你追踪你们的支持和抵抗的温床。
FREE

每位交易者都熟悉这套流程:打开指标设置,改一个数字,点确定,盯着图表眯眼看半天,觉得不对,再打开设置。Relative Vigor Index 只有一个数字要设——周期——但每次想在自己的品种上把 10 和 14 做个对比,光是进出这一次对话框,仍然要付出同样的「改完再猜」的代价。RVI Live Tuner 终结了这一切。 它就是经典的双线 RVI(RVI 与它的 Signal),而且可以 直接在图表上实时调节 。图表上有一个小面板,带一个周期滑块。拖动它,两条线立即重算并重绘,全程尽在眼前。「10 还是 14」这个问题——在自己的图表上几秒钟就有答案,不必去论坛翻帖子。 真正的 RVI,不是套壳。 指标采用自己的教科书式实现:对 4 根K线做对称加权的 close-to-open 涨跌与 high-to-low 波幅,各自用周期长度的简单移动平均(SMA)平滑,两者之比即 RVI,Signal 则是对 RVI 本身再做同样的 4 根K线加权——中间不调用任何内置句柄。你调的,正是你看到的。不重绘。 还有实时样式编辑器。 用 16 色调色板和 RGB 滑块调整 RVI 线与 Sign
FREE

One of the simplest Pivot Point indicator, easy to operate, and most complete for a single chart in determining Resistance and Support level lines.
In single chart, it will show R&S Level Line with 5 popular types of Pivot Point, Highest&Lowest of closing price Include the Trend and up to 3 Time Frames.
Five types (Floor, Woodie, Camarilla, DeMark, & Fibonacci) of popular Pivot Points in determining Resistance and Support levels. With just using simple button on the
FREE

Volatility Channel Indicator Ride the Waves of Market Volatility with Precision ... please leave a 5 star rating if you love this product The Indicator is free. The source code is available for just 30usd.
Are you tired of entering trades too early or too late? Missing breakouts? Getting caught in false signals? The Volatility Channel Indicator transforms chaotic price action into crystal-clear trading opportunities. What You Get (MT4 & MT5) Smart Channel Bands that
FREE

The FXmans Position Calculator is a high-precision trading tool designed for algorithmic risk management. Below is an explanation of its core components and functions in English: 1. Risk Management Engine The indicator calculates your position size based on the specific risk you are willing to take per trade. Risk Mode: You can toggle between Percent (a fixed percentage of your account balance) or Fixed USD (a static dollar amount). R/R Ratio: This determines where your Take Profit (TP) level
FREE

Trade Manager Pro is a professional MT5 trade management panel designed to simplify and speed up your trading execution. Open, manage, and close trades directly from your chart with one click — no manual calculations or menu navigation required. Key Features Automatic Risk-Based Lot Size Calculates position size automatically based on: Account balance Risk percentage Stop Loss distance Works on all instruments: Forex, Gold, Crypto, Indices One-Click Trade Execution Instantly open BUY a
FREE
“Step Channel Momentum Trend” 指标 (MT5 Indicator) Step Channel Momentum Trend 是一款强大的基于动量的指标,旨在为交易者提供适应性的优势,通过将市场结构与动态波动性分析相结合。这个工具帮助你清晰地区分趋势与区间,而不依赖于容易出现滞后的平滑技术,采用独特的阶梯中线和ATR过滤通道。 主要功能 结构性阶梯中线 系统的核心是一条仅基于确认的价格枢轴的“阶梯”中线。 仅在确认新的高点或低点时重新计算,因此避免了不必要的滞后,能够即时反应市场结构的变化。 这种逐步方式创建了清晰的区域变化,并使您保持在价格现实中,而不是被指标噪声干扰。 中线指出近期多头和空头之间的平衡,作为方向、突破或回调的可靠参考点。 动态波动性区间 上下通道边界使用平均真实波动范围 (ATR) 设置,灵活适应当前的波动性。 边界在活跃市场中扩展,在平静时期收缩,确保仅重要的价格扩展被标记为高动量事件。 价格在通道内 = 低动量(区间)。价格在通道外 = 突破趋势,立即在您的图表上可见。 动量驱动的蜡烛颜色 蜡烛的颜色不仅是装饰 — 它们是实时动量
FREE

Risk Basket Planner Risk Basket Planner 是一款用于 MetaTrader 5 的手动篮子风险规划工具。它帮助交易者设置多个入场层级、技术止损,并在手动交易前计算每一层的手数和实际总风险。 主要功能 支持 1 到 5 个入场层级 。 可选择 BUY 或 SELL 方向。 风险按 账户净值 Equity 的百分比设置。 L1-L5 入场价格可直接输入或在图表上拖动。 所有层级共用一个 技术止损 。 Auto SL 预设:80%、100%、120%。 Manual SL 模式可由交易者精确设置止损价格。 修改入场、止损、风险%、方向或层级数量后自动重新计算。 尝试在各活跃层之间平均分配风险,并显示 经过经纪商最小手数/步进取整后的实际风险 。 显示每层手数、风险%、风险金额、总手数、目标风险和实际篮子风险。 显示当前点差以及点差与最近止损距离的关系。 当止损距离过近,或经纪商最小手数导致目标风险无法实现时给出提示。 可移动面板,支持最小化、恢复和关闭。 根据经纪商的交易品种规格进行计算,可用于经纪商支持的 Forex、贵金属和 CFD。 重要说明 本工
FREE

这是免费产品,欢迎您使用以满足您的需求!
如果您喜欢这个指标,请留下简短的好评!非常感谢!
点击这里查看高质量的交易机器人和指标! .................................................................................... MT5 外汇指标 SWAP 显示,出色的辅助交易工具。 .................................................................................... - SWAP 显示指标显示其所连接的外汇对的多头和空头交易的当前 SWAP。 - 可以在图表的任何角落找到 SWAP 显示值. - 也可以设置颜色和字体大小。 - 每个交易者在保持交易超过 1 天时都应该知道 SWAP。 这是仅在此 MQL5 网站上提供的原创产品。
FREE
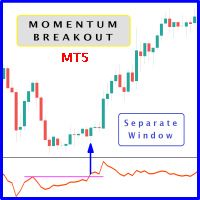
When prices breakout resistance levels are combined with momentum oscillator breaks out its historical resistance levels then probability emerges to record farther higher prices. It's strongly encouraged to confirm price breakout with oscillator breakout since they have comparable effects to price breaking support and resistance levels; certainly short trades will have the same perception. Concept is based on find swing levels which based on number of bars by each side to confirm peak or trough
FREE

各位交易高手們,你們好!相信你們一定做得很好。你們有沒有遇過這樣的情況:市場最初走勢對你有利,或接近你的止盈目標,然後突然反轉,與你的部位方向相反?這種情況我遇過很多次,今天我決定反擊。
我向你們介紹一款交易管理器,它可以幫助你保護你的部位。這個項目可以幫助你將部位設定為損益平衡,當達到你指定的點數或止盈的一定百分比時,即可達到損益平衡,取決於你選擇的模式。
此外,這個專案還可以幫助你追蹤部位,當部位達到你指定的點數或止盈的一定百分比時,即可達到損益平衡,取決於你選擇的模式。 MT4: https://www.mql5.com/en/market/product/144196
使用方法 只需將 EA 應用於活躍貨幣對(例如 BTCUSD 或 XAUUSD),然後相應地設定損益平衡和交易參數即可。
注意: EA 不依賴價格變動。即使應用該功能的圖表沒有出現任何價格變動或價格波動,它也能管理您的所有部位。
祝您好運,交易順利。
FREE

MSX Heikin Ashi Advanced Overview MSX Heikin Ashi Advanced is a MetaTrader 5 indicator designed to provide a smoothed visual representation of price movement using a modified Heikin Ashi calculation. The indicator applies Heikin Ashi calculations to user-selected price sources and displays color-based candles that may assist with trend observation and market structure analysis. Features • Modified Heikin Ashi candle calculation • Real-time candle updates • Multiple applied price options • Color
FREE

Candle color RSI (Relative Strength Index) indicators change candlestick colors on the price chart to visually show RSI conditions like overbought/oversold levels or bullish/bearish momentum, using colors like red for overbought/bearish and green for oversold/bullish, helping traders spot reversals or strength at a glance without looking at the separate RSI pane. These custom indicators often color candles red above 70 (overbought), green below 30 (oversold), and keep default colors in between
FREE
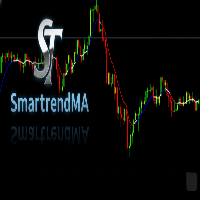
A SmartTrendMA foi projetada para identificar melhor zonas de alta, baixa e consolidação, azul alta, vermelho baixa e branco consolidação, vai te auxiliar a identificar melhor a tendência. Em parâmetro regule melhor conforme sua preferência em grau pois cada par de moeda se adequa diferentemente a cor,mude também o período e se quiser mude exponencial ou simples.
FREE

Sentimento de Mercado é um indicador que usa os dados do nosso principal indicador: Market Strength Radar.: https://www.mql5.com/pt/market/product/114568?source=Site +Profile+Seller Ele imprime um gráfico de linhas que deve ser comparado com o gráfico de preço para entendermos o sentimento do mercado. As divergencias são pontos importantes de inflexão. As convergências mostram força da tendência atual.
FREE
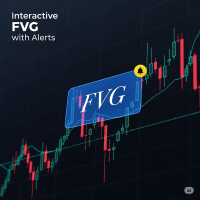
FVG Indicator with Alerts Description: This is a simple and effective indicator for identifying and displaying Fair Value Gaps (FVGs) on any timeframe. The indicator helps you see important price imbalances and provides powerful interactive tools for your analysis. Key Features: Detects FVGs: Clearly identifies and draws boxes around Bullish and Bearish Fair Value Gaps. Midline Level: Displays the 50% equilibrium level inside each FVG box, a critical point of interest. Complete Alert System: Rec
FREE
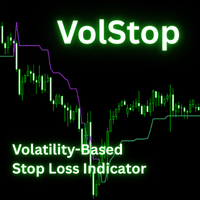
The VolStop Adaptive Volatility-Based Trailing Stop Indicator for MT5 VolStop is a precision volatility-stop indicator for MetaTrader 5, built for traders who want to stay in winning trades longer and exit with discipline. Instead of fixed pips or moving averages, VolStop dynamically tracks price action with ATR-based bands, automatically adapting to market turbulence. Key Features Adaptive Volatility Stops – Calculates a dynamic trailing stop using ATR and a user-set multiplier to match changi
FREE

The euro index on your chart, built live from your own broker's five euro pairs. When EURUSD falls you cannot tell from EURUSD alone whether the euro is weak or the dollar is strong. An index answers it. Put this under any chart and you are looking at the euro on its own terms, measured against the pound, the yen, the franc and the krona as well as the dollar. It uses the New York Board of Trade Euro Currency Index formula. EUR/USD 31.55% EUR/GBP 30.56% EUR/JPY 18.91% EUR/CHF 11.13% EUR/SEK 7.85
FREE

FVG Concept and Market Structure (MS) Indicator – Comprehensive Analysis with Interactive Control This is not just an indicator. It is a useful tool for market analysis. This indicator combines several analytical functions, making it one of the more complete solutions in its field. This tool represents a comprehensive solution for analyzing market behavior with the goal of forecasting the direction of price movement. The indicator is designed to assist the trader and not distract them with unnec
FREE

BS Trade Panel: Revolutionize Your Trading Approach Introducing the BS Trade Panel , the ultimate solution for traders seeking efficiency, speed, and accuracy in their market operations. Crafted with cutting-edge technology, our panel is designed to simplify your trading, making it more intuitive, swift, and effective. Innovative Features: Quick Orders with Shortcut Keys: Execute market orders or pending orders swiftly using configurable shortcut keys. Perfect for traders who need speed when ent
FREE

QuantumFX Trade Manager Advanced Order & Risk Control Utility for MT5 QuantumFX Trade Manager is a powerful, professional-grade trade management utility designed for traders who want absolute control over execution, risk, and position handling — directly from an intuitive on-chart panel. Built for manual, semi-automated, and discretionary traders , QuantumFX transforms MetaTrader 5 into a precision trading workstation , allowing you to manage trades faster, safer, and smarter. What
FREE

Introducing Steady Runner NP EA (Free Version): Precision Trading for GBPUSD M5 What is Steady Runner NP EA?
Steady Runner NP EA is a mathematically designed Expert Advisor (EA) exclusively crafted for the GBPUSD M5 timeframe . Built with advanced algorithms and statistical models, this EA automates your trading strategy to deliver precision, consistency, and discipline in every trade. Whether you're a seasoned trader or just starting out, Steady Runner NP EA is your reliable par
FREE

Mahdad Candle Timer 是一款轻量级且精确的 MetaTrader 5 指标,它会在最新一根K线旁边显示当前K线的剩余时间。该工具专为依赖精准时机的交易者设计——无论是剥头皮、日内交易,还是等待K线确认的波段交易。 主要功能 精准倒计时 – 以 HH:MM:SS 显示剩余时间(可选毫秒) 动态定位 – 始终与最新K线对齐,不受图表缩放或比例影响 智能颜色适配 – 文本颜色会根据背景和K线方向(看涨/看跌)自动调整 自定义提醒 – 在K线收盘前X秒发出声音或弹窗提醒 完全可定制 – 字体、大小、颜色、刷新速度和提醒参数均可调整 轻量高效 – 占用极低CPU资源,不影响其他指标或EA运行 ️ 输入参数 ShowMilliseconds (true/false) Update Interval (ms) Bullish/Bearish Colors (Light/Dark) Font & Size Enable Alarm (true/false) Alert Seconds Before Close Alert Sound File 使用场景 剥头皮交易者
FREE

Multi-timeframe trend indicator, based on the ADX / ADXWilder indicator The indicator shows trend areas using ADX or ADXWilder indicator data from multiple timeframes. The impulse mode of the indicator allows you to catch the beginning of a trend, and several "Screens" with different timeframes allow you to filter out market noise.
How the indicator works: if PDI is greater than NDI, then it`s bullish movement; if PDI is less than NDI, then it`s bearish movement; to determine any trend, it is
FREE

DS Trend is a free trend indicator that colorizes candles directly on the chart, making it easy to identify the current market direction at a glance.
Candle colors: - Blue: uptrend in progress - Gray: neutral market / consolidation - Red: downtrend in progress
Parameters: - Period (default 20): controls the indicator responsiveness to recent price action - Sensitivity (default 2): adjusts the threshold for trend detection
Works on all symbols and timeframes. No repainting. Simple visual read
FREE
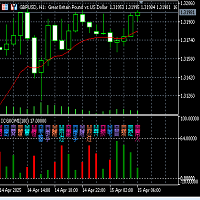
伏羲卦象双色震荡指示器功能及使用说明(V2.1) 伏羲卦象双色震荡指示器指标说明: (1)本卦象变化指标是根据中国古代文化中"易经"哲学的阴阳转化思想,融合金融交易K线图每一蜡烛图K线周期多空相互博弈的结果,用中国最古老的预测编码方法,以易经伏羲64卦象的形式,将卦象的每一爻的阴阳和蜡烛K线图的阴阳结合在一起,实时绘制在交易图表子窗口的每一根K线图的下方, 以表示未来的K线的走向趋势。 (2)指标在子窗口的左上侧只显示当前蜡烛K线所对应的卦数,非当前K线的卦象指标是在K线的每个蜡烛下方标注了对应的卦名。 (3)本指标同时又将主图中卦象的变化,再以卦数双色柱状图在子窗口绘制,更直观地标示每根蜡烛K线对应的卦象的形态变化,预示未来的可能走向. (3)本指标的重大创新意义: a:突破传统的三根或者两根K线的组合预测,而是用六根K线的组合装成卦象进行多空的预示。通过卦象的变化,交易者一定会有全新的交易灵感. B:与单纯的主图卦象指标不同,本指标的特点,直观且易于交易者实现报警提醒或者以此指标的信号进行EA交易系统的开发. (4)本指标适合所有时间框架.卦名卦象随K线的变化自动更新。 (5
FREE

This indicator, the Phoenix Moving Average Panel, is a professional-grade visual dashboard designed to remove guesswork from trend-following strategies. It transforms a standard Moving Average into a functional trading workstation. Here is how it assists a trader in making precise decisions: 1. Identifying the Buy/Sell Zone (The Trend Matrix) Instead of looking at just one line, the panel provides a Three-Tier Trend Confirmation: Current Trend: Shows the immediate momentum on your active chart.
FREE
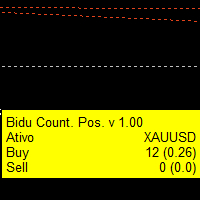
Indicador que cria um painel para acompanhamento to total de posições abertas no ativo do gráfivo.
São apresentados os dados: Ativo do gráfico Total de posições de venda em aberto Quantidade do volume de posições de venda em aberto Total de posições de compra em aberto Quantidade do volume de posições de compra em aberto.
Painel simples mas eficiente para o equilíbrio das ordens
FREE

パラボリックのデータをもとにトレンドの方向性を1分足から月足まで表示します。 1分足から 月足 まで表示されているので今どの方向に価格が動いているのかがすぐに分かります。
更新はティク毎ではなくディフォルトでは1秒毎、もちろん変更も可能なのでチャートの表示が遅くなるようなことはありません。
機能:
どの通貨でも表示可能になります。
アイコンの色を指定することが可能になります。
表示位置(X軸、Y軸)が変更可能 になります。
表示位置 (左上 、 右上 、 左下 、 右下) が 指定 が可能 になります。
フォント を指定することが可能になります。
フォントサイズ が 変更可能 になります。
アイコンのサイズ が 変更可能 になります。
週足、 月足 の非表示 が 可能 になります。
FREE

This MQL5 script is a Dynamic Support & Resistance (S/R) Investigator. It functions as a real-time analytical tool that identifies key price levels and mathematically evaluates their "durability" based on historical interactions. Unlike static indicators, it uses a custom Graphical User Interface (GUI) to provide a live dashboard of market structure. 1. Level Detection Logic The indicator scans the most recent InpPeriod (lookback) of bars to identify the absolute highest peak (Resistance) and t
FREE
MetaTrader市场是一个简单方便的网站,在这里开发者可以出售自己的交易应用程序。
我们将帮助您发布您的产品,并向您解释如何为市场准备您的产品描述。市场上所有的应用程序都是加密保护并且只能在买家的电脑上运行。非法拷贝是不可能的。
