Fan sayfamıza katılın

Calculation of the 3-rd Elliott wave - MetaTrader 4 için komut dosyası
- Görüntülemeler:
- 17454
- Derecelendirme:
- Yayınlandı:
- Güncellendi:
-
 Alım-satım fırsatlarını kaçırıyorsunuz:
- Ücretsiz alım-satım uygulamaları
- İşlem kopyalama için 8.000'den fazla sinyal
- Finansal piyasaları keşfetmek için ekonomik haberler
Kayıt Giriş yapWeb sitesi politikasını ve kullanım şartlarını kabul edersiniz
Hesabınız yoksa, lütfen kaydolun -
 Bu koda dayalı bir robota veya göstergeye mi ihtiyacınız var? Freelance üzerinden sipariş edin
Freelance'e git
Bu koda dayalı bir robota veya göstergeye mi ihtiyacınız var? Freelance üzerinden sipariş edin
Freelance'e git
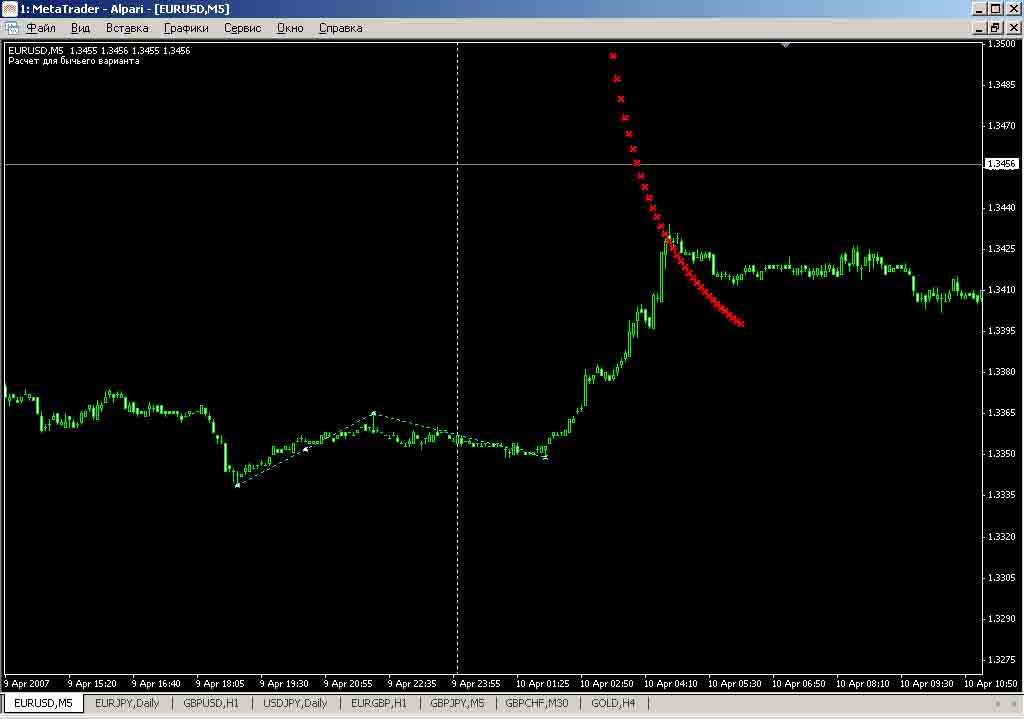
Presented is the script for the calculation of the third Elliott wave based on the algorithm suggested by Bill Williams in his book "Trading Chaos".
(Comment to the figure 7-15 in this book)
This script uses the standard OBJ_EXPANSION object (Fibonacci extension)
In order to start the calculation it is necessary to move first coordinate of the object created by the script to the supposed start of the first wave to the Low of a bar (for bullish version), the second coordinate to the High of the bar where the first wave is expected to end and the second is expected to start. The third coordinate should be moved to the Low of the expected end of the second wave.
(For the bearish version, the prices of the coordinates must be - High for the first, Low for the second, High for the third)
The script automatically detects bullish and bearish versions of the third Elliott wave.
The red crosses mark the price for the ratio (price/time) where the "supposed" third wave "should" end.
And more: for a more accurate calculation the script requires a "sufficient" number of bars in the first and second waves.
P.S. If you like this script, it might be possible to make another for the calculation of the fifth Elliott wave based on the formed third and fourth waves.
MetaQuotes Ltd tarafından Rusçadan çevrilmiştir.
Orijinal kod: https://www.mql5.com/ru/code/7156
 4 Period MA
Indicates the number of periods for the calculation of the average line.
3C JRSX H
Through the use of more sophisticated smoothing algorithms this RSI has less delay and smoother shape of the curve.
RSI_BANDS_MA
Indicator based on the data of multiple RSI, Bollinger, MAverage. Beautifully displays the areas for buying and selling. Recoups 30-90 points, depending on the currency.
Channel based on the Fibo levels
Moving average channel based on the Fibo levels