 MetaTrader 5
 Uzmanlar
 Göstergeler
 Komut dosyaları
 Kütüphaneler
 Depo
Alım-satım robotlarını ücretsiz olarak nasıl indirebileceğinizi izleyin
Bizi Twitter üzerinde bulun!
Fan sayfamıza katılın
Fan sayfamıza katılın
Kodu beğendiniz mi? MetaTrader 5 terminalinde deneyin
- Görüntülemeler:
- 116967
- Derecelendirme:
- Yayınlandı:
- Güncellendi:
-
 Alım-satım fırsatlarını kaçırıyorsunuz:
- Ücretsiz alım-satım uygulamaları
- İşlem kopyalama için 8.000'den fazla sinyal
- Finansal piyasaları keşfetmek için ekonomik haberler
Kayıt Giriş yapWeb sitesi politikasını ve kullanım şartlarını kabul edersiniz
Hesabınız yoksa, lütfen kaydolun -
 Bu koda dayalı bir robota veya göstergeye mi ihtiyacınız var? Freelance üzerinden sipariş edin
Freelance'e git
Divergence is a powerful tool for detecting price reversal points from support and resistance zones. It usually gives us a relatively early signals compared to those given by moving average indicators. It can be successfully applied to many technical indicators and end up with good results.
This indicator will plot divergence lines between the price and OsMA indicator. It will give buy/sell signal according to the type of divergence that was detected. The indicator also is capable of drawing divergence lines for the whole history prices located within a specific chart.
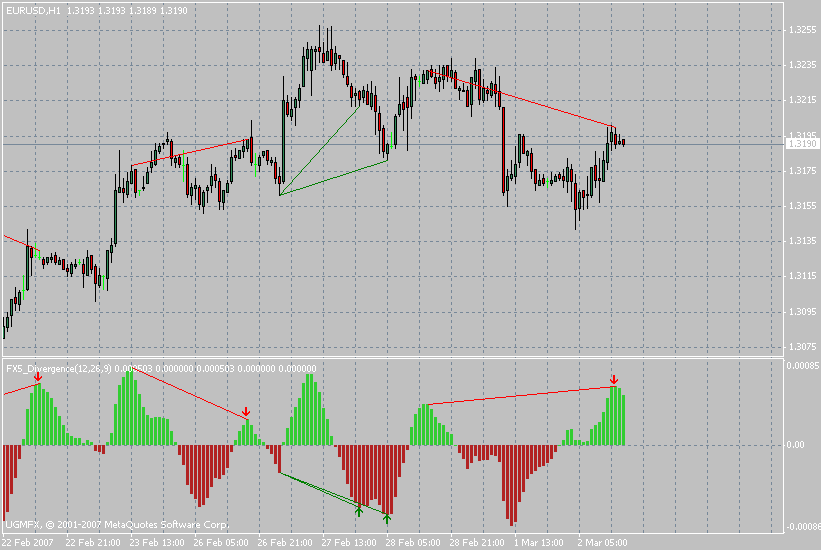
Bullish divergence will be plotted with green lines on both price and OsMA idicator windows.
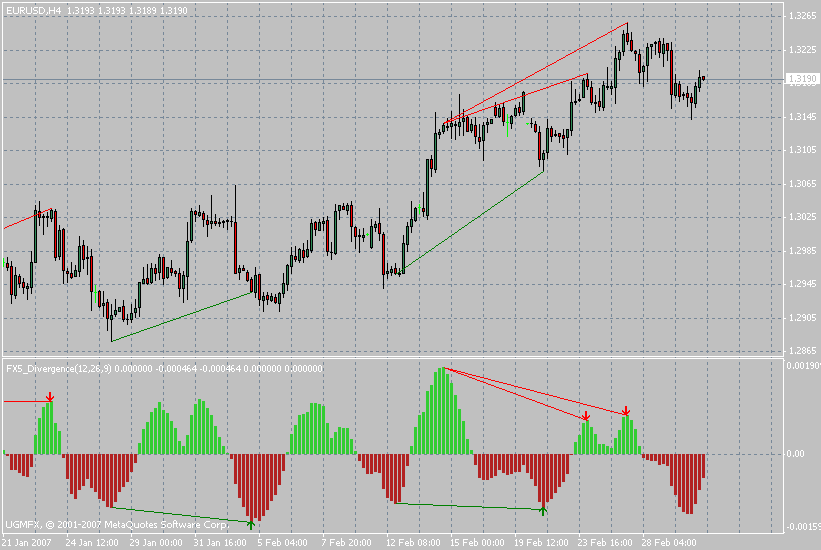
Bearish divergence will be plotted with red lines on both price and OsMA idicator windows.
I hope this indicator prove to be a useful tool.
Changes to Version 1.5:
- A bug was fixed in updating divergence lines as the live quotes flow;
- A sound Alert feature was added to the indicator and can be enabled or disabled from indicator settings;
- Classical divergence is plotted in Solid Style (continues) lines, while hidden divergence is plotted in Dot Style (interuppted) lines.
Changes to version 2.0:
- The code was rebuilt from scratch to make the indicator runs much faster.
- The indicator now doesn't repaint any of its signals.
- Some improvements in the signal identification algorithms.
Version 2.1:
- I attached the last file by mistake. This is the one I wanted to attach. It is the last version. I am designating it version 2.1.
 i-5days
5days indicator marks the first bar of each new day.
i-OneThird
i-OneThird indicator highlights bullish and bearish candles in HeikenAshi style.
i-AMA-Optimum
Kaufman's AMA with optimization for the long periods.
FX5_MACD_Divergence
This is another flavour of the original divergence indicator. It detects divergence between price and MACD indicator and gives Buy or Sell signals according to the divergence type.