Fan sayfamıza katılın

Slope_Direction_Line_Bar - MetaTrader 5 için gösterge
- Görüntülemeler:
- 9719
- Derecelendirme:
- Yayınlandı:
-
 Alım-satım fırsatlarını kaçırıyorsunuz:
- Ücretsiz alım-satım uygulamaları
- İşlem kopyalama için 8.000'den fazla sinyal
- Finansal piyasaları keşfetmek için ekonomik haberler
Kayıt Giriş yapWeb sitesi politikasını ve kullanım şartlarını kabul edersiniz
Hesabınız yoksa, lütfen kaydolun -
 Bu koda dayalı bir robota veya göstergeye mi ihtiyacınız var? Freelance üzerinden sipariş edin
Freelance'e git
Bu koda dayalı bir robota veya göstergeye mi ihtiyacınız var? Freelance üzerinden sipariş edin
Freelance'e git
Trend-following Slope Direction Line / Moving Average confirmation bars signal indicator is an equivalent of Slope Direction Line / Moving Average confirmation candles indicator. It compares direction of two moving averages: Moving Average and Slope Direction Line and displays colored signal pointers in a separate window. Their colors correspond to the match/mismatch of Slope Direction Line and Moving Average lines direction.
It has six input parameters:
- MA period - Moving Average calculation period
- MA method - Moving Average calculation method
- MA applied price - Moving Average calculation price
- SDL period - Slope Direction Line calculation period
- SDL method - Slope Direction Line calculation method
- SDL applied price - Slope Direction Line calculation price
- If Moving Average and Slope Direction Line are directed upwards:
- the green signal pointer is set
- If Moving Average and Slope Direction Line are directed downwards:
- the red signal pointer is set
- In any other case, the gray signal pointer is placed.
Slope Direction Line indicator is not required - it is calculated by the indicator independently.
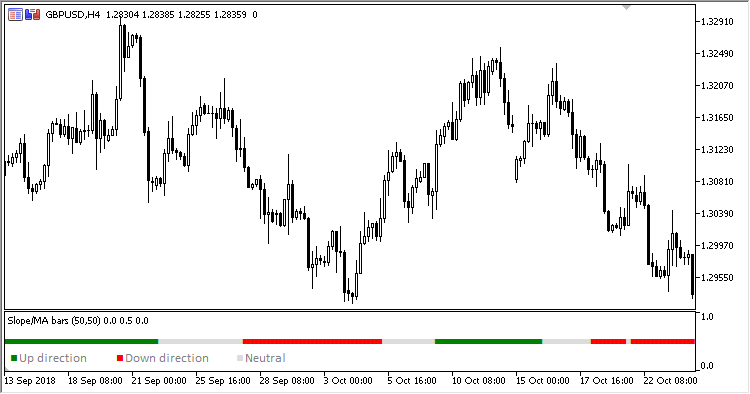
Fig. 1. Slope Direction Line / Moving Average confirmation bars
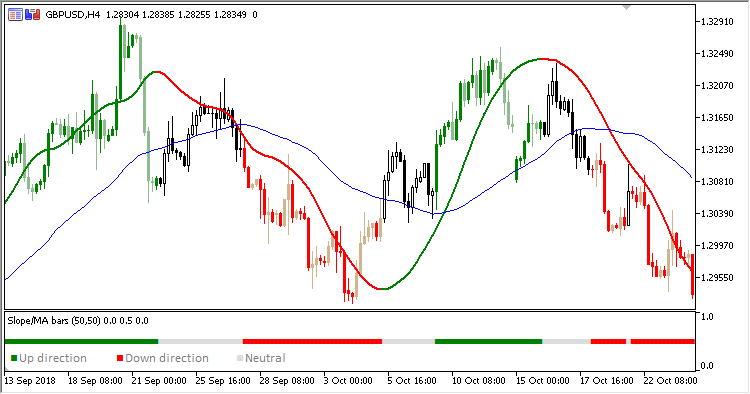
Fig. 2. Slope Direction Line / Moving Average confirmation bars + Slope Direction Line / Moving Average confirmation candles
MetaQuotes Ltd tarafından Rusçadan çevrilmiştir.
Orijinal kod: https://www.mql5.com/ru/code/22946
VGridLine_Custom
The indicator plots one vertical line per day in a specified moment of time
ColorRSI_X20
RSI_X20 indicator is able to color each line depending on its position relative to overbought and oversold areas
Slope_MA_Confirmation
Slope Direction Line / Moving Average confirmation candles indicator
Moving Average applied price
Now you can test the indicator and select the price type from the ENUM_APPLIED_PRICE enumeration