Alım-satım robotlarını ücretsiz olarak nasıl indirebileceğinizi izleyin
Bizi Facebook üzerinde bulun!
Fan sayfamıza katılın
Fan sayfamıza katılın
Komut dosyasını ilginç mi buldunuz?
Öyleyse bir link gönderin -
başkalarının da faydalanmasını sağlayın
Öyleyse bir link gönderin -
başkalarının da faydalanmasını sağlayın
Komut dosyasını beğendiniz mi? MetaTrader 5 terminalinde deneyin
- Görüntülemeler:
- 7350
- Derecelendirme:
- Yayınlandı:
-
Bu koda dayalı bir robota veya göstergeye mi ihtiyacınız var? Freelance üzerinden sipariş edin Freelance'e git
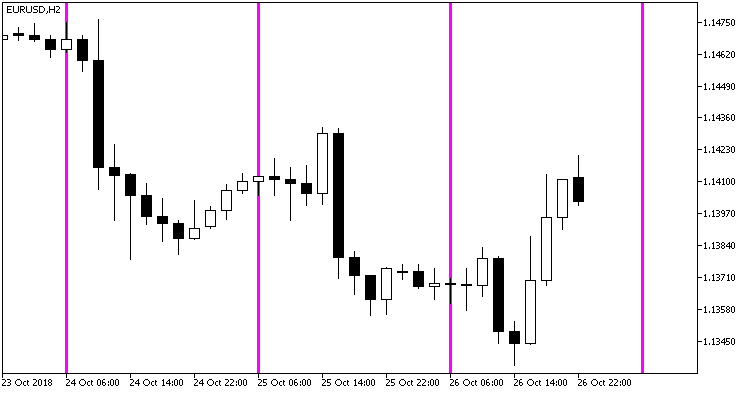
The indicator plots one vertical line per day in a specified moment of time.
//+----------------------------------------------+
//| Indicator input parameters                   |
//+----------------------------------------------+
input string LinesSirname="VLine_Grid_Custom_";     //line name
input HOURS  LineHours=ENUM_HOUR_0;                 //Line setting line (hour)
input MINUTS LineMinuts=ENUM_MINUT_0;               //Line setting line (minute)
input color Line_Color=clrMagenta;                  //line color
input ENUM_LINE_STYLE Line_Style=STYLE_DASHDOTDOT;  //line display style
input ENUM_WIDTH Line_Width=w_1;                    //line width
input bool SetBackground=true;                      //line background display
input uint LinesTotal=10;                           //number of lines in history
input uint FutureTotal=1;                           //number of lines in future empty history
If several instances of the indicator with different parameters should be used for the chart layout, the LinesSirname parameter should be different for each indicator.

Fig. 1. VGridLine_Custom indicator
MetaQuotes Ltd tarafından Rusçadan çevrilmiştir.
Orijinal kod: https://www.mql5.com/ru/code/22962
 ColorRSI_X20
RSI_X20 indicator is able to color each line depending on its position relative to overbought and oversold areas
 WyattsPivots
The indicator plots support/resistance levels and areas
 Slope_Direction_Line_Bar
Slope Direction Line / Moving Average confirmation bars indicator
 Slope_MA_Confirmation
Slope Direction Line / Moving Average confirmation candles indicator