Fan sayfamıza katılın

Fractal dimension - Ehlers - MetaTrader 5 için gösterge

- Görüntülemeler:
- 10569
- Derecelendirme:
- Yayınlandı:
-
 Alım-satım fırsatlarını kaçırıyorsunuz:
- Ücretsiz alım-satım uygulamaları
- İşlem kopyalama için 8.000'den fazla sinyal
- Finansal piyasaları keşfetmek için ekonomik haberler
Kayıt Giriş yapWeb sitesi politikasını ve kullanım şartlarını kabul edersiniz
Hesabınız yoksa, lütfen kaydolun -
 Bu koda dayalı bir robota veya göstergeye mi ihtiyacınız var? Freelance üzerinden sipariş edin
Freelance'e git
Bu koda dayalı bir robota veya göstergeye mi ihtiyacınız var? Freelance üzerinden sipariş edin
Freelance'e git
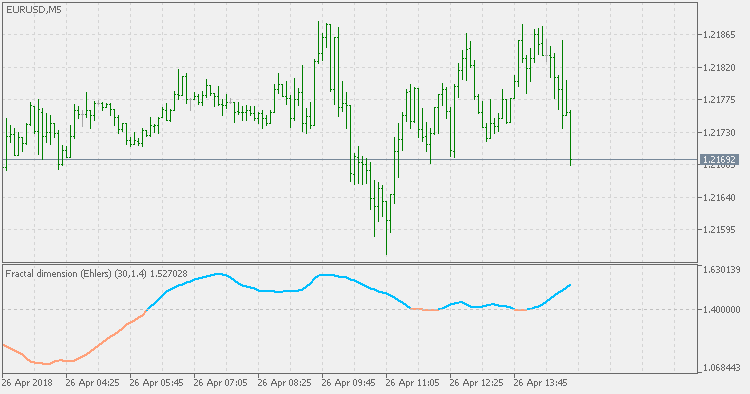
Based on the June 2010 issue of TASC article by John Ehlers and Rick Ways "Fractal Dimension As A Market Mode Sensor".
Short descriptions of their interpretation of fractal dimension would be the following:
Fractal dimension
There is no argument that market prices are fractal. Price charts look similar regardless of time frame. If you remove the labels from a five-minute chart, a daily chart, and a weekly chart, you would have difficulty telling them apart. Fractal shapes are self-similar because they have the same roughness and sparseness regardless of time interval. This self-similarity can be defined by the fractal dimension that describes sparseness at all magnification levels.
To determine the fractal dimension of a generalized pattern, we cover the pattern with a number N of small objects of several various sizes S. The relationship of the number of objects in two sets of sizes is:
By it's nature, fractal dimension index indicator is not directional. Instead it is showing if there is a trend or not. If the value of the FDI is less than the target threshold, then there is no trend (the market is ranging). If the value is above that threshold then the market is trending.
BB MACD Extended
BB MACD is a MACD (Moving Average Convergence Divergence) indicator variation with an addition of Bollinger Bands, which helps in detecting trend change points and measuring current trend's strength.
Weekly Fibo Levels
Calculation is based on current week open and previous week range.
Fractal dimension index (Sevcik/Matulich)
Mandelbrot describes the Fractal Dimension Index (FDI) as a way to measure "how convoluted and irregular" something is. The FDI can be used as a stock market indicator. The closer prices move in a one-dimensional straight line, the closer the FDI moves to 1.0. The more closely prices resemble a two-dimensional plane, the closer the FDI moves to 2.0.
Fractal Dimension - Jurik
Fractal Dimension from Mark Jurik is much smoother than the others but the general rule is the same: it is not a directional indicator, but is attempting to determine if there is a trend in the current market price changes or not, and it should be used bearing that in mind.