Fan sayfamıza katılın
Öyleyse bir link gönderin -
başkalarının da faydalanmasını sağlayın
- Görüntülemeler:
- 17225
- Derecelendirme:
- Yayınlandı:
- Güncellendi:
-
Bu koda dayalı bir robota veya göstergeye mi ihtiyacınız var? Freelance üzerinden sipariş edin Freelance'e git
The McGinley Dynamic indicator is designed to follow prices, avoiding whipsaws that are given when conventional Moving Averages are used.
Conventional Moving Averages have a fixed period and therefore a fixed speed. As a result, price separation occurs when the price moves rapidly which can lead to unwanted results. The McGinley Dynamic however is designed to adjust speed inline with the market.
This tool can be used as a substitute for a conventional Moving Average as a trend confirmation indicator or crossover signal.
There is one input for this indicator:
- MD_smoothing - In the same way you choose a period for a Moving Average, choose the period for this indicator. Make this 60% of the period you would otherwise use in a Moving Average. So if your MA period is 20, set this value to 12 for comparative indicator. The default value is 125.
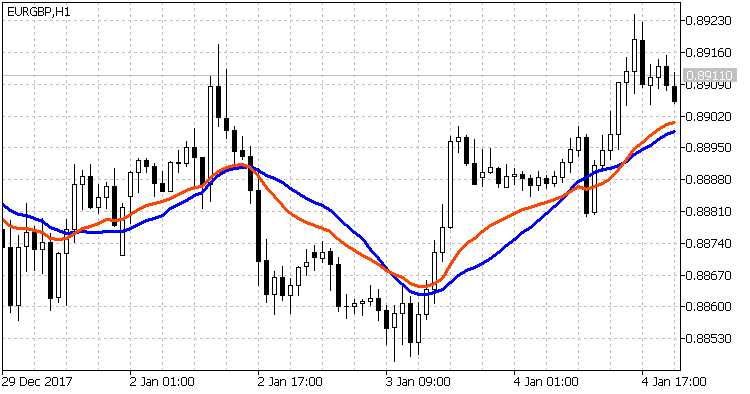
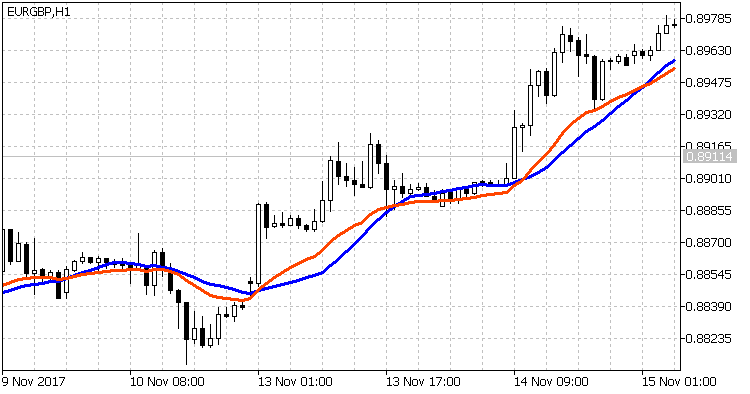
The pictures below show comparisons between the McGinley Dynamic (Red line) and a simple Moving Average (Blue line). The McGinley Dynamic reacts to price increases sooner whilst also tracking closer to prices and reducing whipsaws.


 3 MAs Market
Indicator that shows the current estimated state of the market based on a correlation of 3 Moving Averages.
 Chande's DMI (Dynamic Momentum Index)
The Dynamic Momentum Index (DMI) is a variable term RSI. When default values are used, the RSI term varies from 3 to 30. The variable time period makes the RSI more responsive to short-term moves. The more volatile the price is, the shorter the time period is. It is interpreted in the same way as the RSI, but provides signals earlier.
 Volume Average
Long known volume analysis method.
 Volume Average percent
This version is a sort of normalized version - since it shows Volume as a percent compared to the Average Volume over a chosen period.