Fan sayfamıza katılın
Öyleyse bir link gönderin -
başkalarının da faydalanmasını sağlayın
- Görüntülemeler:
- 5987
- Derecelendirme:
- Yayınlandı:
-
Bu koda dayalı bir robota veya göstergeye mi ihtiyacınız var? Freelance üzerinden sipariş edin Freelance'e git
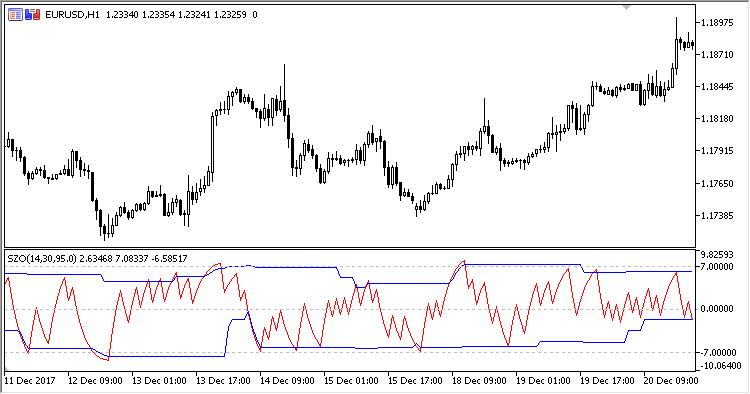
The SZO (Sentiment Zone Oscillator) indicator shows the market sentiment (activity and direction) and zones of excessive activity (overbought/oversold zones). It can display a dynamic channel, beyond which deals are seen as undesirable because of the high probability of a change in sentiment and of reversal.
If the indicator line moves beyond the channel and at the same time enters the overbought/oversold zone, this may mean that the market trend can change soon. The indicator often warns of such a possible change in advance, so it is advisable to use it in combination with another confirmation indicator.
It has six input parameters:
- Period - indicator calculation period;
- Dynamic levels period - the period for the calculation of the dynamic channel;
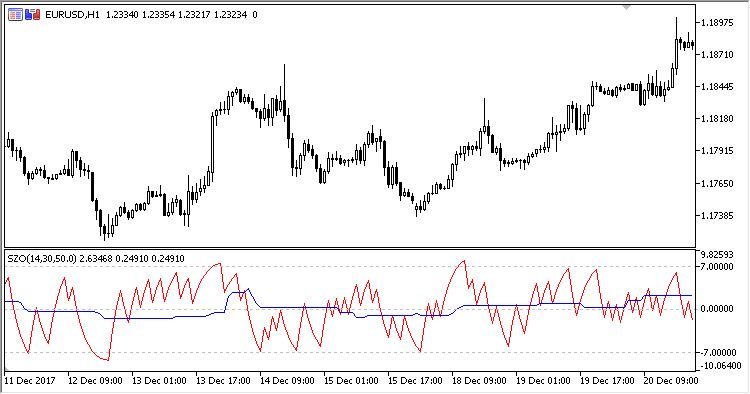
- Dynamic levels percent - the ratio of the channel size to the indicator range (*);
- Overbought - overbought level;
- Oversold - oversold level;
- Show dynamic levels - whether to show the levels of the dynamic channel (Yes/No).
* The ratio of the channel size to the indicator range is set in percent, but cannot be less than 50. I.e. the value of 50 means that the channel will only have one level located in the middle of the indicator range at the level of 0.0.
If you set a value less than 50, such a value will be automatically changed to 100.

Fig.1 Default channel range: 95%

Fig.2 Channel range 50%
MetaQuotes Ltd tarafından Rusçadan çevrilmiştir.
Orijinal kod: https://www.mql5.com/ru/code/20153
 CVI
CVI
CVI (Chartmill Value Indicator) shows the value of price deviation from the Moving Average.
 Hans123_Trader
Pending Buy Stop and Sell Stop orders. The EA trades in the specified time period. Determines the highest and lowest prices in the specified range of bars. Position trailing.