Volatility Squeeze Scanner
- Индикаторы
- Версия: 1.0
- Активации: 20

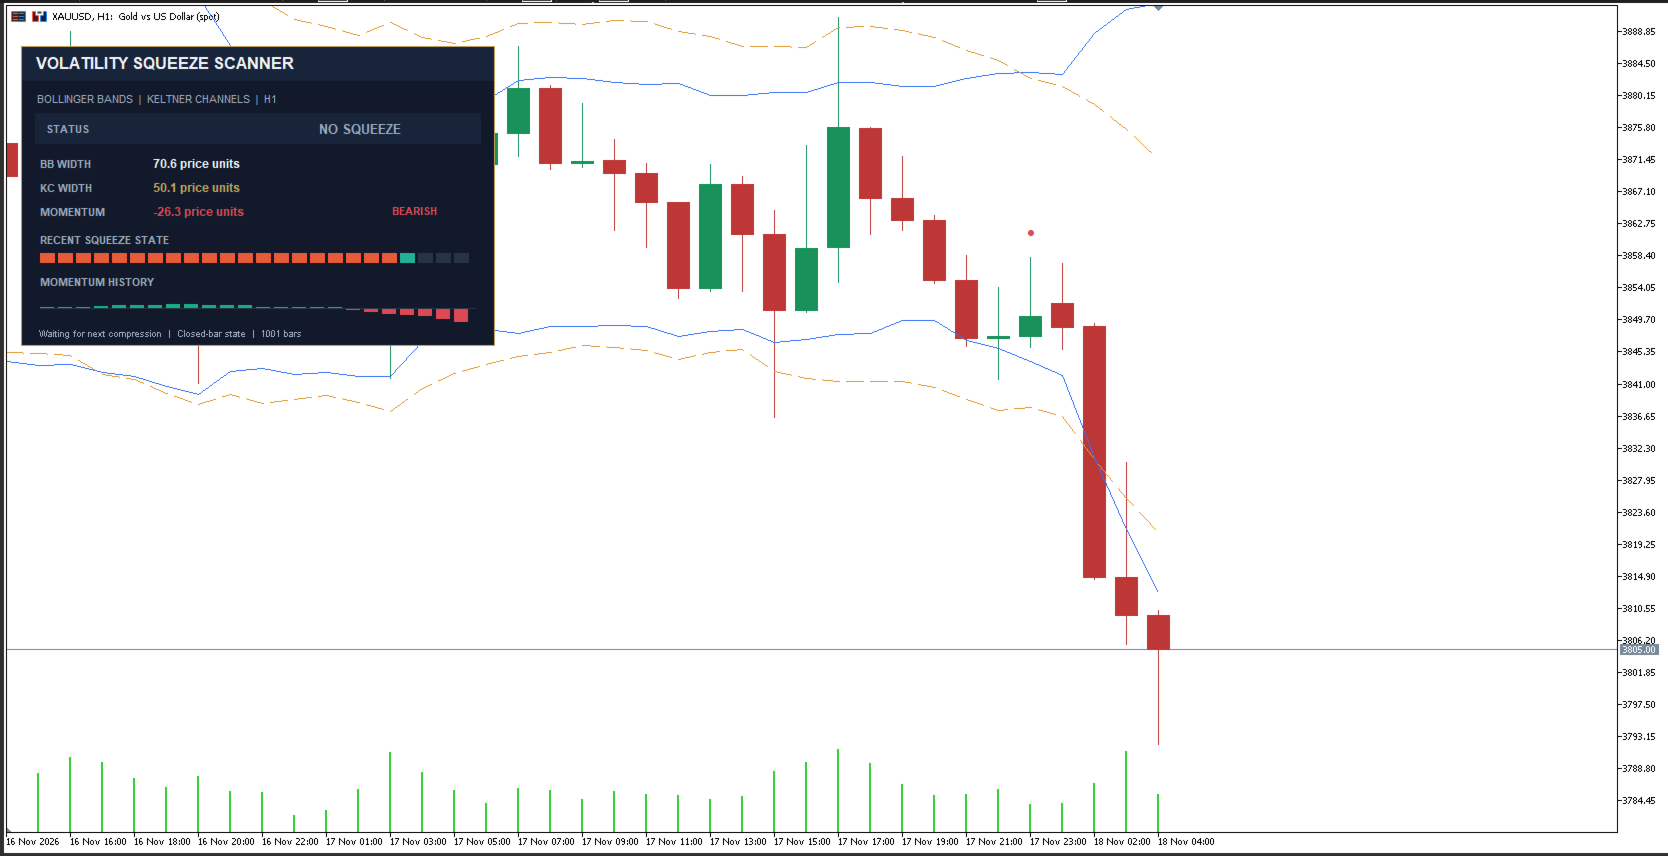
Volatility Squeeze Scanner monitors volatility compression on the chart’s current symbol and timeframe.
A squeeze is detected when the Bollinger Bands move fully inside the Keltner Channels. A release is confirmed on a closed candle when the bands move back outside the channels after a squeeze. Optional chart markers indicate the release direction based on the momentum estimate.
The dashboard displays the current squeeze state, Bollinger Band width, Keltner Channel width, momentum, recent squeeze history, and a compact momentum chart. Forex values are shown in pips; other instruments use price units.
The indicator uses a moving average and Average True Range to calculate the Keltner Channels. Its momentum estimate is based on price range and linear regression. It is an analytical tool; it does not place trades or guarantee future price direction.
You can adjust the Bollinger Band period, deviation, applied price, Keltner Channel period, ATR multiplier, momentum period, history length, displayed channels, and release markers. Chart appearance options can also be changed in the inputs. Original chart settings are restored when the indicator is removed.