Advanced Chart Watermark Pro

Lenzi Indicators - Advanced Chart Watermark Pro (MT5)

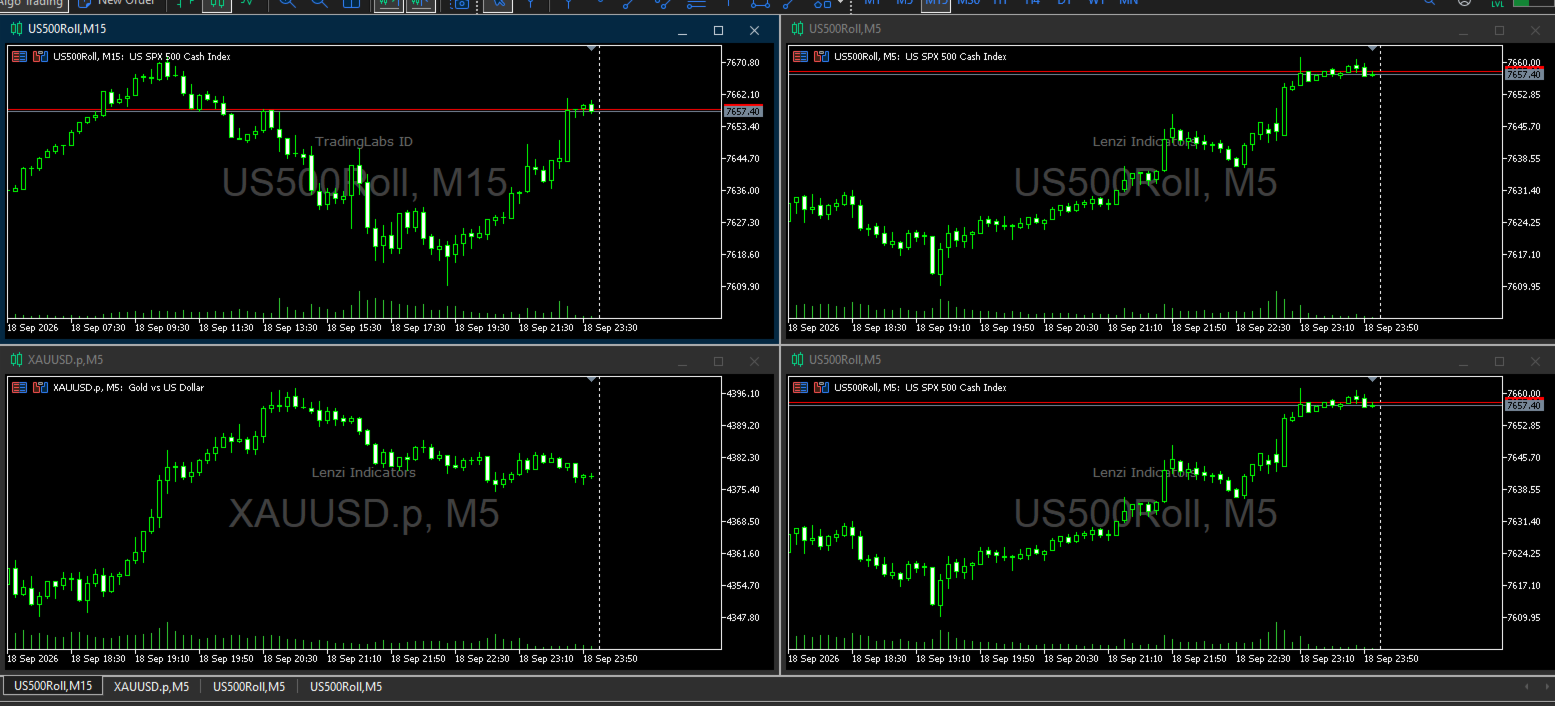
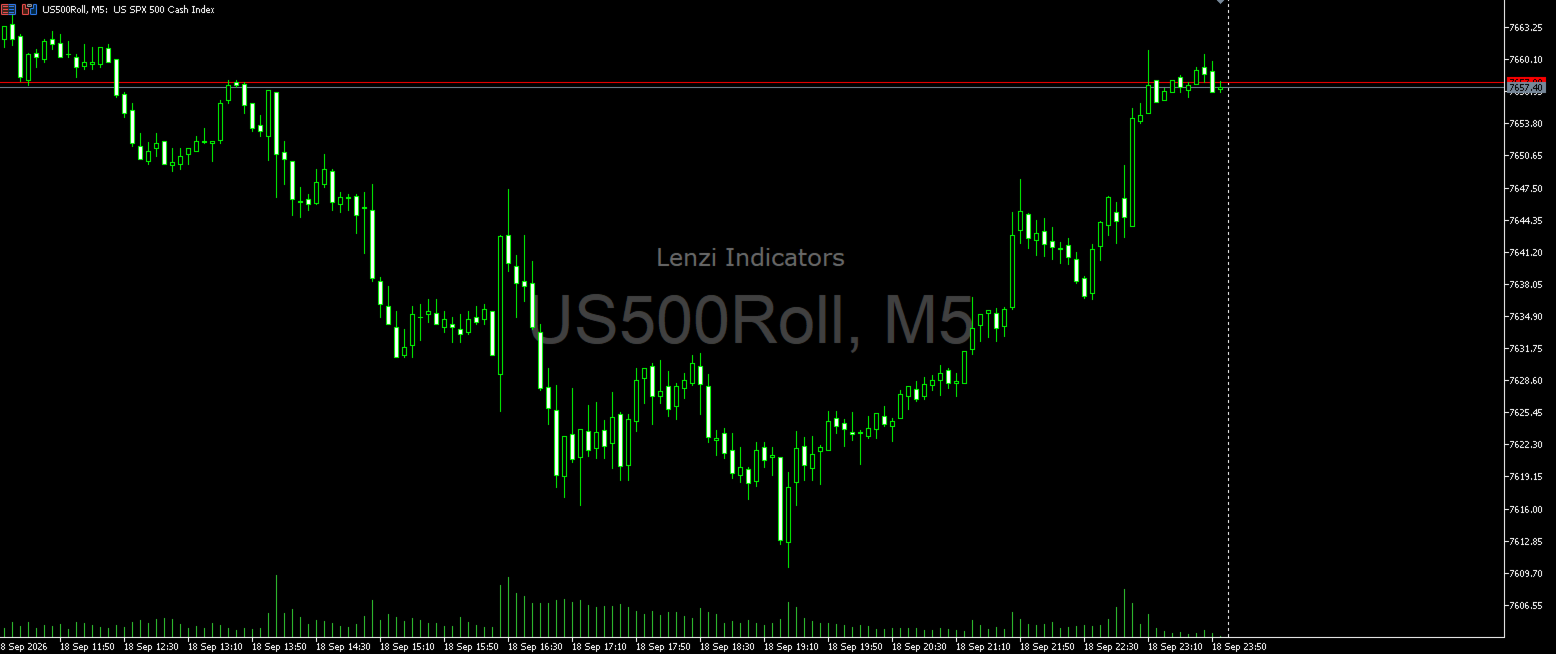
Water Mark Pro is a professional-grade watermark indicator for MetaTrader 5. Designed for traders, educators, signal providers, and content creators, it allows you to beautifully brand your charts without obstructing price action.

Featuring a smart mathematical engine, it calculates true opacity, automatically centers text, prevents overlapping, and dynamically resizes fonts when you shrink your chart window.

🌟 Key Features

  • Background Rendering: Text is drawn strictly behind candlesticks, ensuring price action remains your primary focus.

  • Smart Auto-Centering: Automatically measures pixel heights and stacks text perfectly in the chart's center without overlapping.

  • Responsive Resizing: Instantly scales your watermark down proportionally when you shrink or tile the MT5 terminal window.

  • Custom Opacity (0-100%): A unique color-blending engine creates flawless transparency on both Light and Dark mode charts.

  • Non-Intrusive & Unselectable: You will never accidentally click, drag, or delete the watermark while analyzing charts.

  • Dynamic Updating: Instantly reflects the current Symbol (Pair) and Timeframe on any chart you attach it to.

⚙️ Settings Breakdown

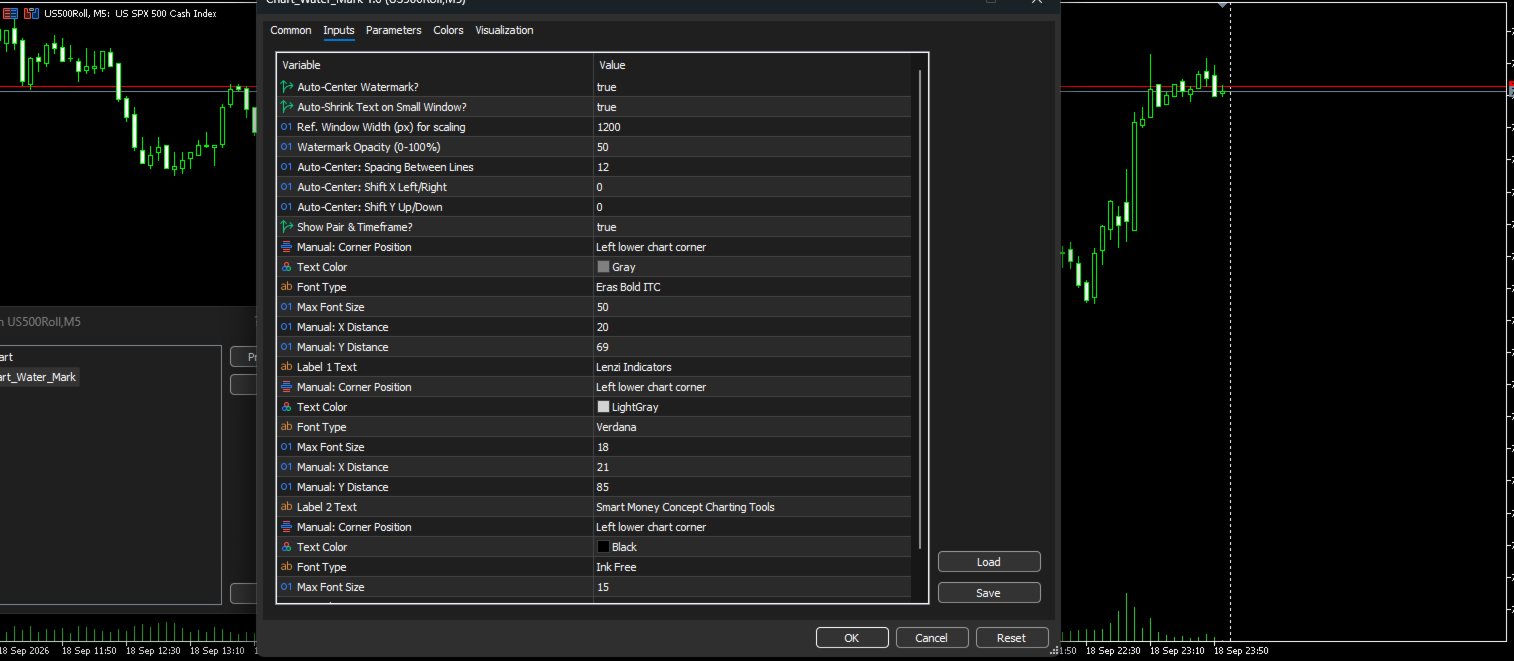
1. Auto-Center & Auto-Resize Settings

  • Auto-Center Watermark?: Mathematically calculates the exact center of your chart for perfect placement.

  • Auto-Shrink Text on Small Window?: Smoothly scales down fonts on smaller windows.

  • Ref. Window Width (px): Baseline chart width (Default: 1200) for resizing calculations.

  • Watermark Opacity (0-100%): Adjust text transparency (100 = solid, 50 = half-transparent, 0 = invisible).

  • Spacing Between Lines: Vertical gap (in pixels) between text labels.

  • Shift X / Y: Nudge the centered position slightly left/right or up/down.

2. Main Pair & Timeframe (e.g., "EURUSD, H1")

  • Show Pair & Timeframe?: Toggle the dynamic instrument text on or off.

  • Font Settings: Customize Font Type (Default: Eras Bold ITC), Color, and Max Size.

  • Manual Placement: Corner anchor and X/Y distances (used only if Auto-Center is turned off).

3. Text Label 1 (Main Brand)

  • Label 1 Text: Enter your brand name or website (Default: "Lenzi Indicators"). Leave blank to hide.

  • Font Settings: Customize Font Type (Default: Verdana), Color, and Max Size.

4. Text Label 2 (Slogan / Subtext)

  • Label 2 Text: Enter secondary info (Default: "Smart Money Concept Charting Tools"). Leave blank to hide.

  • Font Settings: Customize Font Type (Default: Ink Free), Color, and Max Size.

💡 Ideal Use Cases

  • Content Creators & YouTubers: Protect your screenshots and live streams from being repurposed without credit.

  • Signal Providers: Ensure every chart shared in Telegram or Discord carries your distinct branding.

  • Professional Traders: Track your current asset and timeframe in a beautiful, non-distracting background layout.
Другие продукты этого автора
The 3 Level ZZ Semafor is a legendary technical analysis tool now optimized for MetaTrader 5. It is a sophisticated fractal system that overlays three separate ZigZag indicators with different periods onto a single chart. This indicator helps traders visualize market structure by identifying Highs and Lows across three different magnitudes: short-term, medium-term, and long-term trends. It is widely used for Elliott Wave counting , identifying Support & Resistance , and spotting potential marke
Simple Vwap with the daily, weekly and monthly VWAP is the abbreviation for   volume-weighted average price , which is a technical analysis tool that shows the ratio of an asset's price to its total trade volume. It provides traders and investors with a measure of the average price at which a stock is traded over a given period of time. How it's used Identify entry and exit points:   Traders can use VWAP to determine when to buy or sell an asset.   Understand price trends :  Traders can use V
FREE
CandleCountdown Indicator — Overview This indicator displays a live countdown timer for the current candle on your chart, updating every second. It’s designed to be visually intuitive, resilient across timeframes, and smartly formatted for clarity. Core Features • Real-Time Countdown Shows how much time remains until the current candle closes, updating once per second. • Smart Time Formatting Adapts the display based on remaining time: • → shows just seconds (e.g., ) • → shows  (e.g., ) •
FREE
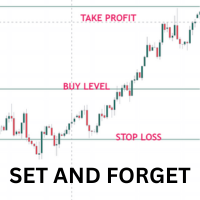
Once you have done your chart analysis there is no need to wait for the market to get to your levels. Just Set and Forget. The Ea will do this for you. How it works: - for buys. set the entry price, the stoploss and take profit. When price gets to entry price, It will wait till candle close above entry price, then when new candle opens and crosses above previous calndle high, the trade is triggered, The reverse is true for sells. Other Ea setting incluse: - 1. trading days 2. trading time range
Key Features  Start Date Control Choose a specific date from which labels begin to appear. Prevents clutter from old history data. Ideal for focusing on recent or relevant trading periods. Latest N Days Limiter Input option to display labels only for the most recent N days. Keeps your chart uncluttered during long backtests. Example: Set LatestDays = 10 to only show the last 10 trading sessions. Font Customization Set your preferred font name (default: Arial). Adjust font size for readability. C
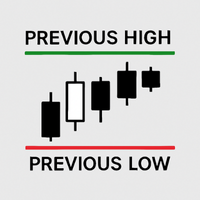
Previous Candle High/Low with Custom Time and Timeframe This indicator automatically plots two horizontal lines on your chart, showing the high and low of the most recent completed candle from a user-selected timeframe. It is designed for traders who want to clearly mark important intraday or higher-timeframe levels without manually drawing them. At the start of each trading day, the indicator waits until your chosen activation time (HH:MM server time). Once that time is reached, it deletes Prev
The LeMan Chanel is a lightweight, highly responsive price channel indicator designed to help traders identify dynamic support and resistance levels, track market volatility, and catch powerful price breakouts. Originally a popular tool in MT4, this indicator has been fully rewritten and optimized for the MetaTrader 5 ecosystem. Unlike traditional envelope indicators that simply use moving average deviations, LeMan Chanel calculates the actual maximum bullish and bearish price excursions over a
FREE
Advanced SMC Fair Value Gap (FVG) Scanner with Displacement Engine ️ The Problem with Standard FVG Indicators In Smart Money Concepts (SMC) and Inner Circle Trader (ICT) methodologies, a Fair Value Gap (FVG) is a three-candle formation that highlights a sudden imbalance in price delivery. It is one of the most powerful concepts in trading. However, most retail FVG indicators have a fatal flaw: they plot every single gap. If you have ever used a standard FVG indicator, you know the pain. During
Фильтр:
Нет отзывов
Ответ на отзыв