Bollinger Market and Trend Assessment

BOLLINGER MARKET & TREND INTELLIGENCE

MT4 Bollinger Breakout Analysis • Volatility Regimes • Trend Structure • Breakout Validation • Post-Breakout Analysis

STOP GUESSING WHICH BREAKOUTS ARE REAL.

You've been here before.

Price closes outside the upper Bollinger Band.

You see the breakout. You hesitate for a second — then enter.

Three candles later, price is back inside the band.

The breakout failed.

Now you're wondering whether you entered too early, whether you should have waited for a retest, or whether the breakout was never strong in the first place.

Then the opposite happens.

You wait for confirmation.

You wait for the retest.

And price keeps moving without you.

So you add another filter.

RSI.

Then MACD.

Then ADX.

Then another indicator to interpret the indicators.

Before long, your chart is full of signals — but you still don't have a clear answer to the question that matters:

What kind of breakout is this?

That's the problem Bollinger Market & Trend Intelligence is designed to address.

A Bollinger Band breakout is an event.

The important information is often in the context surrounding that event.

This MT4 indicator examines the volatility environment, breakout-candle structure, trend alignment, market structure, confirmation, retests, sweep-like behavior, and what happens after the breakout.

You see the analysis in one integrated dashboard instead of having to assemble it from multiple indicators.

THE BREAKOUT IS ONLY THE STARTING POINT

A candle closing outside a Bollinger Band tells you that price has moved beyond the channel.

It doesn't, by itself, tell you:

  • whether volatility was compressed beforehand

  • whether volatility is expanding or contracting

  • how strong the breakout candle was

  • where the candle closed within its range

  • whether the broader trend supports the move

  • whether shorter-term pressure agrees with that trend

  • whether the breakout confirmed

  • whether price subsequently retested the broken area

  • whether price returned inside the channel

  • whether the move developed sweep-like characteristics

  • or how efficiently price progressed afterward

Bollinger Market & Trend Intelligence brings these dimensions together.

Instead of treating every band violation as the same type of event, it gives you a structured way to examine what happened before, during, and after the breakout.

THE KEY ARCHITECTURAL DIFFERENCE

THE BREAKOUT CANNOT MOVE ITS OWN THRESHOLD

One of the most important design decisions in the engine is how the breakout threshold is evaluated.

For a historical breakout evaluation, the engine reads the completed Bollinger Band values from the bar immediately before the evaluated bar.

The breakout is then tested against that previously established channel level.

This creates a fixed reference point.

The evaluated candle cannot simply alter the Bollinger Band and then be judged against the modified value it helped create.

The result is a cleaner separation between:

the channel that existed before the breakout

and

the price movement being evaluated against that channel.

Signals are based on completed-bar data, with historical breakout states maintained through the engine's persistent tracking logic.

THE DASHBOARD

The dashboard is organized into six analytical areas so you can move from broad market context to the specific breakout.

1. MARKET STATE

Understand the volatility environment surrounding price.

The panel includes:

  • Volatility State

  • Bollinger Band Width

  • Width Percentile

  • Width / ATR Ratio

  • Width Velocity

  • Width Acceleration

  • Market-State Interpretation

The default width percentile compares current Bollinger width with a configurable historical lookback, allowing you to distinguish periods of relative compression from periods of expanded volatility.

2. GENERAL TREND

The broader market environment is evaluated using multiple structural components.

Depending on the available data, the panel incorporates:

  • Trend Direction

  • Trend Strength

  • Confidence

  • EMA Alignment

  • EMA Slope

  • ADX and Directional Movement

  • Higher High / Higher Low structure

  • Lower High / Lower Low structure

  • Trend Persistence

  • Market Phase

  • Environment

The result is expressed as a directional score from 0–100 together with the corresponding trend state.

This is not a standalone entry signal.

It is broader context for interpreting what the market is doing.

3. CURRENT TREND

The current trend panel looks at a shorter-term horizon than the General Trend analysis.

It helps you see whether:

  • short-term pressure agrees with the broader trend

  • momentum is weakening

  • the current move is diverging from the larger structure

  • price is transitioning between phases

This creates a useful distinction between:

Where the market has been trending

and

What it is doing right now.

4. BREAKOUT INTELLIGENCE

This is where the engine moves beyond a simple Bollinger breakout alert.

For the most recent qualifying breakout, the dashboard can display:

  • Breakout Direction

  • Bars Since Breakout

  • Breakout Status

  • Breakout Quality

  • Candle Classification

  • Body Percentage

  • Close Position Percentage

  • ATR Distance

  • Current Price Position

  • Signal Insight

The quality assessment combines measurable properties of the breakout candle and its relationship to the channel.

For example, a breakout candle can be examined according to:

BODY SIZE

How much of the candle's total range was occupied by its body?

CLOSE POSITION

Did price close near the extreme of the candle or give back a substantial portion of the move?

ATR DISTANCE

How far did price move beyond the Bollinger threshold relative to current volatility?

These measurements provide a more detailed description of the breakout than simply marking the candle with an arrow.

5. POST-BREAKOUT ANALYSIS

The breakout itself is only one part of the story.

The engine can continue evaluating what happens after the initial channel violation.

The panel can show:

  • Post-Breakout State

  • Momentum

  • Progression

  • Bars Analyzed

  • Bullish Movement

  • Bearish Movement

  • Net Change

  • Efficiency

  • Bull / Bear / Range Bar Distribution

POST-BREAKOUT EFFICIENCY

Efficiency compares directional movement with opposing or non-directional movement during the analysis period.

This provides a way to distinguish between:

price that continues progressing in one direction

and

price that moves back and forth with relatively little directional progress.

It is an analytical measurement of what happened after the breakout—not a prediction of what must happen next.

6. FINAL ASSESSMENT

All of the major analytical components are brought together in the final dashboard section.

The assessment can incorporate:

  • volatility environment

  • broader trend

  • current trend

  • breakout quality

  • breakout status

  • post-breakout behavior

  • directional structure

The dashboard presents the resulting market interpretation using descriptive states such as:

BULLISH

BEARISH

EMERGING BULLISH

BULLISH STRUCTURE

CORRECTION

and other configured market states.

The final assessment is intended as a compact summary of the underlying measurements.

It does not replace your trading rules or risk management.

THE 7-PHASE INTELLIGENCE ENGINE

The indicator is built as a sequence of analytical stages rather than a single Bollinger calculation.

PHASE 1 — BOLLINGER BREAKOUT ENGINE

Core Bollinger Band calculations:

  • Period

  • Standard Deviation

  • Upper Band

  • Middle Band

  • Lower Band

  • Breakout detection

  • Fixed pre-breakout threshold evaluation

Default:

Bollinger Period: 20

Standard Deviation: 2.0

PHASE 2 — VOLATILITY ENGINE

The engine measures the behavior of Bollinger Band width over time.

Components include:

  • Width

  • ATR normalization

  • Width percentile

  • Width velocity

  • Width acceleration

  • Smoothing

  • Volatility-state thresholds

  • Hysteresis

Default width lookback:

100 bars

Default ATR:

14 periods

Velocity and acceleration lookbacks are configurable.

A hysteresis mechanism can also be used to reduce unnecessary switching between adjacent volatility states when conditions are close to a threshold.

PHASE 3 — PERSISTENT BREAKOUT TRACKING

Breakouts are not treated as isolated events that disappear after one candle.

The engine can scan a configurable historical range and maintain information about the latest qualifying breakout.

Default historical scan:

3,000 bars

The tracking system maintains the breakout's position using absolute bar indexing and allows the event to move through different lifecycle states as additional candles develop.

This creates continuity between:

Breakout → Confirmation → Retest → Failure / Sweep → Post-Breakout Behavior

rather than evaluating every candle independently.

PHASE 4 — BREAKOUT INTELLIGENCE

The breakout candle is examined using measurable price characteristics.

Key measurements include:

  • Body %

  • Close position %

  • Candle classification

  • ATR distance

  • Directional structure

  • Breakout quality

Default examples include:

Minimum breakout distance: 0.05 ATR

Strong breakout distance: 0.50 ATR

Directional body threshold: 60%

Close-position threshold: 75%

These parameters are configurable.

PHASE 5 — TREND & MARKET STRUCTURE

Trend analysis combines several independent measurements.

The engine can evaluate:

  • EMA alignment

  • EMA slope

  • ATR-normalized slope

  • ADX

  • +DI / -DI

  • Higher High / Higher Low structure

  • Lower High / Lower Low structure

  • Trend persistence

  • Momentum

  • Market phase

The General Trend and Current Trend use separate lookback settings, allowing broader and shorter-term conditions to be compared.

Default lookbacks:

General Trend: 50 bars

Current Trend: 20 bars

PHASE 6 — BREAKOUT VALIDATION

After a breakout occurs, the engine continues to monitor its development.

CONFIRMATION

Determines whether price remains beyond the relevant channel threshold for the configured confirmation period.

RETEST

Monitors whether price returns toward the broken channel area within the configured ATR distance.

Default:

0.25 ATR

FALSE BREAKOUT

Identifies situations where price breaks beyond the channel and subsequently closes back inside it according to the configured rules.

SWEEP

Detects a breakout structure where price extends beyond the channel and then reverses, using a configurable wick-distance condition.

Default sweep threshold:

35%

These labels describe observed price behavior. They are not guarantees about what the market will do afterward.

PHASE 7 — DASHBOARD & ALERTS

The final phase brings the analysis together visually.

Features include:

  • Multi-panel dashboard

  • Market-state display

  • Trend analysis

  • Breakout tracking

  • Breakout status

  • Post-breakout analysis

  • Final assessment

  • Historical breakout labels

  • Optional popup alerts

  • Optional sound alerts

  • Configurable dashboard position and dimensions

Alerts can be enabled for new breakout events and relevant breakout-state changes.

FOLLOW THE BREAKOUT THROUGH ITS LIFECYCLE

One of the useful ways to work with the indicator is to stop thinking of a breakout as a single signal.

Instead, observe its progression.

1. COMPRESSION

Bollinger width contracts relative to its historical range.

2. BREAKOUT

Price moves beyond the pre-existing Bollinger threshold.

3. INITIAL ASSESSMENT

The engine evaluates candle structure, distance and surrounding trend conditions.

4. CONFIRMATION

Price either maintains the breakout or begins returning toward the channel.

5. RETEST

Price revisits the broken area.

6. FAILURE / SWEEP

Price may return inside the channel or develop a sweep-like structure.

7. POST-BREAKOUT

The engine evaluates how the market actually behaved following the event.

This lifecycle perspective is one of the main differences between the indicator and a conventional Bollinger Band breakout marker.

PRACTICAL ANALYSIS SCENARIOS

COMPRESSION → EXPANSION

You notice Bollinger width has remained relatively compressed.

Price then breaks beyond the channel.

Instead of looking only at the breakout candle, you can examine the volatility percentile, width expansion, candle quality and broader trend together.

BREAKOUT → RETURN INSIDE

Price closes outside the band and subsequently returns inside.

The breakout lifecycle can identify the resulting state as the event develops rather than leaving the original breakout marker as the entire analysis.

BREAKOUT → RETEST

Price moves beyond the channel and later returns toward the broken area.

The retest component provides a specific status for this stage of the breakout lifecycle.

BREAKOUT → CONTINUATION

Price remains beyond the channel while post-breakout movement continues to develop.

The Post-Breakout panel allows you to examine directional movement, efficiency and bar distribution.

SHORT-TERM / BROADER TREND DIVERGENCE

The General Trend may remain bullish while the Current Trend begins showing opposing pressure.

This gives you additional context when evaluating a breakout that occurs during a potential transition or correction.

HISTORICAL AND LIVE DATA BEHAVIOR

The indicator is designed around completed-bar analysis.

Historical breakout calculations use completed data, while breakout states can continue evolving as subsequent bars become available.

This distinction matters.

A historical breakout can later become:

CONFIRMED

RETESTED

FALSE BREAKOUT

SWEPT

or another configured lifecycle state because later price action provides additional information.

The original historical event is not simply rewritten as though it had been known differently at the time.

For live use, the currently forming candle should be treated separately from completed-bar confirmation.

ATR NORMALIZATION

Different instruments can have very different price scales and volatility characteristics.

The engine therefore uses ATR normalization in several areas, including:

  • breakout distance

  • Bollinger width relationships

  • EMA slope

  • retest distance

  • sweep analysis

  • other configurable thresholds

This allows many measurements to be expressed relative to the market's current volatility rather than relying exclusively on fixed price distances.

PERSISTENT HISTORICAL CONTEXT

A common problem with simple indicators is that the analysis effectively starts again every time you attach the indicator or every time a new event occurs.

Bollinger Market & Trend Intelligence maintains a historical breakout context over a configurable scan range.

Default:

3,000 bars

The dashboard can therefore remain aware of the most recent relevant breakout while subsequent price action develops.

DESIGNED FOR A CLEANER DECISION PROCESS

You do not need to interpret every component individually every time.

A practical workflow is:

1. CHECK MARKET STATE

Is the market compressed, normal, or expanding?

2. CHECK GENERAL TREND

What is the broader directional environment?

3. CHECK CURRENT TREND

Is shorter-term pressure aligned or diverging?

4. CHECK BREAKOUT INTELLIGENCE

How does the breakout candle and breakout distance measure?

5. CHECK BREAKOUT STATUS

Has it confirmed, retested, failed, or developed another lifecycle state?

6. CHECK POST-BREAKOUT

What has actually happened since the breakout?

7. MAKE YOUR OWN DECISION

Use the information alongside your trading method, risk management and other relevant market conditions.

The indicator is designed to make the analysis easier to organize—not to make the decision for you.

CONFIGURABLE PARAMETERS

The engine provides extensive control over its analytical components.

Bollinger

  • Period

  • Standard Deviation

Volatility

  • Width Lookback

  • ATR Period

  • Velocity Lookback

  • Acceleration Lookback

  • Smoothing

  • Volatility Thresholds

  • Hysteresis

Breakout Detection

  • Minimum ATR Distance

  • Strong Breakout Distance

  • Confirmation Bars

  • Breakout Retirement Rules

  • Historical Scan Range

  • Visible Historical Breakouts

Breakout Intelligence

  • Body Threshold

  • Close Position Threshold

  • Ranging Threshold

  • Directional Majority

  • Efficiency Threshold

Trend

  • General Trend Lookback

  • Current Trend Lookback

  • Slope Lookback

  • Neutral Slope Threshold

  • ADX Period

  • EMA Periods

  • ADX Strength Thresholds

Breakout Validation

  • Retest ATR Distance

  • Sweep Wick Threshold

  • Validation Parameters

Dashboard

  • Visibility

  • Corner

  • Width

  • Font Size

  • Horizontal / Vertical Offsets

  • Text Wrapping

  • Historical Labels

Alerts

  • Breakout Alerts

  • Status Alerts

  • Popup

  • Sound

MT4 TECHNICAL INFORMATION

Platform: MetaTrader 4

Indicator Type: Bollinger Band Market & Trend Analysis

Calculation: Native MT4 price and indicator data

Historical Analysis: Configurable historical scan

Default Scan: 3,000 bars

Bollinger Default: 20 / 2.0

ATR Default: 14

Trend Lookbacks: 50 / 20

External Dependencies: None

DLL: Not required

Web Requests: Not required

The indicator is designed to operate directly within the MT4 terminal without requiring external services.

WHO IS THIS FOR?

Bollinger Market & Trend Intelligence is intended for traders who already understand Bollinger Bands but want more context around breakout events.

It may be useful if you:

  • trade Bollinger Band breakouts

  • monitor volatility compression and expansion

  • analyze trend structure

  • use retests as part of your methodology

  • study failed breakouts and sweeps

  • want historical breakout context

  • prefer analytical dashboards over collections of separate indicators

  • want ATR-normalized measurements

  • want to examine what happens after a breakout rather than only the initial signal

It is an analysis tool, not a complete trading system.

WHAT THIS INDICATOR DOES NOT CLAIM

The engine does not know the future.

A high breakout-quality reading does not guarantee continuation.

A low-quality reading does not guarantee failure.

A bullish trend state does not guarantee a bullish move.

The purpose of the scoring and classification system is to organize measurable market information so that different breakout conditions can be compared consistently.

Your strategy, execution rules and risk management remain your responsibility.

WHY THIS IS DIFFERENT FROM A BASIC BOLLINGER INDICATOR

A conventional Bollinger indicator primarily answers:

Where are the bands?

A basic breakout indicator may add:

Did price cross the band?

Bollinger Market & Trend Intelligence goes further:

What was the volatility environment?

How did the breakout candle behave?

What was the broader trend?

What is the current trend doing?

Did the breakout confirm?

Did price retest the broken area?

Did it return inside the channel?

Did the move develop sweep-like characteristics?

What happened afterward?

How efficiently did price progress?

That is the central idea behind the engine.

The breakout is the event.

The surrounding behavior is the intelligence.

PRODUCT INFORMATION

Bollinger Market & Trend Intelligence is built for MT4 traders who want a structured way to analyze Bollinger Band breakouts, volatility conditions, trend structure and post-breakout behavior from a single chart interface.

If you already use Bollinger Bands, the indicator adds a broader analytical layer around them without requiring a collection of separate chart tools.

Use the included documentation to understand the calculations, dashboard states and available parameters before incorporating the indicator into your trading workflow.

SEARCH TERMS

Bollinger Bands MT4
Bollinger Breakout Indicator MT4
Bollinger Breakout Intelligence
Bollinger Band Breakout
Bollinger Volatility Indicator
Volatility Compression Indicator
Volatility Expansion MT4
Bollinger Trend Indicator
MT4 Trend Analysis
MT4 Breakout Indicator
Breakout Quality
Breakout Validation
False Breakout Detection
Breakout Retest Detection
Bollinger Sweep Detection
Post-Breakout Analysis
Post-Breakout Efficiency
ATR Normalization
Market Structure Indicator
MT4 Market Intelligence
Bollinger Dashboard
No-Repaint Bollinger Analysis


Önerilen ürünler
Binary Strong Indication Indicator is Designed Based on 14 Different Strategies Based. You can Use Binary Strong Indication Indicator for Binary Option Trading or if you want you can Try it for Forex. Time-Frame : M1 Depend on your choice on which time frame you want to get Indication. Trade Time Duration: 60 Seconds or 5 Minutes Mostly we Used it for 60 seconds in iq option but you can use it for any binary broker. Input Parameters : HLB = 30 it means Highest & Lowest Point of 30 Bars. This Val
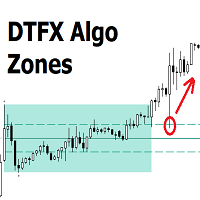
DTFX Algo Zones are auto-generated Fibonacci Retracements based on market structure shifts. These retracement levels are intended to be used as support and resistance levels to look for price to bounce off of to confirm direction.   USAGE Figure 1 Due to the retracement levels only being generated from identified market structure shifts, the retracements are confined to only draw from areas considered more important due to the technical Break of Structure (BOS) or Change of Character (CHo
Binary Hacker Göstergesi: Finansal Piyasalarda Dakika Başına Kesinlik Hızlı tempolu finansal piyasalarda her saniye önemlidir ve her karar bir alım satım işlemini yapabilir veya bozabilir. Binary Hacker Indicator, bir dakikada bir fiyat hareketlerini analiz etme şeklini dönüştürmeye ayarlanmış çığır açan bir araçtır. Ticarette Hassasiyetin Ortaya Çıkması: Binary Hacker Indicator sıradan bir ticaret aracı değildir. Gerçek zamanlı bir analizör olarak işlev görür ve grafiğindeki her dakikayı ayrın
Представляю вам индюка скальпера, а также хорошо отрабатывает на бинарных опционах, дополнительно добавлена функция уведомления, где своевременно вы сможете открыть ордера в любом месте, главное чтоб был интернет, но, чтобы данная функция  работала установите индюка на желаемые котировки и все это на сервер VPN. В данном индикаторе для дополнительной фильтрации сигнала используется индикатор RSI, период можно изменить в настройках, для поиска входов в открытие сделки,  установите индикатор на та
Binary Options Assistant (BOA) BURN Signals Indicator provides signals based on Ana Trader Binary Options Strategy. Indicators: MACD & Stochastic Stop missing trades, stop jumping from chart to chart looking for trade set-ups and get all the signals on 1 chart! U se any of the BOA Signals Indicator with the  Binary Options Assistant (BOA) Multi Currency Dashboard .  All BOA Signal Indicator settings are adjustable to give you more strategy combinations. The signals can be seen visually and hea
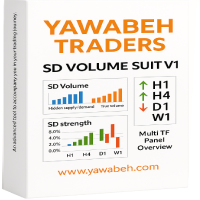
Yawabeh SD Pro –  Professional Supply and Demand Indicator Trade Smarter with Volume-Confirmed Supply/Demand Zones Our institutional-grade algorithm identifies high-probability reversal zones before price reacts, giving you the edge in Forex, Crypto, and Stocks. Key Features Multi-Timeframe Confirmation – View trend strength across multiple timeframes simultaneously – Align your trades with higher timeframe momentum Smart Alert System – Real-time notifications for: – Strong demand/supply zone
TrendBand Navigator Pro – Non-Repainting Multi-Timeframe Trading System Powered by proprietary multi-dimensional trend band algorithm delivering clear arrow signals Big Arrows Define Direction Small Arrows Capture Entries   Core Advantages   Intelligent Noise Filtering Volatility-adaptive technology avoids false breakouts, triggers arrows only during strong trends   Multi-Timeframe Compatibility Automatically adapts from 1-minute to monthly charts for all trading strategies   Vis
The Binary Profit Maker,  This indicator works on MT4 and is very easy to use. When you receive a signal from it, you wait for that candle with the signal to close and you enter your trade at the beginning of the next new candle . A Up Purple arrow means Buy and a Down Purple arrow means Sell. All arrows comes with Alert  like for easy identification of trade signal. Are you okay with that? How To Enter Trade? 1 minute candle 1 minute expire
This is a ready-made strategy for binary options! Support/resistance levels are used to form a signal, while a number of built-in indicators are applied to sort out incoming signals. An arrow appears during a signal formation. If the signal is active, then the arrow remains after the close of the bar; if the signal is not strong enough, the arrow disappears. With a small number of signals and a small trading time, you will not need to sit all day at the computer, especially since you can enable
This   Rattling Signal Point   indicator is designed for signal trading. This indicator generates trend signals. It uses many algorithms and indicators to generate this signal. It tries to generate signals from the points with the highest trend potential. This indicator is a complete trading product. This indicator does not need any additional indicators. The indicator is never repainted. The point at which the signal is given does not change. When the signal comes the arrows are put back on
MT4 için Crypto_Forex Göstergesi "Scalping_Channel". - Scalping Kanalı, ATR tabanlı oynaklık sınırlarına sahiptir. - Scalping ticareti için kullanmak harikadır: - Orta çizgide düzenleme bekleyen limit emri yoluyla işlemlere girin. - Yeşil sabit yukarı kanal gerçekleştiğinde ve en az 1 mum üst sınırın üzerinde kapandığında Boğa girişlerini düşünün (resimlere bakın). - Kırmızı sabit aşağı kanal gerçekleştiğinde ve en az 1 mum alt sınırın altında kapandığında Ayı girişlerini düşünün (resimlere bak
RectangleInd
Aliakbar Mohseni Pour
One of the most successful strategies in Forex, stick and metal market, is rectangle pattern. A hard pattern to find in multiple time frames, but, We made it so very easy for you. You can turn on this indicator in different currency pairs with different time frames and set the alarm on your computer or mobile phone. Working with this strategy is easy and enjoyable. Telegram:  https://t.me/triangleexpert Instagram: https://www.instagram.com/p/CNPbOLMh9Af/?igshid=15apgc7j1h5hm Note: This indicat
Some informations on the chart with the single attachment. RangeBorder Buy Sell (RBBS) Non Repaint Indicator will provide trend line, buy sell arrows,reversal arrows, range channel, order exit area,high average price line and low average price line.All arrows and lines don't repaint and not lagging. Once candle closed it won't  repaint. Reading Indicator: 1. Small Stars , Indicates oversold and overbought with certain logic and price may reverse when this small star triggers. Useful to identify
The indicator is designed for binary options. It produces a sound alert, after which you should instantly enter the market. The indicator operates based on signals form RSI and CCI, as well as support and resistance levels. When the chart is in overbought and oversold zones, the indicator finds a level in this zone and notifies you using a sound and a message. Indicator Parameters dist - the number of points to generate a signal. Suitable values ​​are from 21 to 50. Filtr_SMA - the filter, used
Pine script scalping indicator is a multi-layered analytical system designed for pinpoint interpretation of microstructure price fluctuations under high volatility conditions. At its core lies a complex model of dynamic price series filtration with inter-timeframe projections and nonlinear approximation of trend vectors. Unlike standard technical analysis tools, this indicator is not limited to a static oscillator approach but instead utilizes a hybrid interpretation of market data streams with
Always Strong indicator, an indicator that uses MacD and Bollinger bands. It is a coded indicator to find trends. It finds these trends by its own algorithm. This indicator requires visual monitoring. It does not give any warning because it needs visual follow-up. The main trendline should turn down to find the down trend. The main trend line should go under the white line and then go under the yellow line. The main trendline should turn upward to find the upward trend. The main trend line shoul
BinaryLuckMt4
Andrey Spiridonov
1 (1)
The BinaryLuck indicator is a powerful indicator for trading binary options with any expiration times. This indicator will be especially useful for trading short-term binary options with an expiration time of 30-60 seconds. This is a complete ready, self-contained trading system. The indicator predicts the maximum High and minimum Low for the current candle. Then it calculates the path the price has passed on the current candle as a percentage of the predicted High/Low range ( Range of candles )
KT Candlestick Patterns Scanner is a Multi-Symbol and Multi-Timeframe scanner that fetches and shows various candlestick patterns on 28 currency pairs and 9 time-frames concurrently . The scanner finds the candlestick patterns by loading the KT Candlestick Patterns indicator as a resource in the background. Features The scanner can find the candlestick patterns on 252* combinations of symbols and time-frames from a single chart. Open the signal's chart loaded with a predefined template with a s
The indicator is designed for trading binary options on small timeframes up to 15 m Easy to use does not need additional settings and can be used without additional filters Recommendations for trading When a signal appears (blue arrows pointing up), you need to consider the buy direction When a signal appears (the red line indicates the bottom), you need to consider the direction to sell To conclude a deal is on the candle where the signal for one candle came, if the signal turned out to be unpr
Multi Signal
Filip Maurice Daelman
Multi Signal Indicator contains a whole series of intersting buy,sell and exit signals that can be separately turned on/off. Signals : Liquidity Pools Liquidity Pools Forecast Projection Reversal Blocks Pinbar groups Overbought/Oversold with Moving Average Band (5 MA bands) Moving Average Difference Liquidity is an important aspect in the market, especially for institutional investors, as they need lots of liquidity to enter or exit the market. Therefore, institutional traders focus more on dema
Pro Magic Signal   indicator is designed for signal trading. This indicator generates trend signals.  It uses many algorithms and indicators to generate this signal. It tries to generate a signal from the points with the highest trend potential. This indicator is a complete trading product. This indicator does not need any additional indicators.  The indicator certainly does not repaint. The point at which the signal is given does not change.  Thanks to the alert features you can get the signals
Quantum Balance
Adolfina Denysenko
Quantum Balance is a modern arrow indicator that identifies key price reversal points in the market with high accuracy. It is based on a combination of WPR (Williams %R) and RSI (Relative Strength Index), which allows you to identify overbought/oversold moments and enter trades at points of maximum potential. The indicator analyzes price dynamics and market conditions, generating signals only when several confirming factors coincide. This reduces the number of false signals and increases tradin
EARLY REMINDER: The Starting price is 65 price will rise soon up to 365$ and then 750$ after first 10 copies of sales. Grab this offer now! Introduction Hello, traders! Welcome to the demonstration of the Forex Beast Indicator , a comprehensive tool designed to assist aspiring traders in navigating the complexities of the forex market. This indicator incorporates seven essential components to provide a well-rounded trading experience: Moving Averages Colored Zones Support and Resistance Levels
Trend Professional is an indicator that generates trend signal. It generates trend signal with its own algorithm. These arrows give buying and selling signals. The indicator certainly does not repaint. Can be used in all pairs. Sends a signal to the user with the alert feature. Trade rules Enter the signal when the buy and sell signal arrives. Processing should only be initiated when signal warnings are received. It is absolutely necessary to close the operation when an opposite signal is recei
Target Striking - One of the best binary options trading tools! It is set up so powerfully that you can trade not only on currency pairs, but also on raw gold oil! You can also try on cryptocurrency! Ideal for trading on currency pairs, the percentage of reliable transactions is more than + 75% The trading tool is already set for the best profit! Only Target Striking can unlock the potential of the trading market for you! With it, the signals are even and accurate without redrawing, a sig
An indicator based on candlestick patterns To catch short-term and long-term trends If it gives a signal in the direction of the trend, it is long term And if it gives a signal in the opposite direction of the trend, it is short term Too many signals Can be used in all symbols Can be used in all time frames Attributes: Too many signals Can be used in all symbols Can be used in all time frames Simple settings Simple and fast usage With author lifetime support Settings: Candle back: The number
BinaryPin
Andrey Spiridonov
3.67 (3)
BinaryPin is an indicator developed and adapted specifically for trading short-term binary options. The indicator's algorithm, before issuing the signal, analyzes many factors, such as market volatility, searches for the PinBar pattern, calculates the probability of success when making a deal. The indicator is set in the usual way. The indicator itself consists of an information window where the name of the trading instrument is displayed, the probability of making a successful transaction, the
FREE
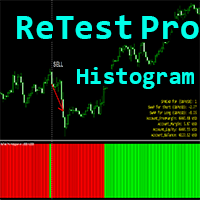
Crypto_Forex Göstergesi "ReTest Pro Histogram" MT4 için, Yeniden Boyama Yok. - ReTestPro_Histogram göstergesi, güçlü S/R seviyesinin yeniden test edilmesinden sonra ana trend yönüne giriş sinyallerinin aranması için kullanılabilir. - ReTestPro Histogramı 2 renkte olabilir: düşüş eğilimi için kırmızı ve yükseliş eğilimi için yeşil. - Aynı renkte sabit ardışık histogram sütunları gördüğünüzde bu, yeni bir trendin gerçekleştiği anlamına gelir. - ReTest sinyali, histogramda zıt renkte 1 sütun ve t
Ölçekleme okları yeniden çizilmez - grafikte fiyat dönüş noktalarını gösteren ve sinyallerini yeniden çizmeyen bir gösterge. Ayrıca gösterge, tüccara E-posta ve Push yoluyla sinyaller gönderir. Bu göstergenin sinyallerinin doğruluğu, M5 zaman diliminde yaklaşık %92-94 ve H1 zaman diliminde %95'ten fazladır. Böylece, bu gösterge, tüccarın işlemleri doğru bir şekilde açmasına ve daha fazla fiyat hareketini tahmin etmesine olanak tanır. Grafikteki fiyat dönüş noktaları, her tüccar için basit ve an
This is a trend following system for Binary options traders and forex scalpers. It is carefully crafted and recognizes periods of strong trends in the market and gives the trader the advantage and opportunity of riding with the momentum. It works on all timeframes and currency pairs especially high liquidity pairs. Avoid news events 15mins before and after. Always have your money management script or system in place. Tested on Deriv synthetics as well, please check screenshots. MT5 version can b
Bu ürünün alıcıları ayrıca şunları da satın alıyor
Trend SniperX MT4
Sarvarbek Abduvoxobov
5 (5)
Trend Sniper X , işlemcilerin trend yönünü ve olası dönüş noktalarını netlik ve hassasiyetle belirlemelerine yardımcı olan MetaTrader 5 için çoklu zaman dilimli bir trend takip göstergesidir. MT5 İçin: https://www.mql5.com/en/market/product/181101 Fiyat Bilgisi: Mevcut fiyat tanıtım amaçlıdır ve gelecek güncellemeler ile yeni özellikler eklendikçe değişebilir. Code2Profit Kanalı Çoklu Zaman Dilimi Analizi ile Piyasaya Hakim Olun! Trend Sniper X ile Kazanma Oranınızı Nasıl En Üst Düzeye Çıkarırsı
AW Prime Oscillator
AW Trading Software Limited
5 (1)
İki osilatörün birleşimi. Birincisi giriş noktalarını, ikincisi ise mevcut trendi gösterir. Gösterge, osilatör sinyallerini iki modda oklarla görüntüleyebilir; tüm hızlı osilatör sinyalleri veya yalnızca mevcut trend yönündeki sinyaller. Çok zaman dilimli bir panele ve üç tür sinyal bildirimine sahiptir. Faydalar: Günlük ve scalping ticaretine uygundur Trend filtreleme Basit ve hassas kurulum Çoklu zaman dilimi paneli Bir danışmana entegrasyona uygundur. Herhangi bir sembol ve herhangi bir zaman
Super Signal – Skyblade Edition Profesyonel No-Repaint / Gecikmesiz Trend Sinyal Sistemi, Olağanüstü Kazanma Oranı ile | MT4 / MT5 için 1 dakika, 5 dakika ve 15 dakika gibi daha düşük zaman dilimlerinde en iyi şekilde çalışır. Temel Özellikler: Super Signal – Skyblade Edition, özellikle trend bazlı işlemler için geliştirilmiş akıllı bir sinyal sistemidir. Yalnızca güçlü, yönlü ve gerçek momentum destekli piyasa hareketlerini tespit etmek amacıyla çok katmanlı bir filtreleme yapısı kullanır. Bu s
Atomic Analyst
Issam Kassas
5 (14)
Atomic Analyst — MetaTrader 4 Ürün soruları, kurulum rehberliği veya teknik destek için bana doğrudan MQL5 üzerinden mesaj gönderin. İndikatör, karmaşık piyasa hesaplamalarını basit görsel sinyallere, renk kodlu mumlara, trend okumalarına, stop-loss seviyelerine ve traderların hızlıca anlayıp gerçek piyasa koşullarında kullanabileceği çoklu take-profit bölgelerine dönüştürür. Ana trading kullanım alanları: Scalping ve gün içi işlem: Hızlı karar alma, net oklar, uyarılar, mum renkleri ve yapılan
Smart Trend Trading System, trend bilgilerini, giriş ve çıkış sinyallerini ve fiyat seviyelerini tek bir grafikte birleştiren bir MetaTrader 4 göstergesidir. Trend tespiti, dönüş bölgeleri, Smart Cloud, trailing stop mantığı, destek ve direnç, mum renklendirme, uyarılar ve çoklu zaman dilimi analizi dahil olmak üzere 10’dan fazla trading aracını tek bir sistemde birleştirir. Sistem, farklı piyasa koşullarında işlem yapmanıza yardımcı olmak için tasarlanmıştır: Trend piyasaları: Ana trendi belir
Liquidity Scalper System: gösterge formatında likiditeye dayalı bir işlem sistemi. Çoğu gösterge yalnızca bir ok gösterir; sonrasında stopun nereye konacağına, hedefin nerede olduğuna ve sinyale güvenilip güvenilmeyeceğine trader kendisi karar verir. Liquidity Scalper System işlemin tüm döngüsünü kapsar: likidite havuzlarını bulur, kırılımlarında sinyal verir, Entry, Stop Loss ve üç hedefi anında hesaplar, panelde ise istatistikleri ve yeni veriler üzerindeki doğrulama sonuçlarını gösterir. Sis
Şu anda %30 İNDİRİMLİ! Herhangi bir Acemi veya Uzman Tüccar için En İyi Çözüm! Bu gösterge paneli yazılımı 28 döviz çifti üzerinde çalışıyor. Ana göstergelerimizden 2'sine (Gelişmiş Para Birimi Gücü 28 ve Gelişmiş Para Birimi Dürtüsü) dayanmaktadır. Tüm Forex piyasasına harika bir genel bakış sağlar. Gelişmiş Para Birimi Gücü değerlerini, para birimi hareket hızını ve tüm (9) zaman dilimlerinde 28 Forex çifti için sinyalleri gösterir. Trendleri ve / veya scalping fırsatlarını belirlemek için
SR Liquidity
Oleg Rodin
5 (2)
SR Liquidity , piyasa likiditesinin yoğunlaştığı ve fiyatın en güçlü tepkiyi verdiği gizli bölgeleri ortaya çıkarmak için tasarlanmış bir alım-satım göstergesidir. Bu özel likidite alanları güçlü destek ve direnç seviyeleri işlevi görerek, piyasanın yön değiştirme ihtimalinin en yüksek olduğu yerlere dair size net bir harita sunar. SR Liquidity, sıradan Destek/Direnç çizgileri çizmek yerine, alım ve satım baskısının yoğunlaştığı bölgeleri tespit etmek için gerçek fiyat hareketlerini analiz eder.
M1 Sniper
Oleg Rodin
4.97 (30)
M1 SNIPER kullanımı kolay bir işlem göstergesi sistemidir. M1 zaman dilimi için tasarlanmış bir ok göstergesidir. Gösterge, M1 zaman diliminde scalping için bağımsız bir sistem olarak kullanılabilir ve mevcut işlem sisteminizin bir parçası olarak kullanılabilir. Bu işlem sistemi özellikle M1'de işlem yapmak için tasarlanmış olsa da, diğer zaman dilimleriyle de kullanılabilir. Başlangıçta bu yöntemi XAUUSD ve BTCUSD ticareti için tasarladım. Ancak bu yöntemi diğer piyasalarda işlem yaparken de ya
Top Bottom Tracker , piyasa trendini analiz eden ve trendin en yüksek ve en düşük seviyelerini tespit edebilen sofistike algoritmalara dayanan bir göstergedir / MT5 sürümü . Fiyat 500$'a ulaşana kadar kademeli olarak artacaktır. Sonraki fiyat --> $99 Özellikler Yeniden boyama yok Bu gösterge, yeni veriler geldiğinde değerlerini değiştirmez İşlem çiftleri Tüm forex çiftleri Zaman Dilimi Tüm zaman dilimleri Parametreler ==== Gösterge yapılandırması ==== Konfigürasyon parametresi // 40
KT Parabolic RSI MT4
KEENBASE SOFTWARE SOLUTIONS
KT Parabolic RSI overlays Parabolic SAR directly on the RSI line to highlight likely market turning points. Classic RSI overbought and oversold readings already hint at reversals, and the added PSAR filter removes much of the noise and sharpens those signals, giving you clearer trade setups. Big Square Signals: A Parabolic SAR flip on an RSI that sits in overbought or oversold territory. These mark high-probability market turns. Small Square Signals: A SAR flip inside the neutral RSI band. Treat
Advanced Supply Demand
Bernhard Schweigert
4.91 (302)
Özel Ticaret –%30 İndirim Yeni Başlayanlar veya Uzman Yatırımcılar İçin En İyi Çözüm! Bu gösterge, bir dizi özel özellik ve yeni bir formül içerdiği için benzersiz, yüksek kaliteli ve uygun fiyatlı bir işlem aracıdır. Bu güncelleme ile çift zaman dilimi bölgeleri gösterebileceksiniz. Sadece daha yüksek bir zaman dilimini değil, hem grafik zaman dilimini hem de daha yüksek zaman dilimini gösterebileceksiniz: İÇ İÇE GEÇMİŞ BÖLGELER GÖSTERİYOR. Tüm Arz Talep yatırımcıları buna bayılacak. :) Önem
This is a professional chart indicator designed for traders focused on stability and clear price action. It helps filter market noise and provides clear visual entry and exit zones for your trading decisions. Core Features: Strictly Non-Repainting: The system is built with strict non-repaint logic. What you see on the chart is the true historical performance. Confirmed Signals: Signals are triggered and confirmed only after the candle closes . Once a trading arrow appears on a closed candle, it
PRO Renko Sistemi, RENKO grafikleri ticareti için özel olarak tasarlanmış son derece hassas bir ticaret sistemidir. Bu, çeşitli ticaret araçlarına uygulanabilen evrensel bir sistemdir. Sistemi etkin piyasa sana doğru ters sinyallerine erişim hakkı denilen ses nötralize eder. Göstergenin kullanımı çok kolaydır ve sinyal üretiminden sorumlu tek bir parametreye sahiptir. Aracı, seçtiğiniz herhangi bir ticaret aracına ve renko çubuğunun boyutuna kolayca uyarlayabilirsiniz. Yazılımımla karlı bir
Currency Strength Wizard , başarılı ticaret için size hepsi bir arada çözüm sağlayan çok güçlü bir göstergedir. Gösterge, birden çok zaman dilimindeki tüm para birimlerinin verilerini kullanarak şu veya bu forex çiftinin gücünü hesaplar. Bu veriler, şu veya bu para biriminin gücünü görmek için kullanabileceğiniz, kullanımı kolay para birimi endeksi ve para birimi güç hatları biçiminde temsil edilir. İhtiyacınız olan tek şey, işlem yapmak istediğiniz tabloya göstergeyi eklemektir ve gösterge size
Cycles Predictor Indicator This indicator uses past market cycles to predict future price movements. The indicator scans through past data and considers  combinations  of cycles. When cycles  coincide  at the same future date/time then it is considered a valid future prediction. The predictions are drawn as vertical lines on the right side of the chart in the future. A prediction will often result in type of candle (ex. bull or bear) and/or a reversal point (ex. bottom or top) forming at this ex
CRT Multi-Timeframe Market Structure & Liquidity Sweep Indicator Non-Repainting | Multi-Asset | MT5 Version Available MT5 Version:   https://www.mql5.com/en/market/product/162075 Full User Guide — explains what each feature does and why:   https://www.mql5.com/en/blogs/post/767525 Quick Start User Guide  — explains how to configure and in what order:  https://www.mql5.com/en/blogs/post/767540 Indicator Overview CRT Ghost Candle HTF Fractal is a complete institutional-grade market structure too
Day Trader Master , günlük tüccarlar için eksiksiz bir ticaret sistemidir. Sistem iki göstergeden oluşmaktadır. Bir gösterge, satın almak ve satmak için bir ok işaretidir. Aldığınız ok göstergesidir. Size ikinci göstergeyi ücretsiz olarak sağlayacağım. İkinci gösterge, bu oklarla birlikte kullanılmak üzere özel olarak tasarlanmış bir trend göstergesidir. GÖSTERGELER TEKRARLAMAYIN VE GEÇ KALMAYIN! Bu sistemi kullanmak çok basittir. İki renkli bir çizgi olarak görüntülenen mevcut trend yönündeki o
Pips Generator
Oleg Rodin
4.6 (10)
Apollo Pips Generator , trend yönünde sinyaller veren göstergedir. Gösterge, birden fazla giriş noktası sağlar, böylece her zaman kâr etmek için bir ticaret fırsatı bulabilirsiniz. Ekran görüntülerine dikkat edin. Ekran görüntüleri, Pips Generator aracını, kanal tarafından üstleri ve altları gösteren yıldız sinyalleriyle temsil edilen diğer aracımla birlikte gösterir. Bu kombinasyon, sistemi nasıl uygulayabileceğiniz konusunda size birçok yol sunar. Satın aldıktan sonra İKİNCİ GÖSTERGEMİ ÜCRETSİ
ŞU ANDA %40INDIRIMLI Yeni Başlayanlar veya Uzman Tüccarlar için En İyi Çözüm! Bu Gösterge benzersiz, yüksek kaliteli ve uygun fiyatlı bir ticaret aracıdır çünkü bir dizi tescilli özellik ve yeni bir formül ekledik. Sadece BİR grafik ile 28 Forex çifti için Döviz Gücünü okuyabilirsiniz! Yeni bir trendin veya scalping fırsatının tam tetik noktasını belirleyebildiğiniz için ticaretinizin nasıl gelişeceğini hayal edin? Kullanım kılavuzu: buraya tıklayın Bu ilk olan, orijinal! Değersiz bir özent
Introducing Volume Orderflow Profile , a versatile tool designed to help traders visualize and understand the dynamics of buying and selling pressure within a specified lookback period. Perfect for those looking to gain deeper insights into volume-based market behavior! MT5 Version -  https://www.mql5.com/en/market/product/122657 The indicator gathers data on high and low prices, along with buy and sell volumes, over a user-defined period. It calculates the maximum and minimum prices during this
Bir ok size al der. Obsidian Scalper Pro nereden alacağınızı, stopun nereye gideceğini, üç hedefin nerede olduğunu, riskinize göre pozisyonun ne kadar büyük olması gerektiğini ve kurulumun 100 üzerinden kaç ettiğini söyler. Her sinyal, grafiğe çizilmiş bitmiş bir işlem planı olarak gelir ve yerleşik bir istatistik penceresi son yüz planın dürüst sonucunu, güven aralıklı kazanma oranı dahil, gösterir. Her karar kapanmış bir barda verilir, yani baktığınız geçmiş, işlem yapmış olacağınız geçmişin t
GoldRush Trend Ok Sinyali GoldRush Trend Ok Sinyali göstergesi, XAU/USD'de yüksek hızlı, kısa vadeli scalperlar için özel olarak tasarlanmış hassas, gerçek zamanlı trend analizi sağlar. 1 dakikalık zaman dilimi için özel olarak tasarlanan bu araç, net giriş noktaları için yön okları gösterir ve scalper'ların değişken piyasa koşullarında güvenle hareket etmelerini sağlar. Gösterge, PRIMARY ve SECONDARY uyarı oklarından oluşur. PRIMARY sinyalleri, trend yönündeki değişikliği gösteren Beyaz ve
UR TrendExhaustion
Krzysztof Jan Debski
UR TrendTükenme   UR TrendExhaustion, parametre değerleri veya diğer kurulumlarla uğraşmak istemeyen tüccarlar için en iyi çözümdür - herkes için hem kolay hem de görsel olarak anlaşılırdır. UR TrendExhaustion kullanmanın avantajları: parametre yok Grafikte neler olup bittiğini en iyi açıklayan 3 satırınız var: Trend Tükenme Hattı, Balina Para Hattı ve Perakende Para Hattı. Arayüz, her iki uçta da (kırmızı alanlar) herhangi bir satırın tükenmesini gösterir. En iyi avantaj: Kolay ve tüm varlı
Alright. This indicator works on MT4 and is very easy to use. When you receive a signal from it, you wait for that candle with the signal to close and you enter your trade at the beginning of the next new candle. A red arrow means sell and a green arrow means buy. All arrows comes with a long dotted like for easy identification of trade signal. Are you okay with that?   100% non repaint Work All Major currency  Pair,  1 minute time frame 1 minute expire
This indicator works on MT4 and is very easy to use. When you receive a signal from it, you wait for that candle with the signal to close and you enter your trade at the beginning of the next new candle . A red arrow means sell and a green arrow means buy. All arrows comes with Alert  like for easy identification of trade signal. Are you okay with that? 1 minute candle 1 minute expire
Neuro Poseidon MT4
Daria Rezueva
4.74 (46)
Neuro Poseidon is a new indicator by Daria Rezueva. It combines precise trading signals with adaptive TP/SL levels - creating best possible trades as a result! Message me and get  Neuro Poseidon Assistant  as a gift to automize your trading process! What makes it stand out? 1. Proven profitability on all assets and timeframes 2. Only confirmed BUY and SELL signals present on the chart 3. Adaptive TP & SL levels generated by the software for each trade 4. Easy to understand - suitable for all
Extreme Value Sniper is a detrended price indicator  Indicator finds the potential reversal levels by checking value ranges and price cycles. MT5 Version of the product :  https://www.mql5.com/en/market/product/114550 It shows the overbought and oversold levels using the average range. Overbought Levels are between 4 and 10 Oversold levels are bewtween -4 and -10 Those levels can be used as a reversal levels. Extreme Value Sniper look for some special divergence and convergence patterns to c
Scalper Vault
Oleg Rodin
5 (40)
Scalper Vault, gün içi işlemlerde istikrar yakalamak isteyen yatırımcılar için tasarlanmış, güçlü ve tam donanımlı bir alım satım sistemidir. Bu yüksek hassasiyetli gösterge; hem Forex hem de İkili Opsiyon yatırımcıları için kurumsal düzeyde analizler sunan, bağımsız ve eksiksiz bir alım satım sistemi işlevi görür. SATIN ALIM İŞLEMİNDEN SONRA BENİMLE İLETİŞİME GEÇİN; ALIM SATIM İPUÇLARIMI VE HARİKA BİR BONUSU ALIN! Tahmin yürütme zorunluluğunu ve karmaşık manuel analiz süreçlerini ortadan kaldır
Gann Made Easy
Oleg Rodin
4.84 (173)
Gann Made Easy , bay teorisini kullanarak ticaretin en iyi ilkelerine dayanan, profesyonel ve kullanımı kolay bir Forex ticaret sistemidir. WD Gann. Gösterge, Zararı Durdur ve Kâr Al Seviyeleri dahil olmak üzere doğru SATIN AL ve SAT sinyalleri sağlar. PUSH bildirimlerini kullanarak hareket halindeyken bile işlem yapabilirsiniz. Satın alma işleminden sonra, alım satım talimatlarını ve harika ek göstergeleri ücretsiz olarak almak için lütfen benimle iletişime geçin! Muhtemelen Gann ticaret yöntem
Yazarın diğer ürünleri
SWING DETECTOR WITH RSI AND FIBONACCI Structural Swing Points + Fibonacci Retracement + RSI Overlay -------------------------------------------------- FREE INDICATOR Identify swings. See Fibonacci levels. Check RSI. All in one free indicator. -------------------------------------------------- WHAT THIS INDICATOR DOES This indicator automatically detects structural swing highs and lows using configurable depth and deviation filtering. It connects swings with trend lines, overlays standard
FREE
Trend and Consolidation Matrix is an MT5 market structure and price action indicator combining a 6-layer adaptive trend ribbon, spatial consolidation zone mapping, and dynamic breakout-retest alerts for Forex, Gold (XAUUSD), and Indices. Engineered for scalping, day trading, and swing trading, this tool unifies multi-layer trend direction, volatility structure, and price density geometry calculated strictly on completed bars with zero historical repainting. Core Market Structure Architecture The
FREE
VWAP Ribbon Intelligence is an MT4 technical analysis indicator combining Volume-Weighted Average Price (VWAP), dynamic Wilder ATR volatility ribbons, and on-chart RSI momentum telemetry for Forex, Gold (XAUUSD), Indices, and Crypto. Engineered for day trading, scalping, and swing trading, this tool projects volatility expansion and momentum values directly onto the main price chart without requiring secondary subwindow oscillators. Core Analytical Architecture The indicator features a dual-mode
FREE
VWAP Ribbons
Charles Mwangi Ndungu
VWAP Ribbon Intelligence is an MT5 technical analysis indicator combining Volume-Weighted Average Price (VWAP), dynamic Wilder ATR volatility ribbons, and on-chart RSI momentum telemetry for Forex, Gold (XAUUSD), Indices, and Crypto. Engineered for day trading, scalping, and swing trading, this tool projects volatility expansion and momentum values directly onto the main price chart without requiring secondary subwindow oscillators. Core Analytical Architecture The indicator features a dual-mode
FREE
SWING HIGHS LOWS DETECTOR Swing Detection with Divergence Analysis -------------------------------------------------- Identify swings. Spot divergences. Trade with confluence. -------------------------------------------------- WHAT THIS INDICATOR DOES This indicator automatically detects structural swing highs and lows using configurable depth and deviation filtering. It then analyzes RSI and MACD to detect regular and hidden divergences between consecutive swings of the same type. Diver

FREE
SWING HIGHS LOWS DETECTOR Swing Detection with Divergence Analysis -------------------------------------------------- Identify swings. Spot divergences. Trade with confluence. -------------------------------------------------- WHAT THIS INDICATOR DOES This indicator automatically detects structural swing highs and lows using configurable depth and deviation filtering. It then analyzes RSI and MACD to detect regular and hidden divergences between consecutive swings of the same type. Diver
FREE
SWING VOLUME PROFILE Swing-Based Volume Profile + Fibonacci + RSI -------------------------------------------------- Auto-detected swings. Volume profile. Fibonacci. RSI. All-in-one. -------------------------------------------------- WHAT THIS INDICATOR DOES Swing Volume Profile (SVP) automatically detects structural swings and displays a volume profile for the most recent completed swing — with Fibonacci retracement and RSI overlay. No manual range selection needed. The indicator finds
Fixed Range Volume Profile is an MT5 volume analysis tool that calculates and displays volume distribution across any custom price and time range using standard chart trendlines for Forex, Gold (XAUUSD), Indices, and Crypto. Designed for day trading, scalping, and swing trading, this indicator automatically maps the Point of Control (POC), Value Area boundaries (VAH/VAL), and high-volume support and resistance levels without requiring manual object naming or complex setup. Core Volume Profile Ar
Fixed Range Volume Profile MT4 Volume Profile Indicator — Auto-Detecting Trendline Tracking, POC, Value Area & High Volume Nodes in Real Time Fixed Range Volume Profile (FRVP) displays volume distribution over a user-defined range — automatically detecting the latest trendline you draw or drag on the chart. No manual range selection. No naming conflicts. Just draw a trendline and the profile appears. Update it live by dragging. MT4 Native • No Repainting • Real-Time Trendline Tracking • Fully Cu
Adaptive Swing Density Heat Map MT4 Structural Density Indicator — Swing Clustering, Participation Tracking, Acceptance vs Rejection & Color-Coded Heat Map Adaptive Swing Density Heat Map analyzes swing point density across price levels, then tracks how price actually interacts with each zone — measuring participation, acceptance, and rejection. The result is a heat map of structural zones, color-coded by density strength. Not all support and resistance levels are equal — this indicator quantif
CONSOLIDATION INTELLIGENCE PRO MT4 Consolidation Indicator | Automatic Range Detection + 5-Tier Price-Density Heatmaps + Re-Entry Alerts Consolidation Intelligence Pro is a MetaTrader 4 indicator designed to identify areas where price repeatedly overlaps and trades within a concentrated range. The indicator analyzes candle overlap, body-to-wick structure, zone strength, and price-density distribution, then displays detected consolidation areas as 5-tier heatmaps directly on the chart. It also su
DONCHIAN MARKET & TREND INTELLIGENCE ENGINE (MT4) Multi-Factor Volatility, Trend Structure & Institutional Breakout Validation Dashboard MOST BREAKOUT INDICATORS ARE TRAPPING YOU. They Tell You THAT Price Broke Out. They Never Tell You IF It Will Hold. You have lived this scenario dozens of times: Price spends days coiling inside a tight Donchian band on your MT4 chart. A massive candle punches above the 20-period high. You buy the breakout — expecting momentum. Three candles later, price colla
VWAP Sniper Reversal
Charles Mwangi Ndungu
VWAP Sniper Reversal Pro v3.00 MT4 Mean-Reversion Indicator — Rolling VWAP, Dual-Layer ATR Bands, Volume Exhaustion, RSI Gate & Confirmation Modes VWAP Sniper Reversal Pro identifies potential mean-reversion setups at statistical price extremes. It combines a rolling volume-weighted average price (VWAP) baseline, dual-layer ATR deviation bands, volume and wick exhaustion filters, and an RSI gate to confirm reversal signals on completed bars. Built for traders who want multi-factor confluence ra
Adaptive Swing Density Heat Map MT5 Structural Density Indicator — Swing Clustering, Participation Tracking, Acceptance vs Rejection & Color-Coded Heat Map Adaptive Swing Density Heat Map analyzes swing point density across price levels, then tracks how price actually interacts with each zone — measuring participation, acceptance, and rejection. The result is a heat map of structural zones, color-coded by density strength. Not all support and resistance levels are equal — this indicator quantif
Swing Volume Profile MT5 Swing Volume Profile Indicator — Auto Swing Detection, Volume Profile, Fibonacci Retracement & RSI Overlay in One Chart Tool Swing Volume Profile (SVP) automatically detects structural swings and displays a volume profile for the most recent completed swing — with Fibonacci retracement and RSI overlay. No manual range selection. No trendline required. The indicator finds the swings and builds the profile automatically. MT5 Native • No Repainting • Auto Swing Detection •
Consolidation Intelligence Pro MT5 Consolidation Indicator — Automatic Range Detection, 5-Tier Price-Density Heatmaps & Re-Entry Alerts Consolidation Intelligence Pro automatically identifies where price repeatedly overlaps and trades within a concentrated range — then renders that structure as a 5-tier price-density heatmap directly on your chart. No more manually drawing every consolidation box. The indicator analyzes historical price structure, measures candle overlap and body-to-wick charac
DONCHIAN MARKET & TREND INTELLIGENCE The Only Donchian Tool That Tells You WHY the Market Is Moving — Not Just Where Most Donchian indicators draw three lines and call it a day. You get an upper band. A middle band. A lower band. And when price pokes above the upper band, you're supposed to just... buy? That's not analysis. That's guessing with extra steps. THE PROBLEM EVERY DONCHIAN TRADER KNOWS You've seen it a hundred times. Price finally breaks above the 20-period high after days of compress
BOLLINGER MARKET & TREND INTELLIGENCE — MT5 STOP GUESSING WHAT A BOLLINGER BREAKOUT IS TELLING YOU You've been here before. It's 2 AM. You're staring at a chart. Price has just closed outside the upper Bollinger Band. You enter. Three candles later, price is back inside the band. Then the move reverses. You tell yourself: "I should have waited for a retest." But when you wait for the retest, sometimes price continues without giving you the entry you wanted. So you add another filter. RSI. Then M
VWAP Sniper Reversal Pro is an MT5 reversal and pullback indicator combining Volume-Weighted Average Price (VWAP), dual-layer ATR volatility bands, volume exhaustion spikes, and RSI momentum filters for Forex, Gold (XAUUSD), Indices, and Crypto. Designed for scalping, day trading, and swing trading, this tool identifies market turning points when price becomes overstretched from fair value, calculating all confirmed signals strictly on completed bars with zero historical repainting. Core 4-Facto
Super Trend and Consolidation Matrix is an MT5 market structure and price action indicator combining a 6-layer trend ribbon, volatility squeeze engine, dynamic consolidation zones, and a real-time confluence dashboard for Forex, Gold (XAUUSD), and Indices. Engineered for scalping, day trading, and swing trading, this system provides objective structural analysis calculated strictly on completed bars with zero historical repainting. Core Market Structure Engine The indicator synchronizes multiple
Gold Prism
Charles Mwangi Ndungu
Gold Prism EA is an automated multi-timeframe breakout trading system engineered exclusively for XAUUSD that identifies key structural support and resistance levels, ranks their significance, and executes momentum trades using pending orders. Flash Sale Launch: To build initial trading history and gather verified user reviews, the purchase price is heavily discounted to $199 for the first 5 copies only. Once the first 5 licenses are claimed, the price will automatically increase to $499 before r
Filtrele:
Değerlendirme yok
Değerlendirmeye yanıt