Bollinger Market and Trend Assessment

BOLLINGER MARKET & TREND INTELLIGENCE

MT4 Bollinger Breakout Analysis • Volatility Regimes • Trend Structure • Breakout Validation • Post-Breakout Analysis

STOP GUESSING WHICH BREAKOUTS ARE REAL.

You've been here before.

Price closes outside the upper Bollinger Band.

You see the breakout. You hesitate for a second — then enter.

Three candles later, price is back inside the band.

The breakout failed.

Now you're wondering whether you entered too early, whether you should have waited for a retest, or whether the breakout was never strong in the first place.

Then the opposite happens.

You wait for confirmation.

You wait for the retest.

And price keeps moving without you.

So you add another filter.

RSI.

Then MACD.

Then ADX.

Then another indicator to interpret the indicators.

Before long, your chart is full of signals — but you still don't have a clear answer to the question that matters:

What kind of breakout is this?

That's the problem Bollinger Market & Trend Intelligence is designed to address.

A Bollinger Band breakout is an event.

The important information is often in the context surrounding that event.

This MT4 indicator examines the volatility environment, breakout-candle structure, trend alignment, market structure, confirmation, retests, sweep-like behavior, and what happens after the breakout.

You see the analysis in one integrated dashboard instead of having to assemble it from multiple indicators.

THE BREAKOUT IS ONLY THE STARTING POINT

A candle closing outside a Bollinger Band tells you that price has moved beyond the channel.

It doesn't, by itself, tell you:

  • whether volatility was compressed beforehand

  • whether volatility is expanding or contracting

  • how strong the breakout candle was

  • where the candle closed within its range

  • whether the broader trend supports the move

  • whether shorter-term pressure agrees with that trend

  • whether the breakout confirmed

  • whether price subsequently retested the broken area

  • whether price returned inside the channel

  • whether the move developed sweep-like characteristics

  • or how efficiently price progressed afterward

Bollinger Market & Trend Intelligence brings these dimensions together.

Instead of treating every band violation as the same type of event, it gives you a structured way to examine what happened before, during, and after the breakout.

THE KEY ARCHITECTURAL DIFFERENCE

THE BREAKOUT CANNOT MOVE ITS OWN THRESHOLD

One of the most important design decisions in the engine is how the breakout threshold is evaluated.

For a historical breakout evaluation, the engine reads the completed Bollinger Band values from the bar immediately before the evaluated bar.

The breakout is then tested against that previously established channel level.

This creates a fixed reference point.

The evaluated candle cannot simply alter the Bollinger Band and then be judged against the modified value it helped create.

The result is a cleaner separation between:

the channel that existed before the breakout

and

the price movement being evaluated against that channel.

Signals are based on completed-bar data, with historical breakout states maintained through the engine's persistent tracking logic.

THE DASHBOARD

The dashboard is organized into six analytical areas so you can move from broad market context to the specific breakout.

1. MARKET STATE

Understand the volatility environment surrounding price.

The panel includes:

  • Volatility State

  • Bollinger Band Width

  • Width Percentile

  • Width / ATR Ratio

  • Width Velocity

  • Width Acceleration

  • Market-State Interpretation

The default width percentile compares current Bollinger width with a configurable historical lookback, allowing you to distinguish periods of relative compression from periods of expanded volatility.

2. GENERAL TREND

The broader market environment is evaluated using multiple structural components.

Depending on the available data, the panel incorporates:

  • Trend Direction

  • Trend Strength

  • Confidence

  • EMA Alignment

  • EMA Slope

  • ADX and Directional Movement

  • Higher High / Higher Low structure

  • Lower High / Lower Low structure

  • Trend Persistence

  • Market Phase

  • Environment

The result is expressed as a directional score from 0–100 together with the corresponding trend state.

This is not a standalone entry signal.

It is broader context for interpreting what the market is doing.

3. CURRENT TREND

The current trend panel looks at a shorter-term horizon than the General Trend analysis.

It helps you see whether:

  • short-term pressure agrees with the broader trend

  • momentum is weakening

  • the current move is diverging from the larger structure

  • price is transitioning between phases

This creates a useful distinction between:

Where the market has been trending

and

What it is doing right now.

4. BREAKOUT INTELLIGENCE

This is where the engine moves beyond a simple Bollinger breakout alert.

For the most recent qualifying breakout, the dashboard can display:

  • Breakout Direction

  • Bars Since Breakout

  • Breakout Status

  • Breakout Quality

  • Candle Classification

  • Body Percentage

  • Close Position Percentage

  • ATR Distance

  • Current Price Position

  • Signal Insight

The quality assessment combines measurable properties of the breakout candle and its relationship to the channel.

For example, a breakout candle can be examined according to:

BODY SIZE

How much of the candle's total range was occupied by its body?

CLOSE POSITION

Did price close near the extreme of the candle or give back a substantial portion of the move?

ATR DISTANCE

How far did price move beyond the Bollinger threshold relative to current volatility?

These measurements provide a more detailed description of the breakout than simply marking the candle with an arrow.

5. POST-BREAKOUT ANALYSIS

The breakout itself is only one part of the story.

The engine can continue evaluating what happens after the initial channel violation.

The panel can show:

  • Post-Breakout State

  • Momentum

  • Progression

  • Bars Analyzed

  • Bullish Movement

  • Bearish Movement

  • Net Change

  • Efficiency

  • Bull / Bear / Range Bar Distribution

POST-BREAKOUT EFFICIENCY

Efficiency compares directional movement with opposing or non-directional movement during the analysis period.

This provides a way to distinguish between:

price that continues progressing in one direction

and

price that moves back and forth with relatively little directional progress.

It is an analytical measurement of what happened after the breakout—not a prediction of what must happen next.

6. FINAL ASSESSMENT

All of the major analytical components are brought together in the final dashboard section.

The assessment can incorporate:

  • volatility environment

  • broader trend

  • current trend

  • breakout quality

  • breakout status

  • post-breakout behavior

  • directional structure

The dashboard presents the resulting market interpretation using descriptive states such as:

BULLISH

BEARISH

EMERGING BULLISH

BULLISH STRUCTURE

CORRECTION

and other configured market states.

The final assessment is intended as a compact summary of the underlying measurements.

It does not replace your trading rules or risk management.

THE 7-PHASE INTELLIGENCE ENGINE

The indicator is built as a sequence of analytical stages rather than a single Bollinger calculation.

PHASE 1 — BOLLINGER BREAKOUT ENGINE

Core Bollinger Band calculations:

  • Period

  • Standard Deviation

  • Upper Band

  • Middle Band

  • Lower Band

  • Breakout detection

  • Fixed pre-breakout threshold evaluation

Default:

Bollinger Period: 20

Standard Deviation: 2.0

PHASE 2 — VOLATILITY ENGINE

The engine measures the behavior of Bollinger Band width over time.

Components include:

  • Width

  • ATR normalization

  • Width percentile

  • Width velocity

  • Width acceleration

  • Smoothing

  • Volatility-state thresholds

  • Hysteresis

Default width lookback:

100 bars

Default ATR:

14 periods

Velocity and acceleration lookbacks are configurable.

A hysteresis mechanism can also be used to reduce unnecessary switching between adjacent volatility states when conditions are close to a threshold.

PHASE 3 — PERSISTENT BREAKOUT TRACKING

Breakouts are not treated as isolated events that disappear after one candle.

The engine can scan a configurable historical range and maintain information about the latest qualifying breakout.

Default historical scan:

3,000 bars

The tracking system maintains the breakout's position using absolute bar indexing and allows the event to move through different lifecycle states as additional candles develop.

This creates continuity between:

Breakout → Confirmation → Retest → Failure / Sweep → Post-Breakout Behavior

rather than evaluating every candle independently.

PHASE 4 — BREAKOUT INTELLIGENCE

The breakout candle is examined using measurable price characteristics.

Key measurements include:

  • Body %

  • Close position %

  • Candle classification

  • ATR distance

  • Directional structure

  • Breakout quality

Default examples include:

Minimum breakout distance: 0.05 ATR

Strong breakout distance: 0.50 ATR

Directional body threshold: 60%

Close-position threshold: 75%

These parameters are configurable.

PHASE 5 — TREND & MARKET STRUCTURE

Trend analysis combines several independent measurements.

The engine can evaluate:

  • EMA alignment

  • EMA slope

  • ATR-normalized slope

  • ADX

  • +DI / -DI

  • Higher High / Higher Low structure

  • Lower High / Lower Low structure

  • Trend persistence

  • Momentum

  • Market phase

The General Trend and Current Trend use separate lookback settings, allowing broader and shorter-term conditions to be compared.

Default lookbacks:

General Trend: 50 bars

Current Trend: 20 bars

PHASE 6 — BREAKOUT VALIDATION

After a breakout occurs, the engine continues to monitor its development.

CONFIRMATION

Determines whether price remains beyond the relevant channel threshold for the configured confirmation period.

RETEST

Monitors whether price returns toward the broken channel area within the configured ATR distance.

Default:

0.25 ATR

FALSE BREAKOUT

Identifies situations where price breaks beyond the channel and subsequently closes back inside it according to the configured rules.

SWEEP

Detects a breakout structure where price extends beyond the channel and then reverses, using a configurable wick-distance condition.

Default sweep threshold:

35%

These labels describe observed price behavior. They are not guarantees about what the market will do afterward.

PHASE 7 — DASHBOARD & ALERTS

The final phase brings the analysis together visually.

Features include:

  • Multi-panel dashboard

  • Market-state display

  • Trend analysis

  • Breakout tracking

  • Breakout status

  • Post-breakout analysis

  • Final assessment

  • Historical breakout labels

  • Optional popup alerts

  • Optional sound alerts

  • Configurable dashboard position and dimensions

Alerts can be enabled for new breakout events and relevant breakout-state changes.

FOLLOW THE BREAKOUT THROUGH ITS LIFECYCLE

One of the useful ways to work with the indicator is to stop thinking of a breakout as a single signal.

Instead, observe its progression.

1. COMPRESSION

Bollinger width contracts relative to its historical range.

2. BREAKOUT

Price moves beyond the pre-existing Bollinger threshold.

3. INITIAL ASSESSMENT

The engine evaluates candle structure, distance and surrounding trend conditions.

4. CONFIRMATION

Price either maintains the breakout or begins returning toward the channel.

5. RETEST

Price revisits the broken area.

6. FAILURE / SWEEP

Price may return inside the channel or develop a sweep-like structure.

7. POST-BREAKOUT

The engine evaluates how the market actually behaved following the event.

This lifecycle perspective is one of the main differences between the indicator and a conventional Bollinger Band breakout marker.

PRACTICAL ANALYSIS SCENARIOS

COMPRESSION → EXPANSION

You notice Bollinger width has remained relatively compressed.

Price then breaks beyond the channel.

Instead of looking only at the breakout candle, you can examine the volatility percentile, width expansion, candle quality and broader trend together.

BREAKOUT → RETURN INSIDE

Price closes outside the band and subsequently returns inside.

The breakout lifecycle can identify the resulting state as the event develops rather than leaving the original breakout marker as the entire analysis.

BREAKOUT → RETEST

Price moves beyond the channel and later returns toward the broken area.

The retest component provides a specific status for this stage of the breakout lifecycle.

BREAKOUT → CONTINUATION

Price remains beyond the channel while post-breakout movement continues to develop.

The Post-Breakout panel allows you to examine directional movement, efficiency and bar distribution.

SHORT-TERM / BROADER TREND DIVERGENCE

The General Trend may remain bullish while the Current Trend begins showing opposing pressure.

This gives you additional context when evaluating a breakout that occurs during a potential transition or correction.

HISTORICAL AND LIVE DATA BEHAVIOR

The indicator is designed around completed-bar analysis.

Historical breakout calculations use completed data, while breakout states can continue evolving as subsequent bars become available.

This distinction matters.

A historical breakout can later become:

CONFIRMED

RETESTED

FALSE BREAKOUT

SWEPT

or another configured lifecycle state because later price action provides additional information.

The original historical event is not simply rewritten as though it had been known differently at the time.

For live use, the currently forming candle should be treated separately from completed-bar confirmation.

ATR NORMALIZATION

Different instruments can have very different price scales and volatility characteristics.

The engine therefore uses ATR normalization in several areas, including:

  • breakout distance

  • Bollinger width relationships

  • EMA slope

  • retest distance

  • sweep analysis

  • other configurable thresholds

This allows many measurements to be expressed relative to the market's current volatility rather than relying exclusively on fixed price distances.

PERSISTENT HISTORICAL CONTEXT

A common problem with simple indicators is that the analysis effectively starts again every time you attach the indicator or every time a new event occurs.

Bollinger Market & Trend Intelligence maintains a historical breakout context over a configurable scan range.

Default:

3,000 bars

The dashboard can therefore remain aware of the most recent relevant breakout while subsequent price action develops.

DESIGNED FOR A CLEANER DECISION PROCESS

You do not need to interpret every component individually every time.

A practical workflow is:

1. CHECK MARKET STATE

Is the market compressed, normal, or expanding?

2. CHECK GENERAL TREND

What is the broader directional environment?

3. CHECK CURRENT TREND

Is shorter-term pressure aligned or diverging?

4. CHECK BREAKOUT INTELLIGENCE

How does the breakout candle and breakout distance measure?

5. CHECK BREAKOUT STATUS

Has it confirmed, retested, failed, or developed another lifecycle state?

6. CHECK POST-BREAKOUT

What has actually happened since the breakout?

7. MAKE YOUR OWN DECISION

Use the information alongside your trading method, risk management and other relevant market conditions.

The indicator is designed to make the analysis easier to organize—not to make the decision for you.

CONFIGURABLE PARAMETERS

The engine provides extensive control over its analytical components.

Bollinger

  • Period

  • Standard Deviation

Volatility

  • Width Lookback

  • ATR Period

  • Velocity Lookback

  • Acceleration Lookback

  • Smoothing

  • Volatility Thresholds

  • Hysteresis

Breakout Detection

  • Minimum ATR Distance

  • Strong Breakout Distance

  • Confirmation Bars

  • Breakout Retirement Rules

  • Historical Scan Range

  • Visible Historical Breakouts

Breakout Intelligence

  • Body Threshold

  • Close Position Threshold

  • Ranging Threshold

  • Directional Majority

  • Efficiency Threshold

Trend

  • General Trend Lookback

  • Current Trend Lookback

  • Slope Lookback

  • Neutral Slope Threshold

  • ADX Period

  • EMA Periods

  • ADX Strength Thresholds

Breakout Validation

  • Retest ATR Distance

  • Sweep Wick Threshold

  • Validation Parameters

Dashboard

  • Visibility

  • Corner

  • Width

  • Font Size

  • Horizontal / Vertical Offsets

  • Text Wrapping

  • Historical Labels

Alerts

  • Breakout Alerts

  • Status Alerts

  • Popup

  • Sound

MT4 TECHNICAL INFORMATION

Platform: MetaTrader 4

Indicator Type: Bollinger Band Market & Trend Analysis

Calculation: Native MT4 price and indicator data

Historical Analysis: Configurable historical scan

Default Scan: 3,000 bars

Bollinger Default: 20 / 2.0

ATR Default: 14

Trend Lookbacks: 50 / 20

External Dependencies: None

DLL: Not required

Web Requests: Not required

The indicator is designed to operate directly within the MT4 terminal without requiring external services.

WHO IS THIS FOR?

Bollinger Market & Trend Intelligence is intended for traders who already understand Bollinger Bands but want more context around breakout events.

It may be useful if you:

  • trade Bollinger Band breakouts

  • monitor volatility compression and expansion

  • analyze trend structure

  • use retests as part of your methodology

  • study failed breakouts and sweeps

  • want historical breakout context

  • prefer analytical dashboards over collections of separate indicators

  • want ATR-normalized measurements

  • want to examine what happens after a breakout rather than only the initial signal

It is an analysis tool, not a complete trading system.

WHAT THIS INDICATOR DOES NOT CLAIM

The engine does not know the future.

A high breakout-quality reading does not guarantee continuation.

A low-quality reading does not guarantee failure.

A bullish trend state does not guarantee a bullish move.

The purpose of the scoring and classification system is to organize measurable market information so that different breakout conditions can be compared consistently.

Your strategy, execution rules and risk management remain your responsibility.

WHY THIS IS DIFFERENT FROM A BASIC BOLLINGER INDICATOR

A conventional Bollinger indicator primarily answers:

Where are the bands?

A basic breakout indicator may add:

Did price cross the band?

Bollinger Market & Trend Intelligence goes further:

What was the volatility environment?

How did the breakout candle behave?

What was the broader trend?

What is the current trend doing?

Did the breakout confirm?

Did price retest the broken area?

Did it return inside the channel?

Did the move develop sweep-like characteristics?

What happened afterward?

How efficiently did price progress?

That is the central idea behind the engine.

The breakout is the event.

The surrounding behavior is the intelligence.

PRODUCT INFORMATION

Bollinger Market & Trend Intelligence is built for MT4 traders who want a structured way to analyze Bollinger Band breakouts, volatility conditions, trend structure and post-breakout behavior from a single chart interface.

If you already use Bollinger Bands, the indicator adds a broader analytical layer around them without requiring a collection of separate chart tools.

Use the included documentation to understand the calculations, dashboard states and available parameters before incorporating the indicator into your trading workflow.

SEARCH TERMS

Bollinger Bands MT4
Bollinger Breakout Indicator MT4
Bollinger Breakout Intelligence
Bollinger Band Breakout
Bollinger Volatility Indicator
Volatility Compression Indicator
Volatility Expansion MT4
Bollinger Trend Indicator
MT4 Trend Analysis
MT4 Breakout Indicator
Breakout Quality
Breakout Validation
False Breakout Detection
Breakout Retest Detection
Bollinger Sweep Detection
Post-Breakout Analysis
Post-Breakout Efficiency
ATR Normalization
Market Structure Indicator
MT4 Market Intelligence
Bollinger Dashboard
No-Repaint Bollinger Analysis


推荐产品
Binary Strong Indication Indicator is Designed Based on 14 Different Strategies Based. You can Use Binary Strong Indication Indicator for Binary Option Trading or if you want you can Try it for Forex. Time-Frame : M1 Depend on your choice on which time frame you want to get Indication. Trade Time Duration: 60 Seconds or 5 Minutes Mostly we Used it for 60 seconds in iq option but you can use it for any binary broker. Input Parameters : HLB = 30 it means Highest & Lowest Point of 30 Bars. This Val
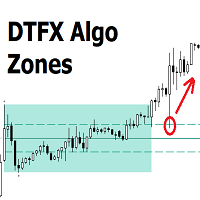
DTFX Algo Zones are auto-generated Fibonacci Retracements based on market structure shifts. These retracement levels are intended to be used as support and resistance levels to look for price to bounce off of to confirm direction.   USAGE Figure 1 Due to the retracement levels only being generated from identified market structure shifts, the retracements are confined to only draw from areas considered more important due to the technical Break of Structure (BOS) or Change of Character (CHo
在快节奏的金融市场中,每一秒都至关重要,每一个决定都可能成败。进入 Binary Hacker Indicator,这是一个开创性的工具,将以每分钟为单位的方式改变交易者分析价格走势的方式。 揭示交易中的精准度: Binary Hacker Indicator 并非您的普通交易工具。它作为实时分析器运行,逐分钟分析图表,为交易者提供宝贵的见解。与需要大量手动分析的传统指标不同,Binary Hacker 消除了交易策略中的猜测,提供了一种基于纯粹数据的计算方法。 每一分钟的力量: 想象一下能够分析交易的每一分钟,了解买卖压力之间的微妙平衡。有了 Binary Hacker,这一愿景就变成了现实。这个巧妙的指标会持续监控市场并计算每一分钟的上升和下跌笔数,将价格走势的本质提炼为易于理解的信息。 独特的策略,无与伦比的结果: Binary Hacker Indicator 与众不同的是其独特的交易策略,这些策略经过精心调整,可以适应价格走势的细微差别。当您在图表上激活指标时,它会在每分钟的前十秒内耐心等待,让市场显示其初始情绪。如果上升笔数多于下跌笔数,则该指标会提示您考虑买入交易,反之亦
Binary Sig2
Rustam Tairov
Представляю вам индюка скальпера, а также хорошо отрабатывает на бинарных опционах, дополнительно добавлена функция уведомления, где своевременно вы сможете открыть ордера в любом месте, главное чтоб был интернет, но, чтобы данная функция  работала установите индюка на желаемые котировки и все это на сервер VPN. В данном индикаторе для дополнительной фильтрации сигнала используется индикатор RSI, период можно изменить в настройках, для поиска входов в открытие сделки,  установите индикатор на та
Binary Options Assistant (BOA) BURN Signals Indicator provides signals based on Ana Trader Binary Options Strategy. Indicators: MACD & Stochastic Stop missing trades, stop jumping from chart to chart looking for trade set-ups and get all the signals on 1 chart! U se any of the BOA Signals Indicator with the  Binary Options Assistant (BOA) Multi Currency Dashboard .  All BOA Signal Indicator settings are adjustable to give you more strategy combinations. The signals can be seen visually and hea
Yawabeh SD Pro –  Professional Supply and Demand Indicator Trade Smarter with Volume-Confirmed Supply/Demand Zones Our institutional-grade algorithm identifies high-probability reversal zones before price reacts, giving you the edge in Forex, Crypto, and Stocks. Key Features Multi-Timeframe Confirmation – View trend strength across multiple timeframes simultaneously – Align your trades with higher timeframe momentum Smart Alert System – Real-time notifications for: – Strong demand/supply zone
TrendBand Navigator Pro —— 永不重绘的多周期趋势交易系统,独创的多维趋势带算法,为您提供清晰的箭头信号 大箭头定方向 小箭头抓买卖     核心优势   智能过滤噪音 :融合波动率自适应技术,有效规避虚假突破,仅在趋势动能强劲时触发箭头信号   多时间框架兼容 :无论日内短线或波段交易,自动适配1分钟至月线图,满足不同策略需求   视觉化K线图表 :双色K线,辅助判断趋势延续性   零延迟箭头信号 :提前标注潜在反转点,双色箭头醒目提示多空转换 交易策略 第一步:双重验证开仓 1. 大箭头定趋势  - 等待趋势启动信号(彩色趋势带+大箭头) 2. 小箭头抓时机  - 当同方向小箭头出现时立即进场 第二步:智能分批离场 •   保守策略 :反向箭头出现时全仓平仓 •   激进策略 :盈利20-30点后平半仓,剩余仓位带移动止损直至趋势反转
The Binary Profit Maker,  This indicator works on MT4 and is very easy to use. When you receive a signal from it, you wait for that candle with the signal to close and you enter your trade at the beginning of the next new candle . A Up Purple arrow means Buy and a Down Purple arrow means Sell. All arrows comes with Alert  like for easy identification of trade signal. Are you okay with that? How To Enter Trade? 1 minute candle 1 minute expire
This is a ready-made strategy for binary options! Support/resistance levels are used to form a signal, while a number of built-in indicators are applied to sort out incoming signals. An arrow appears during a signal formation. If the signal is active, then the arrow remains after the close of the bar; if the signal is not strong enough, the arrow disappears. With a small number of signals and a small trading time, you will not need to sit all day at the computer, especially since you can enable
Rattling Signal Point
Muhammed Emin Ugur
This   Rattling Signal Point   indicator is designed for signal trading. This indicator generates trend signals. It uses many algorithms and indicators to generate this signal. It tries to generate signals from the points with the highest trend potential. This indicator is a complete trading product. This indicator does not need any additional indicators. The indicator is never repainted. The point at which the signal is given does not change. When the signal comes the arrows are put back on
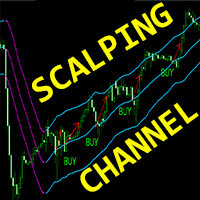
Scalping Channel mq
DMITRII GRIDASOV
适用于 MT4 的 Crypto_Forex 指标“Scalping_Channel”。 - 剥头皮通道具有基于 ATR 的波动边界。 - 非常适合用于剥头皮交易: - 通过安排中线的限价挂单进行交易。 - 当绿色稳定上行通道出现且至少有 1 根蜡烛在顶部边界上方关闭时,考虑看涨入场(见图片)。 - 当红色稳定下行通道出现且至少有 1 根蜡烛在底部边界下方关闭时,考虑看跌入场(见图片)。 ................................................................................................................... 点击这里查看高质量的交易机器人和指标! 这是仅在此 MQL5 网站上提供的原创产品。
RectangleInd
Aliakbar Mohseni Pour
One of the most successful strategies in Forex, stick and metal market, is rectangle pattern. A hard pattern to find in multiple time frames, but, We made it so very easy for you. You can turn on this indicator in different currency pairs with different time frames and set the alarm on your computer or mobile phone. Working with this strategy is easy and enjoyable. Telegram:  https://t.me/triangleexpert Instagram: https://www.instagram.com/p/CNPbOLMh9Af/?igshid=15apgc7j1h5hm Note: This indicat
Some informations on the chart with the single attachment. RangeBorder Buy Sell (RBBS) Non Repaint Indicator will provide trend line, buy sell arrows,reversal arrows, range channel, order exit area,high average price line and low average price line.All arrows and lines don't repaint and not lagging. Once candle closed it won't  repaint. Reading Indicator: 1. Small Stars , Indicates oversold and overbought with certain logic and price may reverse when this small star triggers. Useful to identify
BinaryAIMBOT
Artur Karian
The indicator is designed for binary options. It produces a sound alert, after which you should instantly enter the market. The indicator operates based on signals form RSI and CCI, as well as support and resistance levels. When the chart is in overbought and oversold zones, the indicator finds a level in this zone and notifies you using a sound and a message. Indicator Parameters dist - the number of points to generate a signal. Suitable values ​​are from 21 to 50. Filtr_SMA - the filter, used
Pine script scalping indicator 是一款多层次的分析系统,专为在高波动条件下对价格微观结构波动进行精确解读而设计。其核心基于复杂的动态价格序列过滤模型,结合跨周期投影与趋势向量的非线性逼近。 不同于传统的技术分析工具,该指标不仅仅局限于静态振荡器方法,而是采用混合式市场数据流解读,并通过多阶段一致性验证趋势轮廓。该系统实现了“自适应剥头皮”的概念,使操作者即使在混乱噪声区域也能获得稳定的分析提示。 指标在终端的独立窗口中运行,显示多通道方向性分析结构,重点突出极值概率区域。信号簇通过可视化标签标记,从而保证在实时市场环境中的即时解读。 优势: 基于跨周期过滤的自适应数据解读。 自动识别关键区域,在这些区域内价格冲击概率达到局部最大值。 趋势状态下的动态曲线采用颜色编码。 可与外部算法结合,构建复杂的交易系统。 对市场噪声和虚假波动具有高度抗干扰性。 应用范围广泛:日内交易、剥头皮、算法化策略。 使用方法: 在 MetaTrader 5 图表中安装该指标。 切换到高频波动的时间框架(M1–M15)。 根据颜色通道和标记解释动态曲线:颜色方向代表主导趋势的阶段。
Always Strong indicator, an indicator that uses MacD and Bollinger bands. It is a coded indicator to find trends. It finds these trends by its own algorithm. This indicator requires visual monitoring. It does not give any warning because it needs visual follow-up. The main trendline should turn down to find the down trend. The main trend line should go under the white line and then go under the yellow line. The main trendline should turn upward to find the upward trend. The main trend line shoul
BinaryLuckMt4
Andrey Spiridonov
1 (1)
The BinaryLuck indicator is a powerful indicator for trading binary options with any expiration times. This indicator will be especially useful for trading short-term binary options with an expiration time of 30-60 seconds. This is a complete ready, self-contained trading system. The indicator predicts the maximum High and minimum Low for the current candle. Then it calculates the path the price has passed on the current candle as a percentage of the predicted High/Low range ( Range of candles )
Candlestick Patterns Scanner MT4
KEENBASE SOFTWARE SOLUTIONS
KT Candlestick Patterns Scanner is a Multi-Symbol and Multi-Timeframe scanner that fetches and shows various candlestick patterns on 28 currency pairs and 9 time-frames concurrently . The scanner finds the candlestick patterns by loading the KT Candlestick Patterns indicator as a resource in the background. Features The scanner can find the candlestick patterns on 252* combinations of symbols and time-frames from a single chart. Open the signal's chart loaded with a predefined template with a s
Naomi Binary Options
Yaroslav Varankin
The indicator is designed for trading binary options on small timeframes up to 15 m Easy to use does not need additional settings and can be used without additional filters Recommendations for trading When a signal appears (blue arrows pointing up), you need to consider the buy direction When a signal appears (the red line indicates the bottom), you need to consider the direction to sell To conclude a deal is on the candle where the signal for one candle came, if the signal turned out to be unpr
Multi Signal
Filip Maurice Daelman
Multi Signal Indicator contains a whole series of intersting buy,sell and exit signals that can be separately turned on/off. Signals : Liquidity Pools Liquidity Pools Forecast Projection Reversal Blocks Pinbar groups Overbought/Oversold with Moving Average Band (5 MA bands) Moving Average Difference Liquidity is an important aspect in the market, especially for institutional investors, as they need lots of liquidity to enter or exit the market. Therefore, institutional traders focus more on dema
Pro Magic Signal   indicator is designed for signal trading. This indicator generates trend signals.  It uses many algorithms and indicators to generate this signal. It tries to generate a signal from the points with the highest trend potential. This indicator is a complete trading product. This indicator does not need any additional indicators.  The indicator certainly does not repaint. The point at which the signal is given does not change.  Thanks to the alert features you can get the signals
Quantum Balance
Adolfina Denysenko
Quantum Balance is a modern arrow indicator that identifies key price reversal points in the market with high accuracy. It is based on a combination of WPR (Williams %R) and RSI (Relative Strength Index), which allows you to identify overbought/oversold moments and enter trades at points of maximum potential. The indicator analyzes price dynamics and market conditions, generating signals only when several confirming factors coincide. This reduces the number of false signals and increases tradin
EARLY REMINDER: The Starting price is 65 price will rise soon up to 365$ and then 750$ after first 10 copies of sales. Grab this offer now! Introduction Hello, traders! Welcome to the demonstration of the Forex Beast Indicator , a comprehensive tool designed to assist aspiring traders in navigating the complexities of the forex market. This indicator incorporates seven essential components to provide a well-rounded trading experience: Moving Averages Colored Zones Support and Resistance Levels
Trend Professional is an indicator that generates trend signal. It generates trend signal with its own algorithm. These arrows give buying and selling signals. The indicator certainly does not repaint. Can be used in all pairs. Sends a signal to the user with the alert feature. Trade rules Enter the signal when the buy and sell signal arrives. Processing should only be initiated when signal warnings are received. It is absolutely necessary to close the operation when an opposite signal is recei
Target Striking
Dmitriy Kashevich
Target Striking - One of the best binary options trading tools! It is set up so powerfully that you can trade not only on currency pairs, but also on raw gold oil! You can also try on cryptocurrency! Ideal for trading on currency pairs, the percentage of reliable transactions is more than + 75% The trading tool is already set for the best profit! Only Target Striking can unlock the potential of the trading market for you! With it, the signals are even and accurate without redrawing, a sig
Trend Hounter MT4
Mansour Babasafary
An indicator based on candlestick patterns To catch short-term and long-term trends If it gives a signal in the direction of the trend, it is long term And if it gives a signal in the opposite direction of the trend, it is short term Too many signals Can be used in all symbols Can be used in all time frames Attributes: Too many signals Can be used in all symbols Can be used in all time frames Simple settings Simple and fast usage With author lifetime support Settings: Candle back: The number
BinaryPin
Andrey Spiridonov
3.67 (3)
BinaryPin is an indicator developed and adapted specifically for trading short-term binary options. The indicator's algorithm, before issuing the signal, analyzes many factors, such as market volatility, searches for the PinBar pattern, calculates the probability of success when making a deal. The indicator is set in the usual way. The indicator itself consists of an information window where the name of the trading instrument is displayed, the probability of making a successful transaction, the
FREE
适用于 MT4 的 Crypto_Forex 指标“ ReTest Pro Histogram ”,无需重绘。 - ReTestPro_Histogram 指标可用于在强支撑/阻力位重测后寻找进入主趋势方向的入场信号。 - ReTestPro 直方图有两种颜色:红色表示看跌趋势,绿色表示看涨趋势。 - 一旦看到相同颜色的稳定连续直方图柱,即表示新趋势出现。 - ReTest 信号在直方图中第一列颜色与当前趋势颜色相同,第二列颜色与趋势颜色相同(如图所示)。 - 指标内置手机和电脑端警报。 - 指标包含点差/掉期信息显示 - 显示其所属外汇对的当前点差和掉期。 - 显示屏还显示账户余额、净值和保证金。 - 可以将信息点差掉期显示放置在图表的任意位置: 0 - 左上角,1 - 右上角,2 - 左下角,3 - 右下角。 指标使用方法: - 买入信号:稳定连续的绿色柱状图(上涨趋势)+ 柱状图上1个红色柱状图(重新测试)+ 1个绿色柱状图(在此建立多头头寸)。 - 卖出信号:稳定连续的红色柱状图(下跌趋势)+ 柱状图上1个绿色柱状图(重新测试)+ 1个红色柱状图(在此建立空头头寸)。
Scalping arrows not redraw - an indicator that shows price reversal points on the chart and does not redraw its signals. Also, the indicator sends signals to the trader via Email and Push. The accuracy of the signals of this indicator is approximately 92-94% on the M5 timeframe and more than 95% on the H1 timeframe. Thus, this indicator allows the trader to accurately open trades and predict further price movement. Price reversal points on the chart are indicated using simple and understandable
Binary and Scalping Mt4
Justine Kelechi Ekweh
This is a trend following system for Binary options traders and forex scalpers. It is carefully crafted and recognizes periods of strong trends in the market and gives the trader the advantage and opportunity of riding with the momentum. It works on all timeframes and currency pairs especially high liquidity pairs. Avoid news events 15mins before and after. Always have your money management script or system in place. Tested on Deriv synthetics as well, please check screenshots. MT5 version can b
该产品的买家也购买
Trend SniperX MT4
Sarvarbek Abduvoxobov
5 (5)
Trend Sniper X 是一款用于 MetaTrader 5 的多周期趋势追踪指标,旨在帮助交易者清晰、精准地识别趋势方向及潜在的反转点。 适用于 MT5: https://www.mql5.com/en/market/product/181101 价格信息: 当前价格为促销价,随着后续更新和新功能的推出,价格可能会发生变动。 Code2Profit 频道 通过多周期分析掌控市场! 如何使用 Trend Sniper X 最大化胜率:关键规则与交易时段技巧 技术规格 交易平台 MetaTrader 5 指标类型 多周期趋势指标 运行时间周期 任意图表周期,支持独立选择更高周期(M1–MN1) 主要交易品种 外汇、黄金 (XAUUSD) 及其他 CFD 差价合约 推荐账户 任何账户类型 可视化呈现 彩色趋势 K 线(买入/卖出/弱势/转变)+ 买入/卖出信号箭头 附加模块 市场交易时段框(悉尼、东京、伦敦、纽约) 核心功能 多周期趋势分析: 将更高周期的趋势方向直接投影到当前图表上,提供清晰的宏观视角。 弱势/不确定 K 线检测: 高亮显示趋势状况不明确的 K 线,帮助交易者远离震
AW Prime Oscillator
AW Trading Software Limited
5 (1)
两个振荡器的组合。第一个显示入场点,第二个显示当前趋势。该指标可以通过两种模式的箭头显示振荡信号,所有快速振荡信号或仅在当前趋势方向的信号。它具有多时间范围面板和三种类型的信号通知。 好处: 适合当日交易和倒卖交易 趋势过滤 简单而灵敏的设置 多时间框架面板 适合融入顾问。 适用于任何交易品种和任何时间范围 三种类型的通知 MT5 version ->  HERE  / Problem solving ->  HERE 指标策略 该指标由两个不同的振荡器组成: 慢趋势线(粗) - 当指标的最高水平从上到下交叉时,它是下降趋势的指标,当较低的水平水平(指标的低水平)从下到上交叉时,它是下降趋势的指标上升趋势。此外,在较低区域找到一条慢线表明当前趋势是下降趋势,反之亦然,在上方区域找到一条慢线表明当前趋势是上升趋势。这就是该指标确定当前市场趋势的方式。 快速入场线(细):识别从下到上与下线相交处的入场点,这是买入信号,在从上到下穿越上线时,这是卖出信号。除了振荡线之外,调整指标线也很重要,因为这会影响信号的数量和准确性。 本产品使用不同的振荡器来显示慢线和快线,每个振荡器必须单独调整。 为
Super Signal – Skyblade Edition 專業級無重繪 / 無延遲趨勢信號系統,擁有卓越勝率 | 適用於 MT4 / MT5 在較低的時間週期上效果最佳,例如 1 分鐘、5 分鐘與 15 分鐘圖表。 核心特色: Super Signal – Skyblade Edition 是一套專為趨勢交易設計的智能信號系統。 其採用多重濾波邏輯,僅篩選出具有明確方向性、動能強勁且波動結構健康的走勢進場點。 本系統 不預測高點或低點 ,只有在同時滿足以下三項條件時才會觸發交易信號: 趨勢方向明確 動能持續增強 波動率結構穩定 此外,系統還結合市場流動性分析,以進一步提升信號的準確性與觸發時機。 信號特性: 所有箭頭信號皆為 100% 無重繪,無延遲 信號一旦出現即固定於圖表,不會閃爍或消失 提供圖表箭頭、資訊面板、彈出通知、聲音提示及推播訊息 支援 EA 呼叫(Buffer 輸出),可整合至自動化交易或信號跟單系統 提供預設參數模板,免調整即可使用,適合新手快速上手 總結: Super Signal – Skyblade Edition 是一款邏輯清晰、穩定高效的專業趨勢型
Liquidity Scalper System
Stanislav Konin
5 (1)
Liquidity Scalper System: 基于流动性的指标形式交易系统。 大多数指标只显示一个箭头,止损放在哪里、目标在哪里、信号是否可信,都要交易者自己判断。Liquidity Scalper System 覆盖完整的交易周期:寻找流动性池,在其被突破时给出信号,立即计算 Entry、Stop Loss 和三个目标,并在面板上显示统计数据以及新数据上的验证结果。系统自行选择设置,并每天更新。 工作原理 1. 系统寻找流动性池:市场参与者止损单聚集的价位。 2. 当价格突破流动性池,且突破经由动能(必要时还经由成交量)确认后,图表上出现 BUY 或 SELL 箭头。 3. 立即绘制 Entry、Stop Loss、TP1、TP2 和 TP3 水平,并填充区域。 4. 右侧构建流动性分布图:可以看到价格上方和下方大成交量集中的位置。 与众不同之处 • 自动优化取代手动调参。 系统在历史数据上测试 32 种设置组合,为当前品种和周期选出最佳组合。优化目标可选:Win Rate、净利润或盈利因子。 • 新数据验证。 设置在一部分历史上训练,并在优化器未见过的更新数据上检验(out
Atomic Analyst
Issam Kassas
5 (14)
Atomic Analyst — MetaTrader 4 如有产品、设置或技术支持方面的问题,请直接在 MQL5 上给我发消息。 该指标将复杂的市场计算转换为简单的视觉信号、彩色K线、趋势读数、止损水平和多个止盈区域,使交易者能够快速理解并应用于真实市场环境。 主要交易用途: 剥头皮和日内交易: 专为快速决策、清晰箭头、提醒、K线颜色和结构化进出场区域而设计。 日内交易和波段交易: 帮助交易者利用趋势方向、强度、动能和多周期分析跟随更大的市场波动。 主要功能: • 价格行为、强度和动能分析 • 多周期趋势扫描器 • 总体趋势百分比计算 • 买入和卖出箭头 • 止损和多个止盈水平 • 最多 5 个基于斐波那契的止盈水平 • 移动止损逻辑 • 用于趋势和动能的彩色K线 • 实时提醒到终端、手机和电子邮件 • 现代化用户友好面板 • 实时交易监控 • 买入和卖出潜力显示 • 总交易数量显示 • 每日、每周和总利润显示 • 每日佣金计算 • Bid、Ask 和点差显示 • K线计时器、本地时间和服务器时间 • 终端连接状态 • 账户货币显示 • 可直接从面板控制时间周期 • 可手动使用,
Smart Trend Trading System
Issam Kassas
4.8 (10)
Smart Trend Trading System 是适用于 MetaTrader 4 的图表指标,将趋势信息、入场和出场信号以及价格水平集中呈现在同一图表上。 它将 10 多种交易工具 整合到一个系统中,包括趋势检测、反转区域、Smart Cloud、移动止损逻辑、支撑与阻力、K线着色、提醒以及多周期分析。 该系统旨在帮助您应对不同的市场环境: 趋势市场: 识别主要趋势,发现回调,跟随动能,并通过止损指导和移动止损选项寻找更清晰的入场机会。 震荡市场: 识别区间震荡状态,寻找价格反应区域,并在价格触及重要水平时获得更清晰的信号。 剥头皮和日内交易: 使用快速信号、K线颜色、提醒和多周期确认,辅助短线交易决策。 主要功能: • 10 多个指标整合为一个交易系统 • 7 多种策略和信号组合 • 趋势跟随、反转、剥头皮、日内交易和波段交易模式 • 入场和出场箭头 • Smart Cloud • Smart Reversal Zones • 支撑和阻力水平 • Smart Trailing Stop • 多周期趋势分析 • 成交量、趋势和反转K线着色 • 手机、电子邮件和终端提醒 •
Neuro Poseidon MT4
Daria Rezueva
4.74 (46)
Neuro Poseidon is a new indicator by Daria Rezueva. It combines precise trading signals with adaptive TP/SL levels - creating best possible trades as a result! Message me and get  Neuro Poseidon Assistant  as a gift to automize your trading process! What makes it stand out? 1. Proven profitability on all assets and timeframes 2. Only confirmed BUY and SELL signals present on the chart 3. Adaptive TP & SL levels generated by the software for each trade 4. Easy to understand - suitable for all
目前八折优惠! 对任何新手或专家交易者来说都是最好的解决方案! 这个仪表板软件适用于28种货币对。它基于我们的两个主要指标(高级货币强度28和高级货币冲动)。它对整个外汇市场提供了一个伟大的概述。它显示高级货币强度值,货币运动速度和28个外汇对在所有(9)时间段的信号。想象一下,当你可以使用图表上的单一指标观察整个市场,以确定趋势和或剥头皮的机会时,你的交易将得到改善 我们已经在这个指标中建立了一些功能,使你更容易识别强势和弱势货币,同时识别和确认潜在的交易。该指标以图形方式显示货币的强势或弱势是增加还是减少,以及它在所有时间段的表现。 增加的新功能是动态市场斐波那契水平,它适应当前的市场条件变化,这是一个已经在我们的高级货币强度28和高级货币冲动指标中使用的成熟的加分项。 在交易时,总是将弱势货币和强势货币配对,这个新指标将帮助你做到这一点。 用户手册:点击这里  https://www.mql5.com/en/blogs/post/708783 特点  显示每个时间段的ACS28和GAP-speed(冲动)的货币强度值。 列:颜色代码以7种颜色显示货币强度:强势
SR Liquidity
Oleg Rodin
5 (2)
SR Liquidity 是一款旨在揭示市场流动性高度集中且价格反应最剧烈的隐蔽区域的交易指标。这些特殊的流动性区域充当着强有力的支撑位与阻力位,为您清晰呈现市场最可能发生反转的位置。 SR Liquidity 指标并非简单地绘制常规的支撑/阻力线,而是通过分析实际的价格行为,识别买卖压力积聚的区域。这些区域实际上是推动市场真实波动的流动性池。通过在图表上直观呈现这些区域,该指标能助您在价格反应发生前预判走势——这意味着它实际上能够预测价格方向可能发生的变化。它将原始的价格行为转化为清晰且具实操价值的市场蓝图,标示出那些可能成为市场转折点的关键价位。 该指标适用于任何交易品种和时间周期——包括外汇、指数、金属、加密货币等。支持任意时间周期。 购买后请联系我,以获取交易指南及免费赠送的优质附加指标!
M1 Sniper
Oleg Rodin
4.97 (30)
M1 SNIPER 是一款易于使用的交易指标系统。它是一个专为 M1 时间框架设计的箭头指标。该指标可以作为独立的系统在 M1 时间框架下进行剥头皮交易,也可以作为您现有交易系统的一部分使用。虽然该交易系统专为 M1 时间框架交易而设计,但它也可以用于其他时间框架。我最初设计此方法是为了交易 XAUUSD 和 BTCUSD。但我发现这种方法在其他市场交易中也同样有用。 指标信号既可以顺势交易,也可以逆势交易。我教授一种特殊的交易技巧,帮助您利用指标信号进行双向交易。该方法基于使用特殊的动态支撑位和阻力位区域。 购买后,您可以立即下载 M1 SNIPER 箭头指标。此外,我还为所有 M1 SNIPER 工具用户免费提供下方屏幕截图所示的 Apollo Dynamic SR 指标!这两个指标的组合可以帮助您更轻松、更准确地利用 M1 时间框架进行交易。 购买后请联系我,免费获取交易提示和奖励指标! 祝您交易成功!
Top Bottom Tracker MT4
Rodrigo Arana Garcia
Top Bottom Tracker 是一款基于复杂算法的指标,可分析市场趋势并检测趋势的高点和低点 / MT5 版本。 价格将逐步上升,直至达到 500 美元。下一个价格 --> $99 功能特点 无重绘 新数据到来时 该指标不会改变其数值 交易货币对 所有外汇货币对 时间框架 所有时间框架 参数 ==== 指标配置 ==== 配置参数 // 40(值越高,发出的信号越少但越准确) 上水平值 // 80(上水平线的值) 下水平线值 // 20(下水平线值) 指标计算条数 // 3000(您希望指标计算多少条。数值 0 将计算所有条形图的指标) ==== 警报配置 ==== 弹出警报 // true (在终端上发出警报) 电子邮件报警 // true (通过电子邮件报警) 警报时间间隔 // 10 (警报时间间隔,以分钟为单位) 警告 我只在 MQL5.com 上销售我的产品。如果有人联系您向您推销我的产品,那么他们就是骗子,只想要您的钱。 此外,如果您从外部网站购买我的产品,我向您保证,这些产品都是假冒版本,与正版产品效果不同。
Advanced Supply Demand
Bernhard Schweigert
4.91 (302)
现在优惠 30%! 任何新手或专业交易者的最佳解决方案! 该指标是一款独特、高质量、且价格合理的交易工具,因为我们已经整合了许多专有功能和新公式。 依据此更新,您将能够显示双重时间帧区域。 您不仅可以显示一个较高的时间帧,还可以同时显示图表时间帧,加上更高的时间帧:显示嵌套时区。 供需双方所有交易者都会喜欢它。 :) 重要信息披露 高级供需的最大潜力,请访问 https://www.mql5.com/zh/blogs/post/720245   想象您的交易如何得以改善,是因为您能够精准定位入场或目标位吗? 构建于新的底层算法,它可以更轻松地识别出买卖双方之间的潜在失衡。 这是因为它以图形方式展示供需最强劲区域,及其过去的表现(显示旧区域)。 这些功能旨在帮助您更轻松地发现最佳入场区域和价位。 现在您可以针对您的交易品种和时间帧来优化和编辑区域强度! 高级供需指标适用于所有产品和时间帧。 它是一个新的公式,非常新的功能是两个区域强度函数可由用户输入进行调整! 这在交易中是一大优势。 当您学习如何使用专有功能,例如带有价格游离最小 X 因子的区域强度时,您能够判断该区域强劲与否。 供需
Cycles Predictor
Martin Eshleman
Cycles Predictor Indicator This indicator uses past market cycles to predict future price movements. The indicator scans through past data and considers  combinations  of cycles. When cycles  coincide  at the same future date/time then it is considered a valid future prediction. The predictions are drawn as vertical lines on the right side of the chart in the future. A prediction will often result in type of candle (ex. bull or bear) and/or a reversal point (ex. bottom or top) forming at this ex
Break and Retest Hunter MT4 is a powerful MetaTrader 5 indicator designed to automatically identify support and resistance levels, breakout structures, and potential retest opportunities in real time. Bonus Indicator: After purchasing Break and Retest Hunter , contact me to receive Trade Indicator Assistant EA completely free as a bonus utility. $65 for the next 10 copies . Next price is $120.  Combining adaptive market analysis, clear BUY/SELL signals, Fibonacci-based profit targets, and a pre
PRO Renko System
Oleg Rodin
5 (31)
PRO Renko Arrow Based System for trading renko charts.  准确的信号交易任何外汇工具. 另外,我将免费提供系统的附加模块! PRO Renko系统是RENKO图表上高度准确的交易系统。该系统是通用的。 该交易系统可应用于各种交易工具。 该系统有效地中和了所谓的市场噪音,打开了获得准确反转信号的通道。 该指标易于使用,只有一个参数负责产生信号。 您可以很容易地使算法适应您感兴趣的交易工具和renko酒吧的大小。 我很乐意通过提供任何咨询支持来帮助所有客户有效地使用该指标。 祝您交易成功!购买后,立即写信给我! 我将与您分享我的建议和我的renko发电机。 另外,我将免费提供系统的附加模块!
ForexTrendMT4
Andriy Sydoruk
5 (1)
ForexTrendMT4 Indicator: A Reliable Tool for Market Tracking The ForexTrendMT4 indicator offers reliable market trend tracking, filtering out sudden fluctuations and market noise. This tool helps identify trends and signals favorable entry points into the market using arrows. It is suitable for both scalping on shorter timeframes and long-term trading strategies. Based on the principles of technical analysis, ForexTrendMT4 takes into account the cyclical nature of the market. Key Features and A
CRT Multi-Timeframe Market Structure & Liquidity Sweep Indicator Non-Repainting | Multi-Asset | MT5 Version Available MT5 Version:   https://www.mql5.com/en/market/product/162075 Full User Guide — explains what each feature does and why:   https://www.mql5.com/en/blogs/post/767525 Quick Start User Guide  — explains how to configure and in what order:  https://www.mql5.com/en/blogs/post/767540 Indicator Overview CRT Ghost Candle HTF Fractal is a complete institutional-grade market structure too
KT Parabolic RSI MT4
KEENBASE SOFTWARE SOLUTIONS
KT Parabolic RSI overlays Parabolic SAR directly on the RSI line to highlight likely market turning points. Classic RSI overbought and oversold readings already hint at reversals, and the added PSAR filter removes much of the noise and sharpens those signals, giving you clearer trade setups. Big Square Signals: A Parabolic SAR flip on an RSI that sits in overbought or oversold territory. These mark high-probability market turns. Small Square Signals: A SAR flip inside the neutral RSI band. Treat
Currency Strength Wizard
Oleg Rodin
4.85 (61)
货币强度向导是一个非常强大的指标,为您提供成功交易的一体化解决方案。该指标使用多个时间范围内所有货币的数据来计算这个或那个外汇对的力量。此数据以易于使用的货币指数和货币电力线的形式表示,您可以使用它们来查看这种或那种货币的力量。 您所需要的只是将指标附加到您要交易的图表上,该指标将向您显示您交易的货币的真实强度。该指标还向您显示买卖量压力的极值,您可以在顺势交易时利用这些压力。该指标还显示了基于斐波那契的可能目标。该指标可用于各种交易时间范围。该指标支持各种货币对的交易。 该指标为您提供所有类型的警报,包括推送通知。 购买后请联系我。我将与您分享我的交易技巧,并免费为您提供丰厚的红利指标! 祝您交易愉快,获利丰厚!
Advanced Currency Strength28 Indicator
Bernhard Schweigert
4.91 (659)
目前40%的折扣 任何新手或专家交易者的最佳解决方案! 这个指标是一个独特的、高质量的、可负担得起的交易工具,因为我们纳入了一些专有的功能和一个新的公式。只需一个图表,你就可以读出28个外汇对的货币强度!想象一下,你的交易将如何得到改善,因为你的交易是在你的手中进行的。想象一下,你的交易将如何改善,因为你能够准确地确定新趋势或剥头皮机会的触发点? 用户手册:点击这里  https://www.mql5.com/en/blogs/post/697384 这是第一本,原版的! 不要买一个毫无价值的崇拜者的克隆品。 特别的 子窗口中的箭头显示强劲的货币势头GAP将指导你的交易! 当基础货币或报价货币处于超卖/超买区域(外盘斐波那契水平)时,在个人图表的主窗口中出现警告信号。 当货币力量从外围区间回落时,回撤/反转警报。 十字星模式的特别警报 可选择多个时间框架,以快速查看趋势! 货币强度线在所有的时间框架中都非常平稳,当使用较高的时间框架来识别总体趋势,然后使用较短的时间框架来确定精确的入口时,效果非常好。你可以根据自己的意愿选择任何时间框架。每个时间框架都由其自身进行了优化。
Volume Orderflow Profile
Suvashish Halder
5 (2)
Introducing Volume Orderflow Profile , a versatile tool designed to help traders visualize and understand the dynamics of buying and selling pressure within a specified lookback period. Perfect for those looking to gain deeper insights into volume-based market behavior! MT5 Version -  https://www.mql5.com/en/market/product/122657 The indicator gathers data on high and low prices, along with buy and sell volumes, over a user-defined period. It calculates the maximum and minimum prices during this
箭头只告诉您买入。Obsidian Scalper Pro 告诉您在哪里买、止损放在哪里、三个目标在哪里、按照您的风险仓位该有多大,以及这个形态在 100 分里值多少分。每个信号都以一份画在图表上的完整交易计划的形式到来,内置的统计窗口展示最近一百个信号的诚实结果,连带置信区间的胜率一并给出。每个决定都在收盘K线上做出,所以您看到的历史,就是您本可以交易的那段历史。 该指标在黄金(XAUUSD)M30 上表现最佳,也可用于任何其他品种和周期。 需要与之配套的策略吗? 购买后请在 MQL5 上给我发消息,我会发送给您。 它做什么 Obsidian Scalper Pro 在既有趋势中寻找回调入场,并为每一个入场交出一份现成的计划。Entry、SL、TP1 和 TP2,以及可选的 TP3,作为水平线和阴影区域直接画在图表上,带着价格标签和 R:R 比例。手数由您的风险百分比和这个信号实际的止损距离算出,使用亏损方向的跳动点价值,因此在 CFD 和交叉货币账户上都保持正确。每个信号还有一个 0 到 100 的 Score,面板上另有一个实时的就绪度数值,说明此刻的形态会有多好。 三层结构,一
UR TrendExhaustion
Krzysztof Jan Debski
UR 趨勢疲憊   UR TrendExhaustion 是不想處理參數值或其他設置的交易者的最佳解決方案 - 它對每個人來說既簡單又直觀易懂。 使用 UR TrendExhaustion 的優勢: 無參數 您有 3 條線最能描述圖表上的情況:趨勢耗盡線、鯨魚資金線和零售資金線。 該界面展示了兩個極端(紅色區域)上任何一條線的耗盡 最大優勢:簡單且可適應所有資產。 有一個特殊的電報聊天,您可以在其中了解最新的工具更新,如果您覺得缺少什麼,也可以發送請求! 為什麼是 UR TrendExhaustion? 在我的整個職業生涯中,我一直在編寫多種指標,並達到了這樣一個地步,即我收集了我所有的知識來編寫這個簡單但最好的 (imo) 工具來進行交易,而不需要圖表上的任何其他工具。 易於理解,易於設置。 該策略的執行方式使做市商很難與它進行交易 - 將死 MM! 您與 UR TrendExhaustion 一起使用的任何其他工具都會增加您的交易,但我一直單獨使用它並取得了很好的效果。 祝你好運! 如何使用 UR TrendExhaustion ? YT 上有一段視頻展示瞭如何使
This indicator works on MT4 and is very easy to use. When you receive a signal from it, you wait for that candle with the signal to close and you enter your trade at the beginning of the next new candle . A red arrow means sell and a green arrow means buy. All arrows comes with Alert  like for easy identification of trade signal. Are you okay with that? 1 minute candle 1 minute expire
This is a professional chart indicator designed for traders focused on stability and clear price action. It helps filter market noise and provides clear visual entry and exit zones for your trading decisions. Core Features: Strictly Non-Repainting: The system is built with strict non-repaint logic. What you see on the chart is the true historical performance. Confirmed Signals: Signals are triggered and confirmed only after the candle closes . Once a trading arrow appears on a closed candle, it
GoldRush Trend Arrow Signal
Kirk Lee Holloway
5 (2)
GoldRush 趨勢箭頭信號 GoldRush 趨勢箭頭信號 指標為 XAU/USD 中的高速、短期短線交易者提供精確、實時的趨勢分析。 專為1分鐘時間框架設計,此工具顯示方向箭頭以明確顯示入場點,使短線交易者能在波動市場中自信操作。 該指標包含主要和次要警示箭頭。主要信號為白色和黑色方向箭頭,用於指示趨勢方向的轉變;次要信號為藍色和紅色箭頭,用於確認主要箭頭指示的方向並提示潛在交易入場點。 注意:當趨勢方向發生變化後僅出現一個主要警報箭頭時,請注意可能會出現多個次要藍/紅箭頭。次要信號將在滿足信號標準的任何蠟燭圖後出現,因此在長期趨勢移動中,螢幕上將顯示大量次要箭頭(如附帶的截圖所示)。您可在設置中開啟或關閉任一箭頭類型。 以下是我使用此指標進行交易的方式: - 對於買入入場,我會耐心等待白箭頭在蠟燭收盤時出現,並在下一根可用蠟燭收盤時出現藍箭頭時進行買入交易。 - 對於賣出入場,我會耐心等待黑箭頭在蠟燭收盤時出現,並在下一根可用蠟燭收盤時出現紅箭頭時進行賣出交易。 - 獲利了結/止損設置由使用者自行負責,但我個人使用最低R:R為1:2,並發現這在倫敦/紐約開盤等
Scalper Vault
Oleg Rodin
5 (40)
Scalper Vault 是一套功能强大且配置完善的交易系统,专为追求日内交易稳定性的交易者而设计。 作为一套完整且独立的交易系统,该高精度指标能够为外汇和二元期权交易者提供机构级的市场分析。 购买后请联系我,获取我的独家交易技巧以及一份超值赠品! Scalper Vault 能够消除凭感觉交易和复杂的各种手动分析,让您只需专注于执行交易,并运用简单易行的交易技巧进行操作。 精准的顺势交易信号:其核心算法通过分析市场结构,仅在市场主导趋势的方向上提供高胜率信号,从而大幅减少错误的入场操作。 精确的顶部与底部探测:系统能够识别市场动能耗尽的状态,从而锁定潜在的反转区域。 基于江恩(Gann)理论的买卖区域:系统会自动绘制江恩数学市场点位,让您能清晰洞察大型机构交易者在何处寻求买入或卖出。 100% 不会重绘(Non-Repainting):一旦K线收盘,生成的信号便会永久固定在图表上。绝无动态偏移,绝无虚假信号——您在历史数据中所见,即为该指标的真实表现。 广泛的市场适用性:适用于各类货币对、黄金、指数以及加密货币交易。
Trend Lines PRO
Roman Podpora
5 (1)
TREND LINES PRO 帮助您了解市场真正的方向转变点。该指标显示真实的趋势反转点以及主要参与者重新入场的时机。 您可以看到 BOS线、 趋势变化和更高时间框架的关键水平——无需复杂的设置或不必要的干扰。信号不会重绘,并在K线收盘后仍然保留在图表上。 VERSION MT 5    -   与……搭配使用时,可发挥其最大潜力   RFI LEVELS PRO 指示器 该指标显示的内容: 实际变化 趋势(BOS 线) 一旦信号出现,它就始终有效!这与会重绘的指标有着重要的区别,后者可能会发出信号后又改变信号,从而导致资金损失。现在,您可以更精准、更准确地进入市场。此外,还有一个功能,会在箭头出现后为K线着色,直到达到目标价位(止盈)或出现反转信号为止。 重复条目   以及主要玩家的充值 为了提高寻找入场点时的视觉清晰度,我们创建了一个模块,该模块首先显示买入/卖出区域,并在该区域内寻找最佳入场点。此外,我们还加入了智能逻辑来管理止损位,该逻辑会随着时间的推移逐步降低止损位的大小,从而降低入场交易时的初始风险(移动止损位)。 信号强度水平(BOS) 该指标采用三个显著性等级来衡量
Binary Trader Master
Oleg Rodin
3.5 (2)
Binary Trader Master 是一个基于箭头的指标,可预测蜡烛的收盘价。它仅在一根蜡烛内进行分析。当蜡烛打开时,需要一些时间来进行分析并预测蜡烛的收盘价。然后它产生一个信号。该指标还允许您应用可用于分析的时间限制,这意味着您实际上可以告诉指标允许在蜡烛内进行分析的时间。该指标监控蜡烛中的特殊交易量模式。该分析实际上预测了当前 (0) 蜡烛的收盘价。由于此类蜡烛通常具有强劲的成交量,因此这些信号也具有良好的获利潜力,也可用于外汇交易。二元和外汇交易者都可以从该指标中受益。 由于指标与单个蜡烛的主体一起使用,因此指标仅在实时或视觉策略测试模式下提供信号! 信号不要重绘! 购买后请联系我!我会为您提供交易说明,免费赠送您丰厚的红利!
Gann Made Easy
Oleg Rodin
4.84 (173)
Gann Made Easy 是一个专业且易于使用的外汇交易系统,它基于使用先生理论的最佳交易原则。 W.D.江恩。该指标提供准确的买入和卖出信号,包括止损和获利水平。您甚至可以使用推送通知在旅途中进行交易。 购买后请联系我,即可免费获得交易指导和超棒的额外指标! 您可能已经多次听说过江恩交易方法。通常 Gann 的理论不仅对于新手交易者而且对于那些已经有一定交易经验的人来说都是非常复杂的东西。这是因为江恩的交易方法在理论上并不那么容易应用。我花了几年时间来完善这些知识,并将最好的原则应用到我的外汇指标中。 该指标非常易于应用。您所需要的只是将其附加到您的图表并遵循简单的交易建议。该指标不断进行市场分析工作并寻找交易机会。当它检测到一个好的入口点时,它会为您提供一个箭头信号。该指标还显示止损和获利水平。 换句话说,当您像先生一样进行交易时,该指标会为您提供最佳江恩建议。江恩亲自告诉你此时此刻该做什么。但最好的部分是您不需要了解任何有关江恩交易原则的知识,因为该指标会为您完成整个市场分析工作。
作者的更多信息
SWING DETECTOR WITH RSI AND FIBONACCI Structural Swing Points + Fibonacci Retracement + RSI Overlay -------------------------------------------------- FREE INDICATOR Identify swings. See Fibonacci levels. Check RSI. All in one free indicator. -------------------------------------------------- WHAT THIS INDICATOR DOES This indicator automatically detects structural swing highs and lows using configurable depth and deviation filtering. It connects swings with trend lines, overlays standard
FREE
Trend and Consolidation Matrix
Charles Mwangi Ndungu
5 (1)
Trend and Consolidation Matrix 是一款适用于 MetaTrader 5 的市场结构与价格行为(Price Action)分析指标。它融合了 6 层自适应趋势带、空间整理区间检测算法以及突破与回踩警报系统,适用于外汇、黄金 (XAUUSD) 和股指交易。 专为剥头皮(Scalping)、日内交易和波段交易打造,所有趋势方向、波动结构和价格密度均在已收盘的 K 线上严格计算,历史数据绝无重绘。 核心市场结构架构 该指标在图表上同步呈现多层分析模型。 6层自适应趋势带 与方向性 EMA 彩云实时监测结构排列、斜率动能以及早期趋势转换。当市场处于趋势行情时,趋势带展开并显示方向色彩;当各层交叉纠缠时,系统自动切换为中性过渡云,提示突破前的蓄势整理状态。 空间整理引擎 基于摆动点几何形态与 K 线密集度算法识别二维整理区域。系统会自动绘制 微观区间 (日内紧密挤压区)、 宏观区间 (结构性摆动平衡区)以及由两者重叠生成的 共振区间 ,精准标定关键突破位置。 交易流程与信号执行 交易者可通过趋势彩云判断多空基调,在整理框内观察价格压缩形态,并在确认突破或回踩触发时执行
FREE
VWAP Ribbon Intelligence 是一款适用于 MetaTrader 4 的技术分析指标,融合了成交量加权平均价(VWAP)、动态威尔德(Wilder)ATR 波动带以及主图 RSI 动能数值显示,适用于外汇、黄金 (XAUUSD)、股指和加密货币交易。 专为日内交易、剥头皮(Scalping)和波段交易设计,无需在副图添加额外振荡指标,即可在主图直接呈现波动扩张和动能强弱。 核心分析架构 指标内置双模式计算引擎: Rolling VWAP (滚动周期模式)用于多根 K 线的连续趋势分析, Daily Reset VWAP (每日重置模式)以开盘价为基准锚定日内公允价值。基于威尔德平均真实波幅(ATR)计算的双层动态通道可随行情波动自动伸缩,分别标记内侧标准偏差区间与外侧统计极端边界。 内置的 主图 RSI 动能遥测系统 可在关键突破 K 线上下直接标注精确的 RSI 读数。历史标签在 K 线收盘后永久锁定,绝无重绘,同时提供可选的实时徽标跟踪当前活跃 K 线的动能演变。 交易流程与行情解读 价格处于中央 VWAP 附近反映市场平衡与公允价值整理。价格向内侧 ATR 轨
FREE
VWAP Ribbons
Charles Mwangi Ndungu
VWAP Ribbon Intelligence 是一款适用于 MetaTrader 5 的技术分析指标,融合了成交量加权平均价(VWAP)、动态威尔德(Wilder)ATR 波动带以及主图 RSI 动能数值显示,适用于外汇、黄金 (XAUUSD)、股指和加密货币交易。 专为日内交易、剥头皮(Scalping)和波段交易设计,无需在副图添加额外振荡指标,即可在主图直接呈现波动扩张和动能强弱。 核心分析架构 指标内置双模式计算引擎: Rolling VWAP (滚动周期模式)用于多根 K 线的连续趋势分析, Daily Reset VWAP (每日重置模式)以开盘价为基准锚定日内公允价值。基于威尔德平均真实波幅(ATR)计算的双层动态通道可随行情波动自动伸缩,分别标记内侧标准偏差区间与外侧统计极端边界。 内置的 主图 RSI 动能遥测系统 可在关键突破 K 线上下直接标注精确的 RSI 读数。历史标签在 K 线收盘后永久锁定,绝无重绘,同时提供可选的实时徽标跟踪当前活跃 K 线的动能演变。 交易流程与行情解读 价格处于中央 VWAP 附近反映市场平衡与公允价值整理。价格向内侧 ATR 轨
FREE
SWING HIGHS LOWS DETECTOR Swing Detection with Divergence Analysis -------------------------------------------------- Identify swings. Spot divergences. Trade with confluence. -------------------------------------------------- WHAT THIS INDICATOR DOES This indicator automatically detects structural swing highs and lows using configurable depth and deviation filtering. It then analyzes RSI and MACD to detect regular and hidden divergences between consecutive swings of the same type. Diver

FREE
SWING HIGHS LOWS DETECTOR Swing Detection with Divergence Analysis -------------------------------------------------- Identify swings. Spot divergences. Trade with confluence. -------------------------------------------------- WHAT THIS INDICATOR DOES This indicator automatically detects structural swing highs and lows using configurable depth and deviation filtering. It then analyzes RSI and MACD to detect regular and hidden divergences between consecutive swings of the same type. Diver
FREE
SWING VOLUME PROFILE Swing-Based Volume Profile + Fibonacci + RSI -------------------------------------------------- Auto-detected swings. Volume profile. Fibonacci. RSI. All-in-one. -------------------------------------------------- WHAT THIS INDICATOR DOES Swing Volume Profile (SVP) automatically detects structural swings and displays a volume profile for the most recent completed swing — with Fibonacci retracement and RSI overlay. No manual range selection needed. The indicator finds
Fixed Range Volume Profile 是一款适用于 MetaTrader 5 的成交量分布分析指标。通过在图表上绘制标准趋势线,即可计算并直观呈现任意自选价格与时间区间内的成交量分布,适用于外汇、黄金 (XAUUSD)、股指和加密货币交易。 专为日内交易、剥头皮(Scalping)和波段交易打造,指标会自动标出控制点(POC)、价值区高低轨(VAH/VAL)以及关键的高成交量支撑阻力位,无需繁琐的手动命名或复杂配置。 核心成交量分布架构 指标内置智能 趋势线追踪引擎 ,能自动捕捉图表上最新绘制或拖动的趋势线。当您在任何波段行情或整理区间上拖动、缩放趋势线时,成交量柱状图会在起点与终点之间实时平滑重绘。 系统自动计算 控制点(POC) 以标定该区间内成交量最大的核心价格,同时生成包含指定成交量比例(默认 70%)的 价值区(VAH 与 VAL) 。高成交量节点(HVN)会以醒目颜色标出主力密集成交区,而低成交量区域则揭示价格快速通过与流动性稀薄的区间。 交易流程与行情解读 分析行情时,只需在任意价格波动或盘整形态上绘制一条普通趋势线。指标会立即在两端点之间生成成交量分布图
Fixed Range Volume Profile MT4 Volume Profile Indicator — Auto-Detecting Trendline Tracking, POC, Value Area & High Volume Nodes in Real Time Fixed Range Volume Profile (FRVP) displays volume distribution over a user-defined range — automatically detecting the latest trendline you draw or drag on the chart. No manual range selection. No naming conflicts. Just draw a trendline and the profile appears. Update it live by dragging. MT4 Native • No Repainting • Real-Time Trendline Tracking • Fully Cu
Adaptive Swing Density Heat Map MT4 Structural Density Indicator — Swing Clustering, Participation Tracking, Acceptance vs Rejection & Color-Coded Heat Map Adaptive Swing Density Heat Map analyzes swing point density across price levels, then tracks how price actually interacts with each zone — measuring participation, acceptance, and rejection. The result is a heat map of structural zones, color-coded by density strength. Not all support and resistance levels are equal — this indicator quantif
CONSOLIDATION INTELLIGENCE PRO MT4 Consolidation Indicator | Automatic Range Detection + 5-Tier Price-Density Heatmaps + Re-Entry Alerts Consolidation Intelligence Pro is a MetaTrader 4 indicator designed to identify areas where price repeatedly overlaps and trades within a concentrated range. The indicator analyzes candle overlap, body-to-wick structure, zone strength, and price-density distribution, then displays detected consolidation areas as 5-tier heatmaps directly on the chart. It also su
DONCHIAN MARKET & TREND INTELLIGENCE ENGINE (MT4) Multi-Factor Volatility, Trend Structure & Institutional Breakout Validation Dashboard MOST BREAKOUT INDICATORS ARE TRAPPING YOU. They Tell You THAT Price Broke Out. They Never Tell You IF It Will Hold. You have lived this scenario dozens of times: Price spends days coiling inside a tight Donchian band on your MT4 chart. A massive candle punches above the 20-period high. You buy the breakout — expecting momentum. Three candles later, price colla
VWAP Sniper Reversal
Charles Mwangi Ndungu
VWAP Sniper Reversal Pro v3.00 MT4 Mean-Reversion Indicator — Rolling VWAP, Dual-Layer ATR Bands, Volume Exhaustion, RSI Gate & Confirmation Modes VWAP Sniper Reversal Pro identifies potential mean-reversion setups at statistical price extremes. It combines a rolling volume-weighted average price (VWAP) baseline, dual-layer ATR deviation bands, volume and wick exhaustion filters, and an RSI gate to confirm reversal signals on completed bars. Built for traders who want multi-factor confluence ra
Adaptive Swing Density Heat Map MT5 Structural Density Indicator — Swing Clustering, Participation Tracking, Acceptance vs Rejection & Color-Coded Heat Map Adaptive Swing Density Heat Map analyzes swing point density across price levels, then tracks how price actually interacts with each zone — measuring participation, acceptance, and rejection. The result is a heat map of structural zones, color-coded by density strength. Not all support and resistance levels are equal — this indicator quantif
Last Swing Volume Profile
Charles Mwangi Ndungu
Swing Volume Profile MT5 Swing Volume Profile Indicator — Auto Swing Detection, Volume Profile, Fibonacci Retracement & RSI Overlay in One Chart Tool Swing Volume Profile (SVP) automatically detects structural swings and displays a volume profile for the most recent completed swing — with Fibonacci retracement and RSI overlay. No manual range selection. No trendline required. The indicator finds the swings and builds the profile automatically. MT5 Native • No Repainting • Auto Swing Detection •
Consolidation Intelligence Pro MT5 Consolidation Indicator — Automatic Range Detection, 5-Tier Price-Density Heatmaps & Re-Entry Alerts Consolidation Intelligence Pro automatically identifies where price repeatedly overlaps and trades within a concentrated range — then renders that structure as a 5-tier price-density heatmap directly on your chart. No more manually drawing every consolidation box. The indicator analyzes historical price structure, measures candle overlap and body-to-wick charac
DONCHIAN MARKET & TREND INTELLIGENCE The Only Donchian Tool That Tells You WHY the Market Is Moving — Not Just Where Most Donchian indicators draw three lines and call it a day. You get an upper band. A middle band. A lower band. And when price pokes above the upper band, you're supposed to just... buy? That's not analysis. That's guessing with extra steps. THE PROBLEM EVERY DONCHIAN TRADER KNOWS You've seen it a hundred times. Price finally breaks above the 20-period high after days of compress
BOLLINGER MARKET & TREND INTELLIGENCE — MT5 STOP GUESSING WHAT A BOLLINGER BREAKOUT IS TELLING YOU You've been here before. It's 2 AM. You're staring at a chart. Price has just closed outside the upper Bollinger Band. You enter. Three candles later, price is back inside the band. Then the move reverses. You tell yourself: "I should have waited for a retest." But when you wait for the retest, sometimes price continues without giving you the entry you wanted. So you add another filter. RSI. Then M
VWAP Sniper Reversal Pro
Charles Mwangi Ndungu
VWAP Sniper Reversal Pro 是一款适用于 MetaTrader 5 的反转与回调分析指标,融合了成交量加权平均价(VWAP)、双层 ATR 波动通道、成交量衰竭异动以及 RSI 动能过滤,适用于外汇、黄金 (XAUUSD)、股指和加密货币交易。 专为剥头皮(Scalping)、日内交易和波段交易打造,当价格过度偏离公允价值时捕捉关键拐点,所有确认信号均在已收盘 K 线上严格计算,历史数据绝无重绘。 核心4重反转确认机制 该指标在发出信号前会严格验证四项独立的市场条件。首先,价格必须触及或穿透基于滚动 VWAP 或每日重置 VWAP 的内外侧 ATR 波动通道 。其次, 成交量异动过滤器 要求当前 Tick 成交量明显超越均线,确认极端位置存在强劲资金换手。 第三,K 线必须形成清晰的 阻击形态 (如明显的上下长影线或吞没形态)。第四,内置的 RSI 动能过滤器 有效防止逆势接飞刀,做多信号要求处于超卖区(RSI 低于 35),做空信号要求处于超买区(RSI 高于 65)。 信号执行流程与图表回测统计 系统采用清晰的两阶段信号流程:在未收盘 K 线上显示预警准备圆点
Super Trend and Consolidation Matrix 是一款适用于 MetaTrader 5 的市场结构与价格行为(Price Action)分析指标。它融合了 6 层自适应趋势带、波动挤压检测引擎、动态整理区间以及实时共振 HUD 仪表盘,适用于外汇、黄金 (XAUUSD) 和股指交易。 专为剥头皮(Scalping)、日内交易和波段交易设计,所有结构分析均在已收盘的 K 线上严格计算,历史数据绝无重绘。 核心市场结构引擎 该指标在主图上同步运行多层分析模型。 6层趋势带 与方向性 EMA 彩云实时监测结构排列、斜率动能以及早期趋势转换。内置的 波动挤压引擎 根据动态 ATR 识别行情收缩与爆发周期,而 空间整理引擎 可自动绘制动态支撑阻力位、日内微观密集区及宏观摆动区间。 内置的 交易形态跟踪系统 可监测突破、顺势回调和反转形态,并结合 4通道共振评分模型 (0–100%)、ADX 动能斜率及 VWAP 趋势偏向进行多重验证。实时交易指引与市场状态(Coil、Trend、Range、Expansion)即时呈现在图表 HUD 面板上。 交易周期与策略配置 通过单
Gold Prism
Charles Mwangi Ndungu
Gold Prism EA 是一款专门为 XAUUSD(黄金)设计的自动化多周期突破交易系统。该系统能够精准识别市场关键支撑位与阻力位,评估其结构重要性,并利用挂单捕获动能突破行情。 首发限时特惠: 为建立初始实盘交易记录并积累用户评价,前 5 份授权特价仅售 $199 美元。在前 5 份售罄后,价格将自动上调至 $499 美元,最终恢复至标准售价 $999 美元。建议交易者立即下载免费 Demo 版本并在策略测试器中进行历史回测,以便在前 5 份特惠名额满员前锁定优惠。 回测优先原则: 强烈建议交易者在购买前下载免费 Demo 版本,并在策略测试器中运行 3 至 5 年的历史数据回测。建议最低账户资金为 1,000 美元;低于 1,000 美元的账户将被视为高风险激进操作。建议对 EA 的实际表现进行至少 6 个月的长期观察,以跨越完整的市场周期。 真实回测数据披露: 基于 86,868 笔采用 0.01 固定手数的样本交易量化研究显示,系统共实现净利润 $110,704.13 美元,获利因子(Profit Factor)为 1.59,胜率为 77.22%。历史回测中记录的夏普比率(
筛选:
无评论
回复评论