RSI Multi Timeframe Dashboard
- Индикаторы
-
Hacene Harrous
 Я создаю понятные и честные индикаторы для MetaTrader 5. Я специализируюсь на мультитаймфреймовых панелях: они показывают одну идею (RSI, тренд, MACD, ADX, Стохастик, CCI или всю систему Ichimoku) сразу на нескольких таймфреймах одним взглядом, чтобы вы перестали переключать графики. Каждый
 - Версия: 1.23
- Обновлено: 27 августа 2026
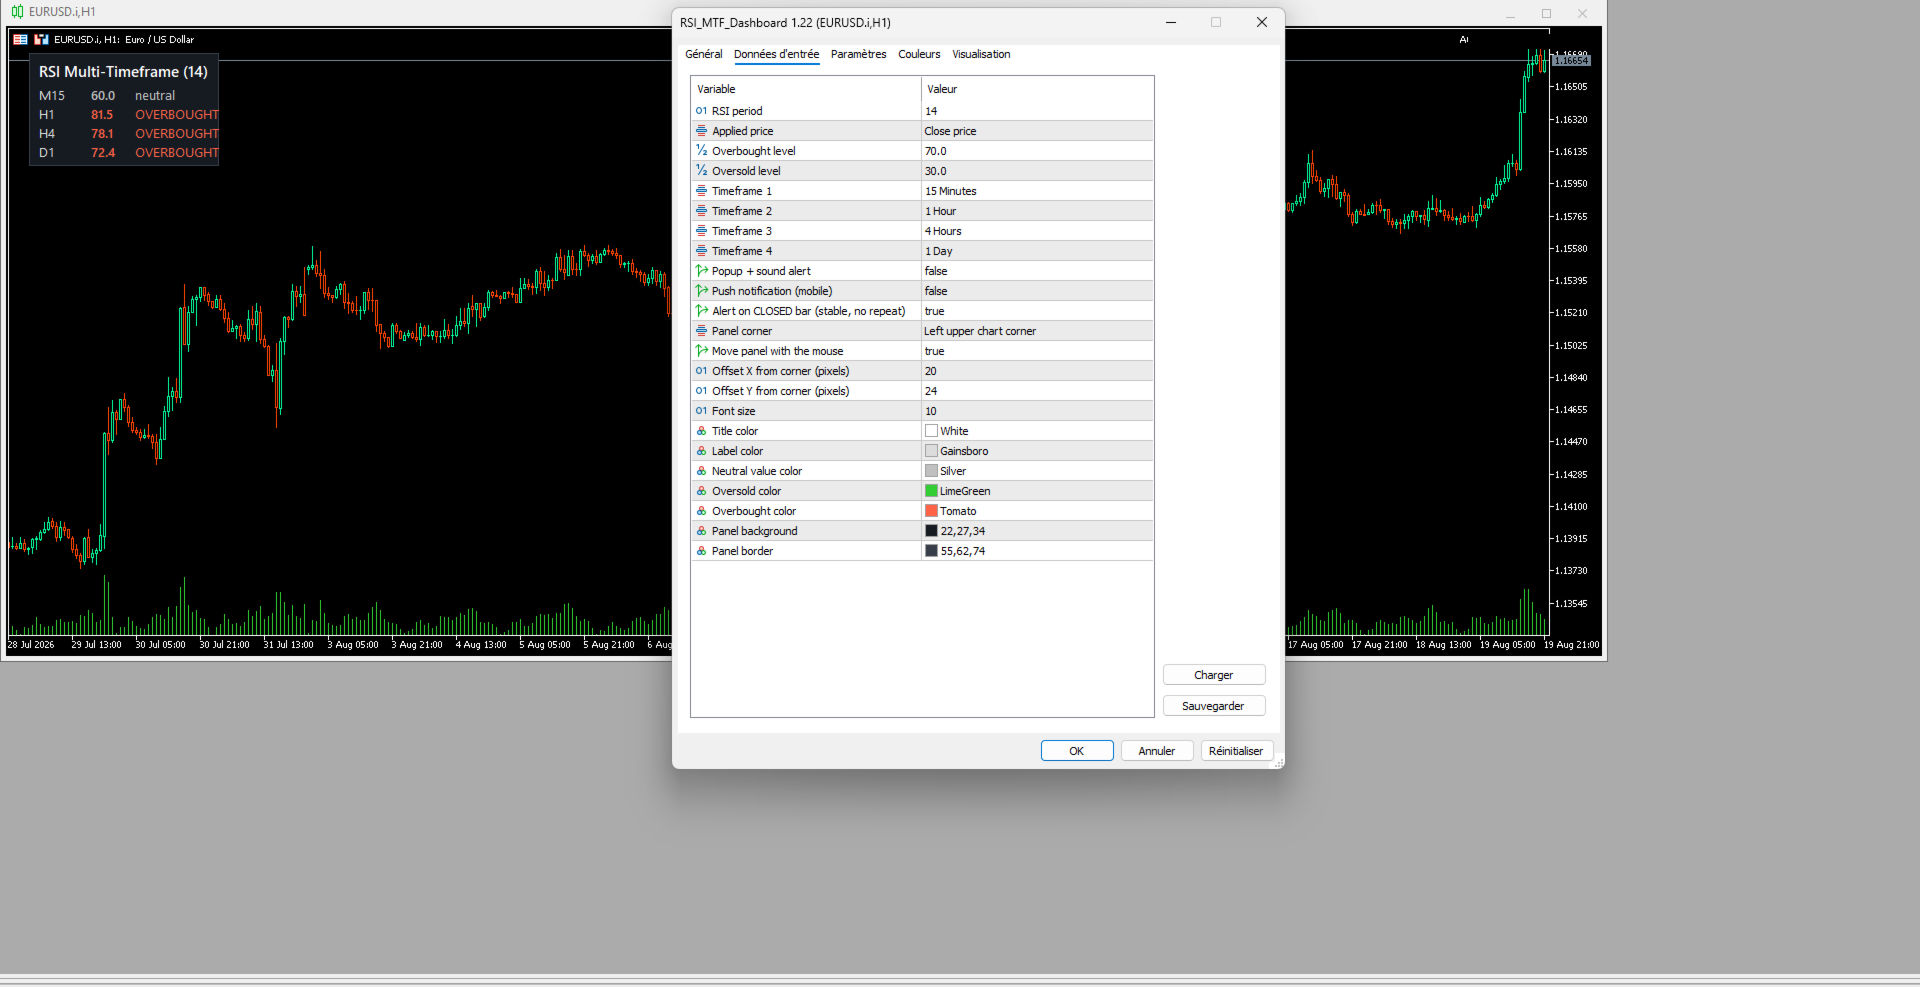
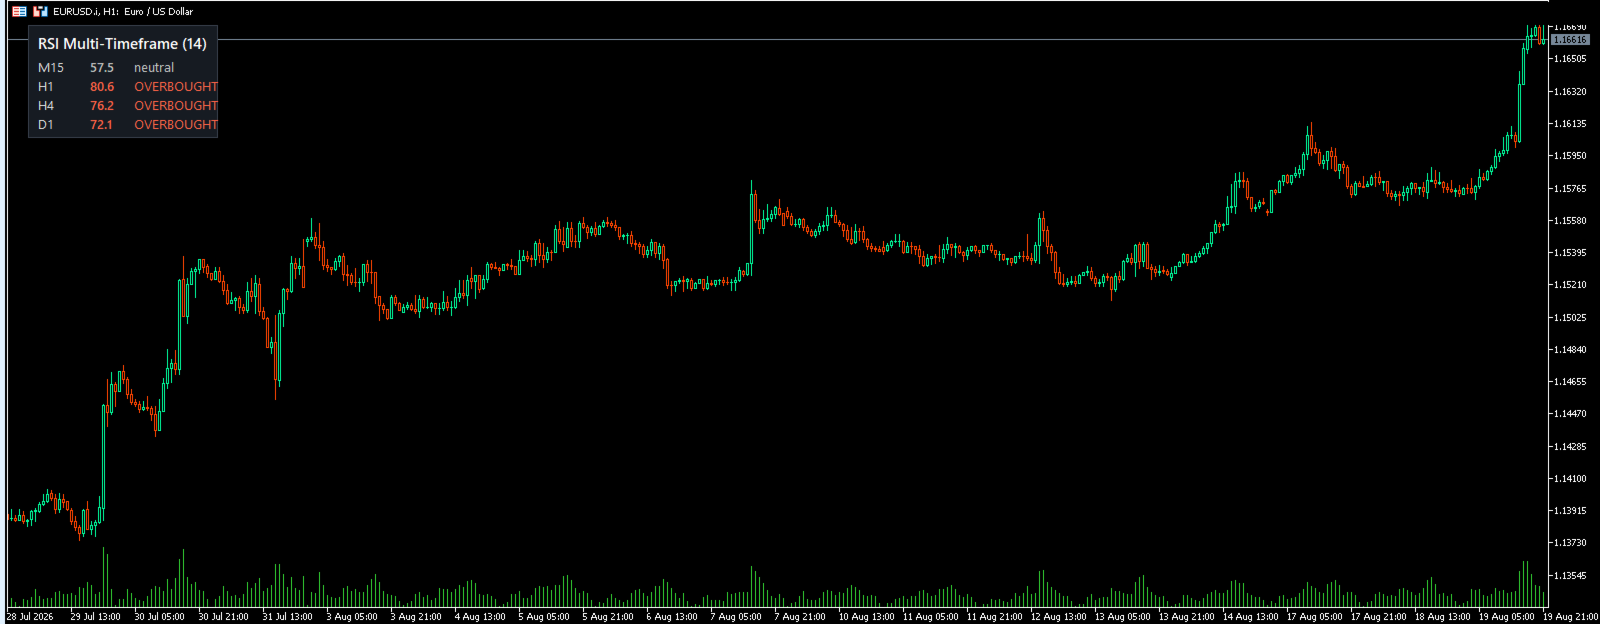
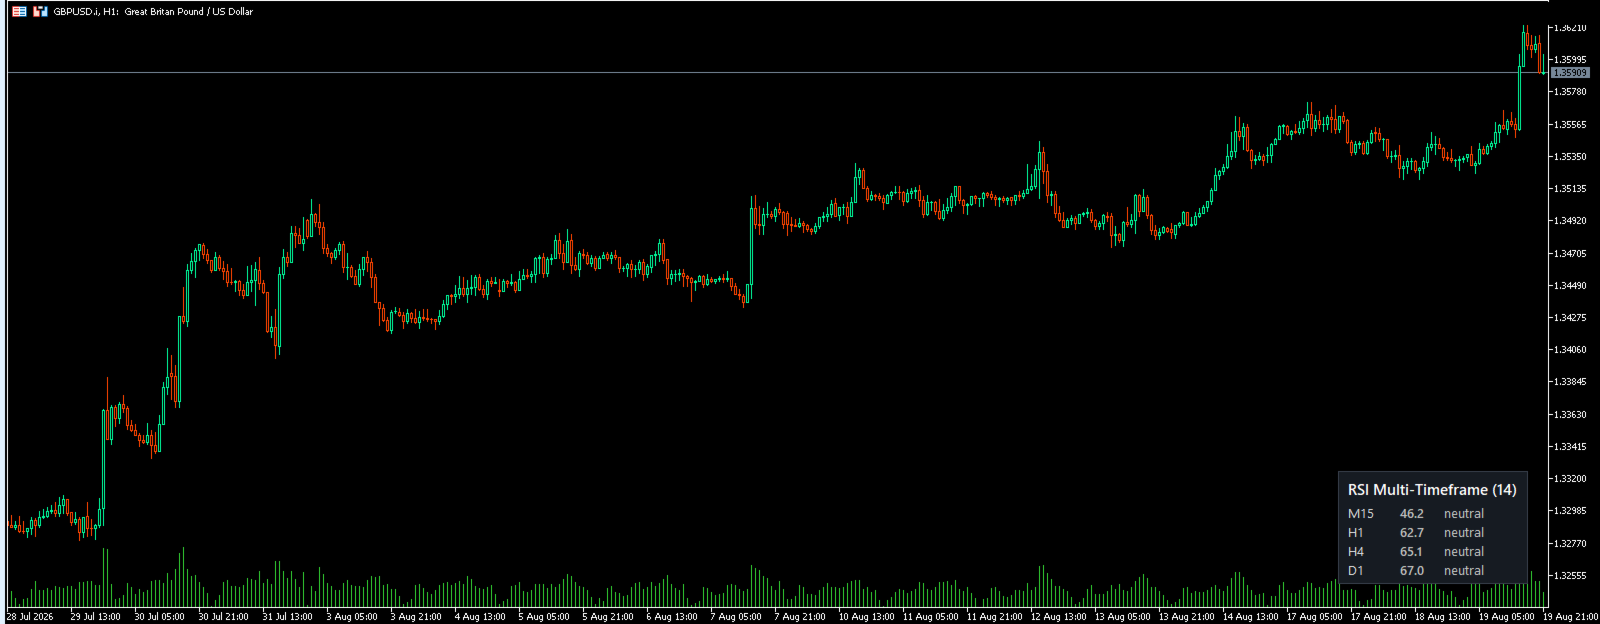
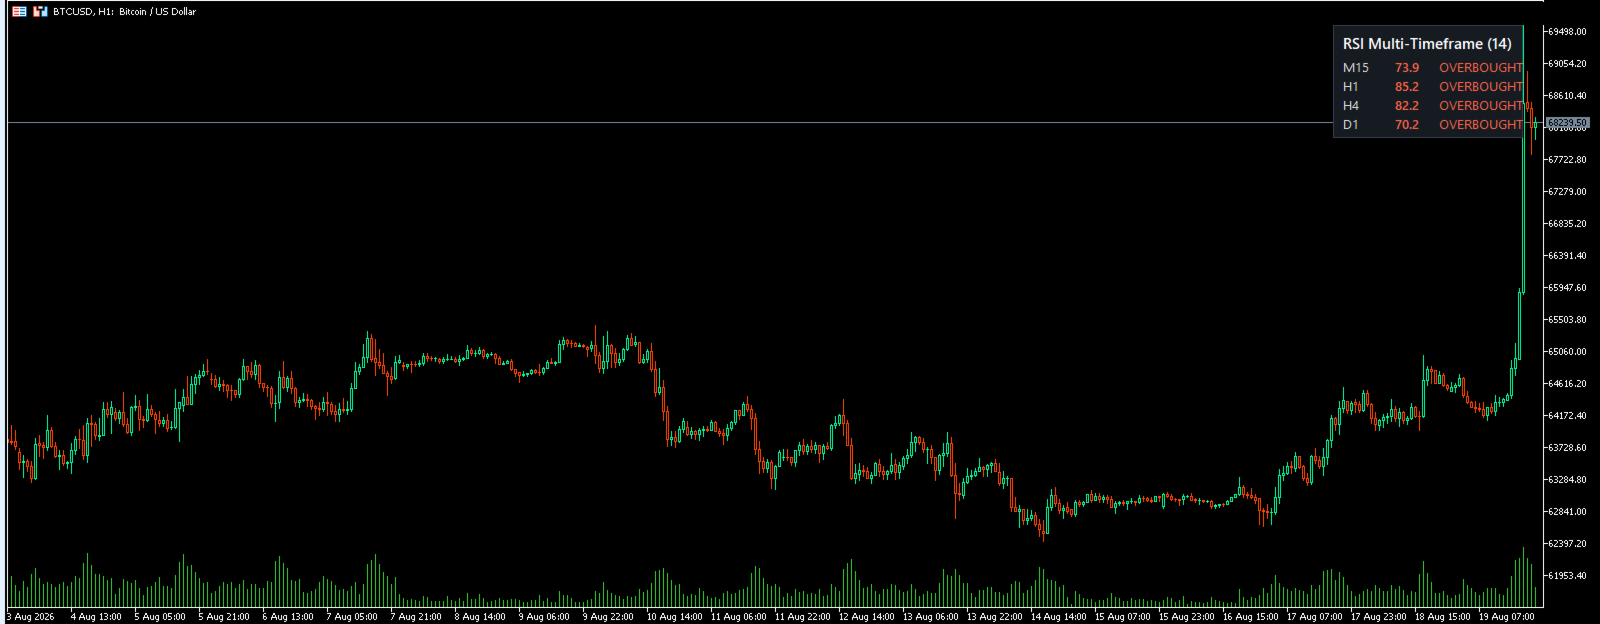
RSI Multi-Timeframe Dashboard shows the RSI of four timeframes at the same time, directly on your chart, so you can read momentum across the whole market at a glance instead of switching charts one by one. By default it displays the M15, H1, H4 and D1 timeframes, and every setting is configurable. Each timeframe is color coded so the current condition is easy to see, with red for overbought, green for oversold and grey for neutral. Alerts are based on the closed bar, which keeps them stable so they never repaint and never fire twice for the same event. The panel is movable: you can anchor it to any corner or drag it anywhere with the mouse, and it remembers its position. It works on any symbol and any chart timeframe and stays light on resources. This tool displays momentum and is not a signal system, so please trade with your own risk management. It is free to use, and a rating and a short review are genuinely appreciated. It is part of the laPanthere multi-timeframe suite, so you will find matching dashboards for other indicators on my profile.