QQE Mod Pro
- Индикаторы
- Версия: 1.10

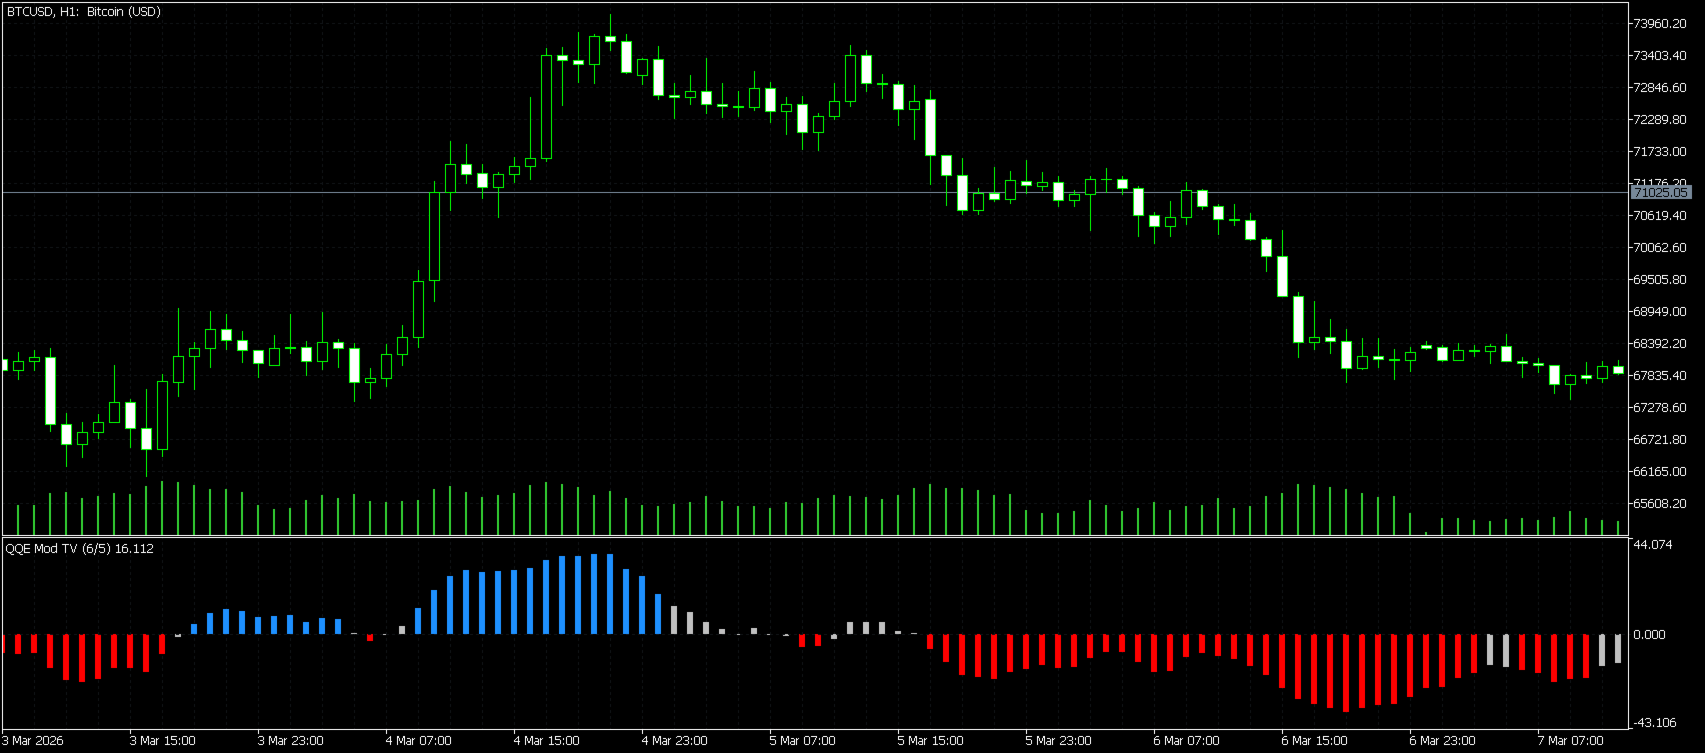
QQE Mod Pro (MT5) is a momentum indicator inspired by the well-known QQE Mod concept. It combines a fast histogram-based momentum view with a volatility filter, helping traders distinguish between bullish, bearish, and neutral market conditions more clearly.
This version includes two smoothing methods, allowing you to choose between the Original (TradingView-style) EMA logic and the more traditional Classic/Wilders logic, while keeping the original indicator behavior intact.
How the indicator works
QQE Mod Pro uses two QQE calculation chains:
- a Primary QQE that acts as the market filter
- a Secondary QQE that drives the signal histogram
The histogram reflects the secondary momentum component, while the primary component is used together with Bollinger Bands as a volatility filter.
This helps reduce weak signals and makes directional states easier to identify.
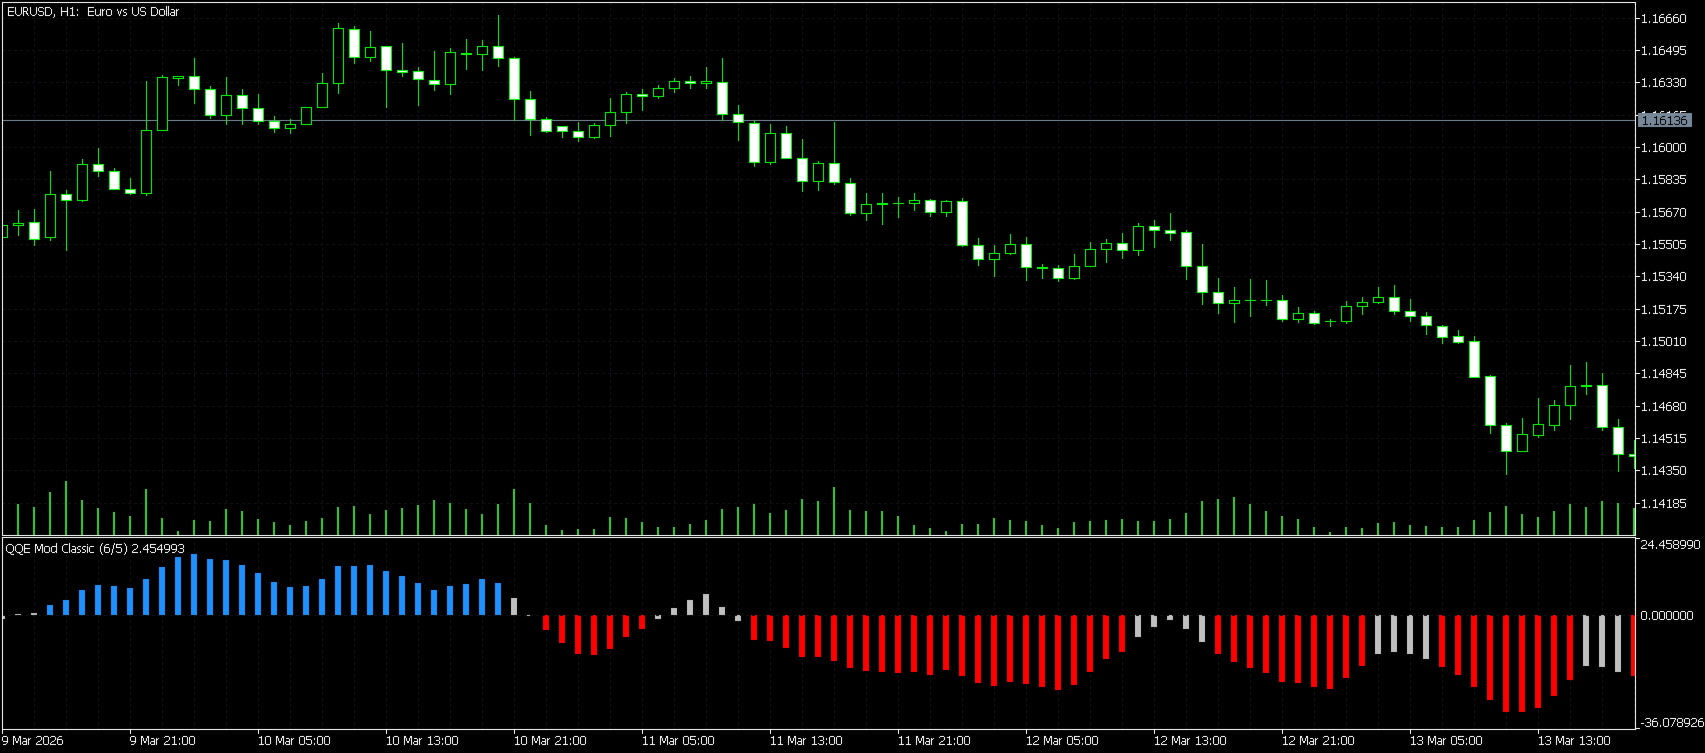
What the histogram colors mean
- Blue = bullish condition
- Red = bearish condition
- Gray = neutral / no clear directional confirmation
This makes the indicator easy to read at a glance, especially during fast market conditions.
Dual Smoothing Modes
1) Original TV EMA Mode
This mode uses EMA-style smoothing, similar to the popular TradingView implementations of QQE Mod.
In practice:
- reacts faster to momentum changes
- feels more responsive
- often preferred for scalping and fast intraday trading
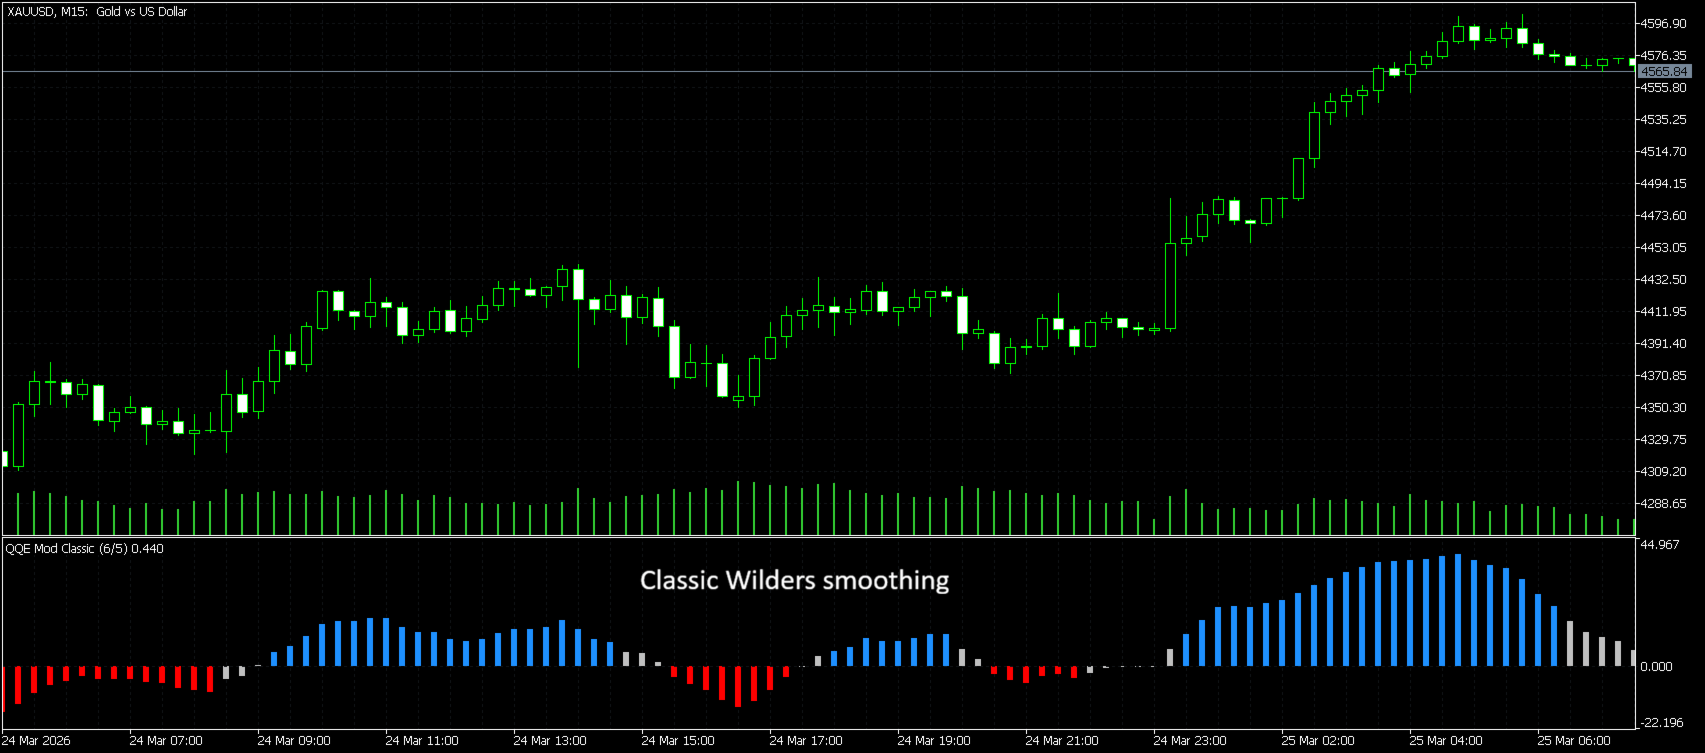
2) Classic / Wilders Mode
This mode uses Wilders-style smoothing, which is closer to the traditional QQE logic.
In practice:
- smoother and slightly slower
- reduces noise compared to the EMA version
- often preferred for traders who want more stability and fewer rapid flips
Which mode should I use?
- Use Original TV EMA if you want a faster and more aggressive response
- Use Classic/Wilders if you prefer smoother momentum transitions
Both modes keep the same indicator concept, but the feel and responsiveness are different.
Main Features
- QQE Mod style histogram
- Dual smoothing logic:
- Original TV EMA
- Classic / Wilders
- Clear bullish / bearish / neutral visualization
- Volatility filter using Bollinger Bands
- Zero-line cross alerts
- alert when histogram crosses above 0
- alert when histogram crosses below 0
- Alert delivery options:
- Popup
- Sound
- Push notification
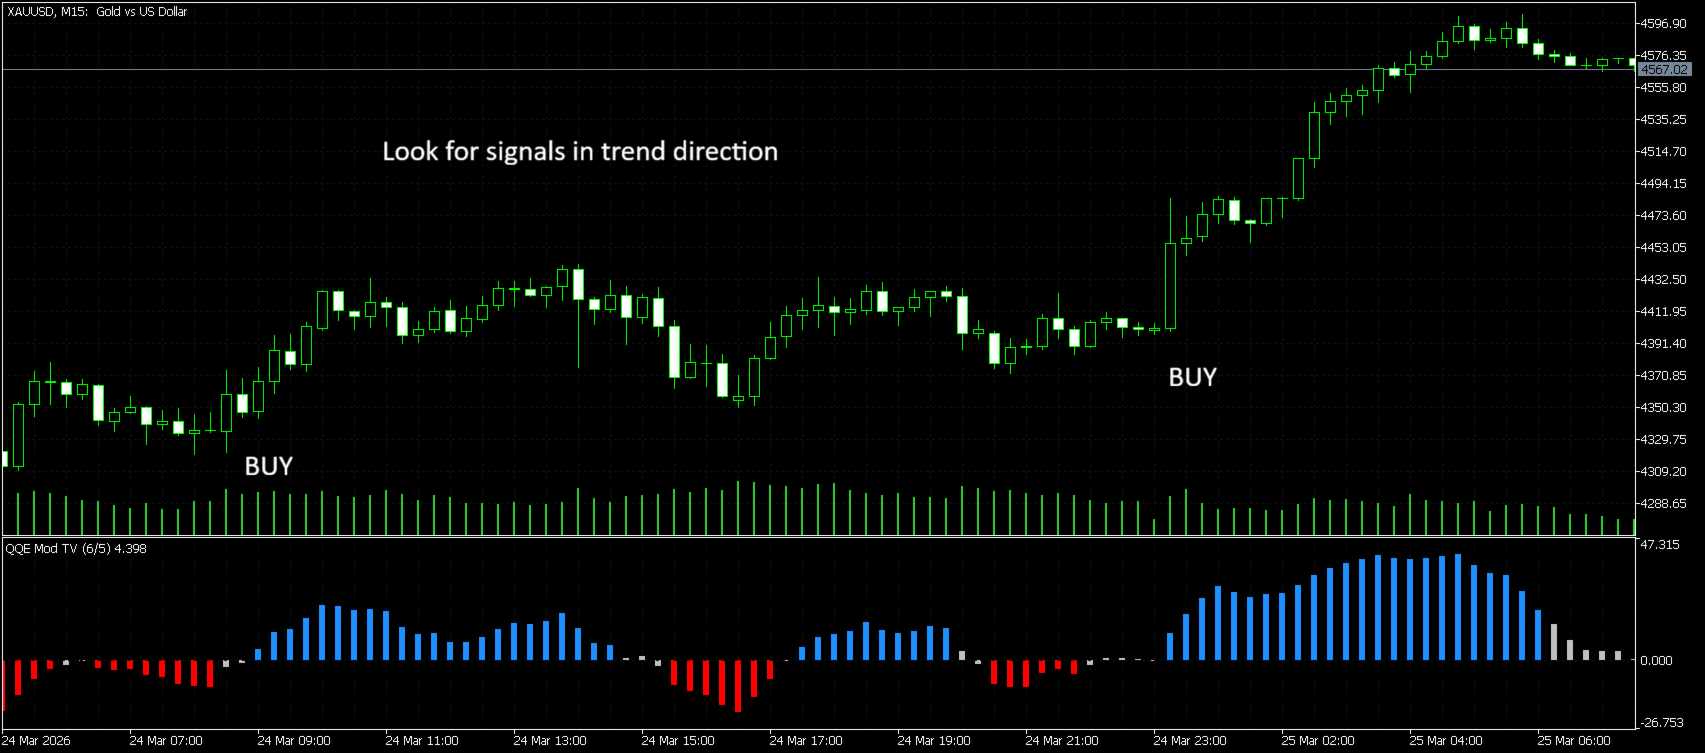
How to use it
A simple workflow:
- Watch the histogram color and position around the zero line.
- A move above the zero line may indicate strengthening bullish momentum.
- A move below the zero line may indicate strengthening bearish momentum.
- Use the color state for additional confirmation:
- blue = bullish condition
- red = bearish condition
- gray = neutral / unclear momentum
- For best results, combine the indicator with:
- higher timeframe bias
- support/resistance
- trend filters
- market structure
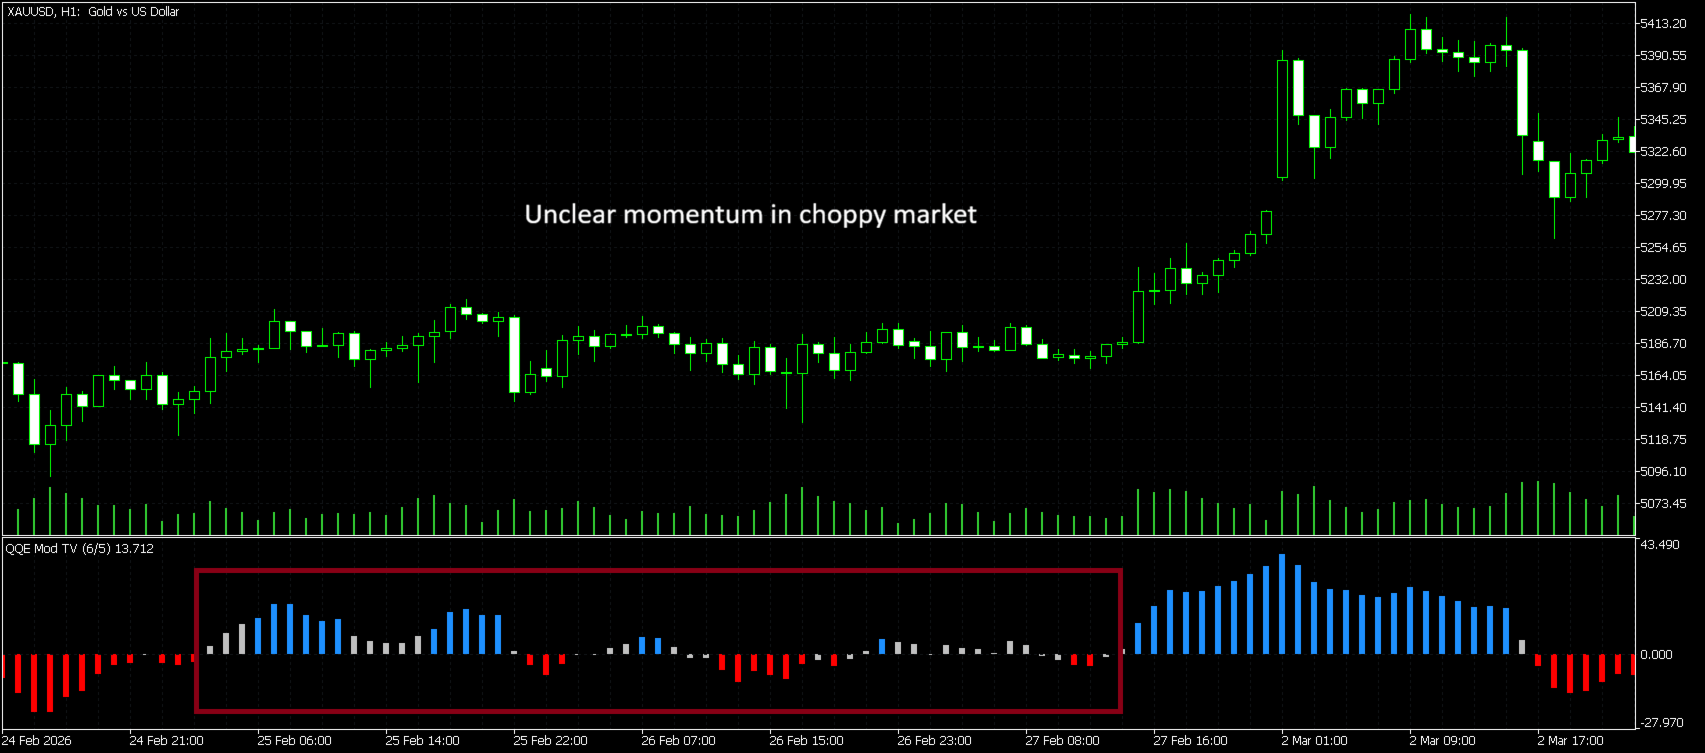
Best market conditions
QQE Mod Pro works best in directional markets and momentum phases.
In choppy / sideways markets, the histogram can move around the zero line more often, which may lead to more frequent transitions. For this reason, the indicator is often most effective when combined with:
- a trend filter
- higher timeframe direction
- key price levels or structure
Recommended timeframes
The indicator can be used on many markets and timeframes, but generally:
- M5 / M15: faster momentum reading, suitable for scalping
- M30 / H1: balanced use for intraday trading
- H4 / D1: smoother signals, better for swing-style analysis
If you want a faster feel, Original TV EMA mode is usually the better choice.
If you want a smoother feel, Classic/Wilders is often better.
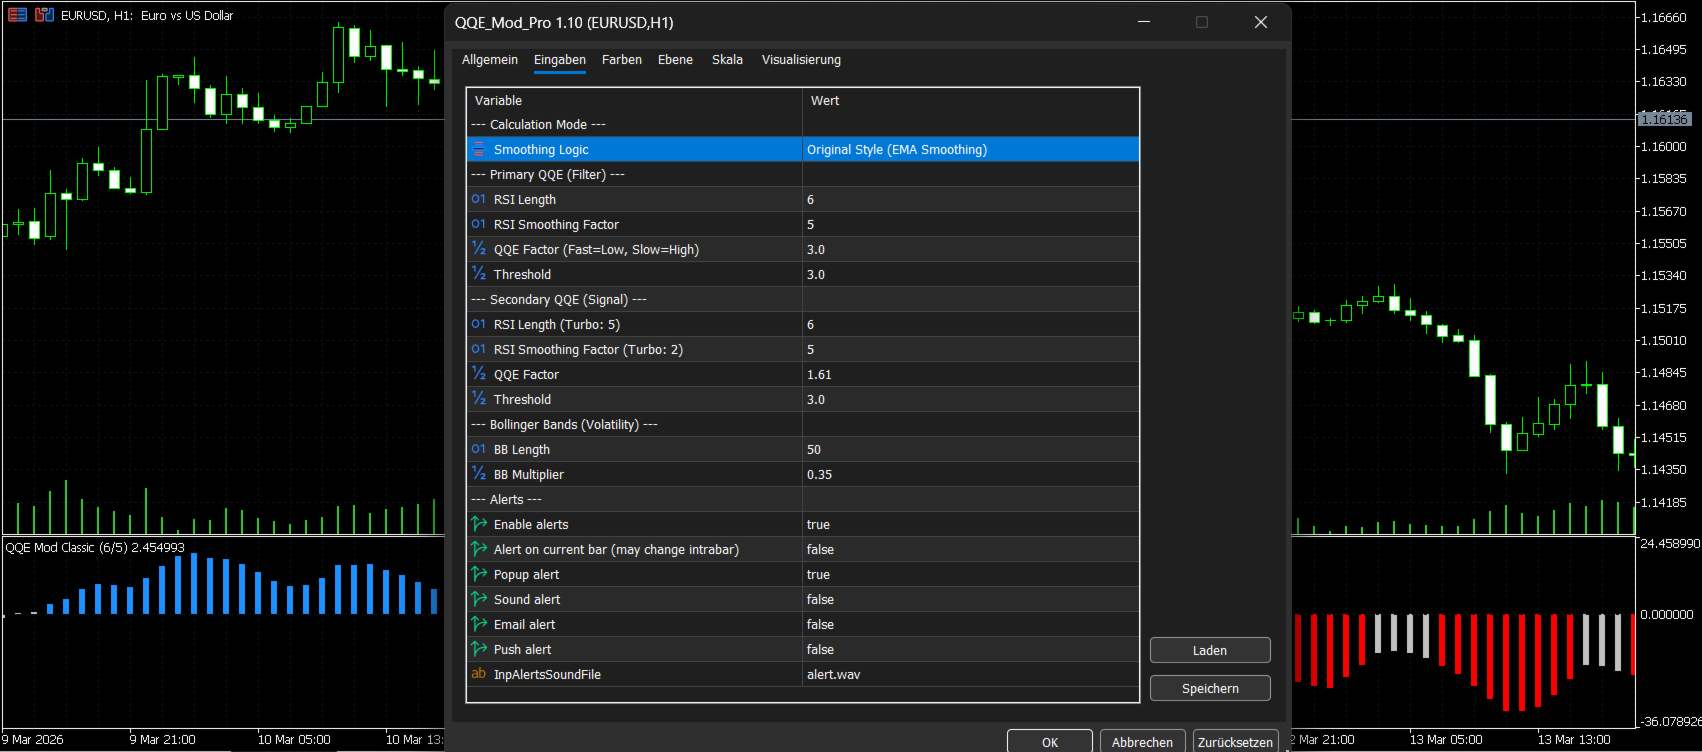
Inputs Overview
Calculation Mode
- Original EMA = faster, more reactive smoothing
- Classic = smoother, more traditional Wilders-style smoothing
Primary QQE
The primary QQE acts as the market filter.
Secondary QQE
The secondary QQE drives the signal histogram.
Bollinger Bands
Used as a volatility filter for the primary component.
Alerts
You can enable alerts when the histogram crosses:
- above the zero line
- below the zero line
Optional delivery:
- popup
- sound
- push
Alert Logic
This version includes alerts when the histogram:
- crosses above 0 → potential bullish momentum shift
- crosses below 0 → potential bearish momentum shift
You can choose whether alerts should trigger:
- on the current bar (faster, but may change intrabar)
- or on the confirmed bar (more stable)
Important note
This indicator is designed as an analysis and signal-support tool.
It should not be used as financial advice and should always be tested on a demo account first.
Support & Feedback
If you find this indicator useful, a short review really helps and supports future updates. Thank you!
Support: edgelanetrading@gmail.com
Copyright: Edgelanetrading – Tolga Özdiler
FAQ
Does it repaint?
The indicator logic itself is unchanged.
If you use alerts on the current bar, values can still change while the candle is forming.
For more stable alerts, use confirmed bar alerts.
What is the difference between Original (TV) EMA and Classic?
- Original EMA = faster and more responsive
- Classic / Wilders = smoother and more stable
Which markets can I use it on?
It can be used on Forex, Gold, Indices, Crypto, and other MT5 symbols.
Is it good for scalping?
Yes — especially in Original TV EMA mode, because it reacts faster to momentum changes.
Is it only for scalping?
No. It can also be used on higher timeframes for cleaner directional analysis.