Swiss VWAPsimple

4.8

Swiss VWAPsimple

Motivation

Did not find free VWAP that works, the one that I found craseh. So I created a VWAP which calculates values only for the actual day. So computer resouces are not over stressed.


What is VWAP, how is it used? 

VWAP stands for Volume Weighed Average Price, it calculates the running sum of tick volume and the runnung sum of price times tickvolume. The division of these sums result in a weighed price (Sum P*V/Sum V). The calculation starts normally at midnight. The values are strongly dependent from the starting time. Be careful if you have assets not starting at midnight. Also the calculation gets more and more unprecise during the day because the sums get bigger and bigger during the day and errors add.

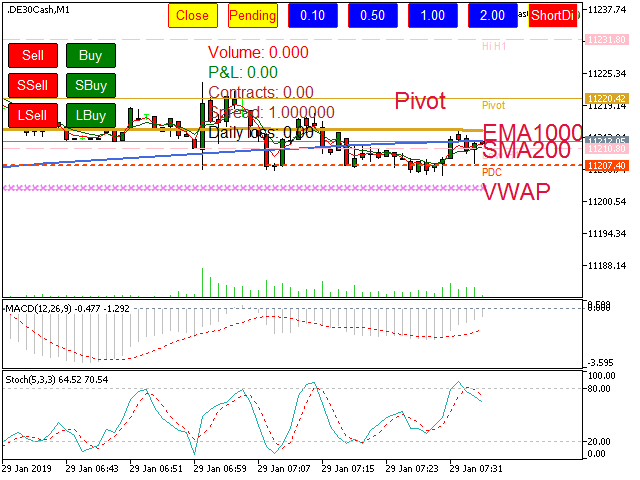
VWAP is a sort of equilibrium price. It might divide the day in a long and short bias zone. I recommend to use Pivot Points, SMA200 and EMA1000 in addition to establish a daily bias dividing line. So if you have your long and short zone only trade long in the long zone and vice versa. You might go short in a long zone but the price must have a reasonable distance from the daily bias border line or the VWAP.

VWAP shows you, too, if you are in a sideways phase if price is near VWAP (and SMA200, SMA1000, Pivot Point).

Principle:


Extended long zone, beware of bull traps

................................................

Long zone, no shorts

-----------------------------------------------  VVAP

Short zone, no longs

................................................

Extended short zone, beware of bear traps


Inputs


useBarsSinceMidnight => Normal use set it to true, with closed markets you have to set it > Start point of VWAP (number of bars back) if useBarsSinceMidnight ist false

Show comment => show comment which shows distance to vwap

Comment says that you might go short in a long area => Comment tells you that you might go short in a long situation

Comment says that youmigt go long in a short area => Comment tells you that you might go short in a short situation

let the Indicator talk, vwap cross => When price crosses vwap it says  "vwap cross"

Defines warning range, too much warnings make it smaller => Tuning of the warning, set it smaller for currencies, when Vwap-Distance to price is zero, the warning comes

inpArrowCode => Wingdings font code of Mt5, cross is code 251

inpShowDistanceLabel => Show distance Ask-VWAP by label

XDISTANCE => Dstance for label X-direction

YDISTANCE => Distance for label Y-direction

inpFontSize => Fontsize for label

inpVwapText1 bis 4 => Texts for label

Timeframe

Use M1 to H1. VWAP should be invariant to timeframes. But because of rounding errors it is never exact the same in various timeframes.


Отзывы 6
Isabella
77
Isabella 2024.04.17 11:56 
 

sehr nützlich zB für daily Entscheidung, aber auch kurzfristig sinnvoll

Swisstomek
51
Swisstomek 2020.11.27 15:09 
 

super Filter / Indikator. Kann ich nur empfehlen. Genauso kann ich auch den "important Lines" Indikator empfehlen.

contraror
77
contraror 2020.08.06 09:31 
 

Good work! The comments are useful reminders not to trade on the wrong side.

Рекомендуем также
VWAP Diaria
Samuel De Souza Ferreira
Daily VWAP — Institutional Reference for Intraday Value The Daily VWAP is a professional indicator based on the Volume-Weighted Average Price (VWAP) , designed to reveal the true balance between price and volume throughout the trading session. Unlike traditional moving averages, the Daily VWAP incorporates the weight of traded volume in every price movement, providing a much more accurate reference to the behavior of institutional traders and large market participants. What the indicator deliver
FREE
Утилита рисует уровни разворота по формулам для каждой из выбранного количества свечей: Pivot = (high + close + low)/ 3 R1 = ( 2 * Pivot) - low S1 = ( 2 * Pivot) - high R2 = Pivot + (R1 -S1) R3 = high + ( 2 * (Pivot - low)) S2 = Pivot - (R1 - S1) S3 = low - ( 2 *(high - Pivot)) H = high L = low U = если свеча бычья, то close. Иначе - open D = если свеча бычья, то open. Иначе - close На любом таймфреме. После закрытия новой свечи на расчетном таймфрейме уровни последнего дня удаляются.  То есть,
FREE
English VWAP Daily (Clean) is a simple and lightweight indicator that plots the classic Daily VWAP (Volume Weighted Average Price) directly on your MT5 chart. Features: Classic Daily VWAP calculation Supports real volume (if available) or tick volume Timezone offset option to match your broker’s server time Weekend merge option (merge Saturday/Sunday data into Friday) Clean version → no arrows, no alerts, only VWAP line VWAP is widely used by institutional traders to identify fair value, su
FREE
Volume Weighted Average Price or VWAP is an indicator wich shows different average prices on chart. This is very useful to find strong negotiation price areas and as trend following. Configurations: Day, Week and Month - Show different VWAPs according to the period. You can change each line style on "colors" tab. Any doubt or suggestion please contact us. Enjoy! This is a free indicator, but it took hours to develop. If you want to pay me a coffee, I appreciate a lot   <3 PayPal, Skrill, Nete
FREE
Each VolumeProfile holds: The price range for a given period Buy/sell volume for each price level Calculated POC, VAH, VAL, Delta, and Imbalance Indicator Logic Summary Divide data by timeframe (e.g., one H1 profile per hour). Aggregate volumes for each price level. Separate buy and sell volumes using tick or trade direction. Compute Delta (Buy − Sell) and Imbalance (dominance ≥70%). Detect POC, VAH, VAL to outline the Value Area. Draw graphical profiles beside price candles using color-co
Поддержка и Сопротивление Предыдущего Дня Платформа: MetaTrader 5 Тип: Пользовательский индикатор Отображение: Окно графика (наложение) Функции: Вычисляет уровни поддержки и сопротивления на основе экстремумов предыдущего дня. Использует скользящее окно ( SampleWindowSize ) для анализа локального диапазона цен. Определяет зону поддержки , если текущая волатильность значительно ниже предыдущих максимумов. Определяет зону сопротивления , если цена торгуется выше предыдущих минимумов. Отображает 4
FREE
VWAP and MVWAP
Flavio Javier Jarabeck
3.88 (8)
Volume Weighted Average Price (VWAP) is a trading benchmark commonly used by Big Players that gives the average price a Symbol has traded throughout the day. It is based on both Volume and price. Additionally we put in this indicator the MVWAP (Moving Volume Weighted Average Price). For those who do not know the usage and the importance od this indicator I recommend a great article about this subject at Investopedia ( https://www.investopedia.com/articles/trading/11/trading-with-vwap-mvwap.asp )
FREE
VWAP Indicator
LUC JACOBUS A VERHEECKE
4.08 (26)
Volume Weighted Average Price (VWAP) The volume weighted average price (VWAP) is a  trading   benchmark  used by traders that gives the average price a security has traded at throughout the day, based on both volume and price. It is important because it provides traders with insight into both the trend and value of a security. This indicator VWAP V2 is free and is the manual version of the extended Easy VWAP indicator (30 Euro), where the date and time properties are automatically entered. With
FREE
Simple Vwap with the daily, weekly and monthly VWAP is the abbreviation for   volume-weighted average price , which is a technical analysis tool that shows the ratio of an asset's price to its total trade volume. It provides traders and investors with a measure of the average price at which a stock is traded over a given period of time. How it's used Identify entry and exit points:   Traders can use VWAP to determine when to buy or sell an asset.   Understand price trends :  Traders can use V
FREE
MIDAS Super VWAP
Flavio Javier Jarabeck
4.27 (11)
Imagine VWAP, MVWAP and MIDAS in one place... Well, you found it! Now you can track the movement of Big Players in various ways, as they in general pursue the benchmarks related to this measuring, gauging if they had good execution or poor execution on their orders. Traders and analysts use the VWAP to eliminate the noise that occurs throughout the day, so they can measure what prices buyers and sellers are really trading. VWAP gives traders insight into how a stock trades for that day and deter
FREE
White Weis Volume Ticks
Ricardo Almeida Branco
5 (4)
White Weis Volume This indicator shows the sum of the volume in each wave, bulish or bearish, as idealized by David Weis , but it brings an important addition , which is the marking of the bar with the highest volume of the wave (White Bar)! In coding the indicator, it was sought to optimize the code to require minimal processing during use and not to overload mt5. The indicator can be used for pre-trading analysis and study, where the trader analyzes possible points of support and resistance
Tick Database — экспорт тиковой базы из терминала MT5 в MT4. Утилита помогает получить доступ к тиковой базе в реальном времени. Это нужно для генерации синтетических графиков в терминале MT4, в котором изначально не предусмотрена загрузка тиковой базы. Например, можно организовать постоянный доступ к тиковой базе для утилиты Seconds Chart . Если время открытия текущей свечи в терминалах отличается, то нужно указать смещение времени в часах. Пример Открываем в обоих терминалах графики M1. В терм
FREE
Stackable VWAP
Flavio Javier Jarabeck
3.5 (4)
Volume Weighted Average Price (VWAP) is a trading benchmark commonly used by Big Players that gives the average price a Symbol has traded throughout the day. It is based on both Volume and price. Additionally we put in this indicator the MVWAP (Moving Volume Weighted Average Price). For those who do not know the usage and the importance od this indicator I recommend a great article about this subject at Investopedia ( https://www.investopedia.com/articles/trading/11/trading-with-vwap-mvwap.asp
FREE
VWAP Level MT5
Francesco Lenza
4.5 (2)
The VWAP Level indicator is a technical analysis tool that calculates the weighted average price for the traded volumes of a specific asset. The VWAP provides traders and investors with the average price of an asset over a specific time frame. It is commonly used by investors to compare data on "passive" trading operations, such as pension funds and mutual funds, but also by traders who want to check if an asset has been bought or sold at a good market price. To calculate the VWAP level we us
FREE
Wave Box Market Frenquency
Jean Jacques Huve Ribeiro
4.75 (4)
Totally linked to the result of a movement and the duration he had. Its height records how many ticks the asset walked during a given movement, its width shows us the duration that movement had. Its configuration must be in line with the Weis Wave Indicator configuration to observe the movement force and can indicate a possible accumulation or distribution of the movement;
FREE
Volume Statistic
Syamsurizal Dimjati
5 (1)
Ritz Volume Statistic – Color Volume Histogram & Market Flow Insight Ritz Volume Statistic is a clean and powerful volume analysis indicator designed to visualize bullish and bearish market pressure through a dynamic color-graded volume histogram . The indicator transforms raw tick volume into an intuitive color spectrum , allowing traders to instantly identify volume expansion, exhaustion, and dominance shifts between buyers and sellers. A built-in statistical panel summarizes total volume, bul
FREE
VWAP Original MT5
Do Kim Dang Khoi
4.67 (3)
If you love this indicator, please leave a positive rating and comment, it will be a source of motivation to help me create more products <3 Key Takeaways VWAP is a trading benchmark that typically is most useful to short-term traders. VWAP is used in different ways by traders  . Traders may use it as   a trend confirmation tool   and build trading rules around it. Also, If prices below VWAP and move above it, c an be used by traders as a sell signal. If prices above VWAP and move below it,  ca
FREE
Midas VWAP
Paulo Henrique Faquineli Garcia
4 (2)
Volume Weighted Average Price (VWAP) is a trading benchmark commonly used by Big Players that gives the average price a Symbol has traded throughout the day. It is based on both Volume and price. This indicator contains Daily VWAP and MIDAS' VWAP, which means you are able to anchor the beggining of MIDAS' calculations and, therefore you will be able to use this methodology to study price versus volume moves after anchor point. You will be able to anchor up to 3 HIGH MIDAS VWAP's and 3 LOW. Wish
FREE
Important Lines
Terence Gronowski
4.88 (24)
Индикатор отображает линии пивот, уровни максимума, минимума и закрытия предыдущего дня, а также минимум и максимум предыдущего часа. Нужно просто установить этот индикатор на график, чтобы отобразить все эти важные линии, нет необходимости настраивать множество отдельных индикаторов. Почему важны определенные линии Максимум и минимум предыдущего дня : эти уровни используются для торговли на дневном графике. Очень часто, если цена становится выше или ниже минимума/максимума предыдущего дня, про
FREE
Remaining Time
Dhokiyas Money Map Investment Consultants - FZCO
"Оставшееся время свечи" для MetaTrader 5 "Больше никогда не пропускайте закрытие свечи. Торгуйте с идеальной точностью." Официальный канал обновлений Присоединиться : Dhokiyas Поддержка Написать напрямую : Contact "Оставшееся время свечи — Точный таймер для MT5" "Оставшееся время свечи" — это легкий и точный инструмент для MT5, который в реальном времени показывает точное оставшееся время текущей свечи. Создан для трейдеров, которые ждут подтверждения закрытия свечи и хотят максимально то
FREE
This indicator is stand alone version from  MP Pivot Levels  (All in one) containing Demark's Pivots. Calculations:     PP = X / 4     R1 = X / 2 - LOWprev     S1 = X / 2 - HIGHprev Uses: When the pair currency price may change the direction of movement. Possible constraints of support and resistance that creates plateaus for the currency pair prices. Tendency identification by comparing the present prices according to current day's pivot point and also the prior day's pivot points. ____________
FREE
Raymond Cloudy Day Indicator for MT5 – Pivot-Based Reversal and Trend Levels Raymond Cloudy Day Indicator is a pivot-based level indicator for MetaTrader 5 (MT5). It was developed by Ngo The Hung based on Raymond’s original idea and is designed to give a structured view of potential reversal zones, trend extensions and support/resistance levels directly on the chart. The default settings are optimised for XAUUSD on the H1 timeframe, but the indicator can be tested and adjusted for other symbols
FREE
Indicador Regressão Linear – Par de Ativos - INTRADAY Indicador é um oscilador que faz o plot do Resíduo resultado da regressão linear entre os dois ativos inseridos como input do indicador, representado pela fórmula: Y = aX + b + R Onde Y é o valor do ativo dependente, X é o valor do ativo independente, a é a inclinação da reta entre os dois ativos, b é a intersecção da reta e R é o resíduo. O resíduo representa a quantidade da variabilidade que Y que o modelo ajustado não consegue explicar. E
FREE
Общее Описание Индикатор Fair Gap Value выявляет и подсвечивает «пробелы справедливой стоимости» на графике MetaTrader 5. Fair gap возникает, когда между минимумом одной свечи и максимумом другой свечи, разделённых одной промежуточной, образуется ценовой разрыв. Индикатор рисует цветные прямоугольники (бычьи и медвежьи), чтобы выделить эти зоны и обеспечить наглядную поддержку стратегий, основанных на ценовом действии. Ключевые Особенности Обнаружение бычьих gap : выделяет разрывы между минимумо
FREE
This indicators automatically draws the   support and resistances   levels (key levels) for you once you've dropped it on a chart. It reduces the hustle of drawing and redrawing these levels every time you analyse prices on a chart. With it, all you have to do is drop it on a chart, adjust the settings to your liking and let the indicator do the rest. But wait, it gets better; the indicator is absolutely free! For more information:  https://youtu.be/rTxbPOBu3nY For more free stuff visit:  https:
FREE
Waves Sizer
Flavio Javier Jarabeck
3.86 (7)
Wyckoff fans, enjoy! Ideally to be used with the Weis Waves indicator, but it can be easily used alone, the Waves Sizer puts the range (in resulting Price movement) done by the Price on its market swings. You can control how accurate or loose will be the swings. This tool is very helpful for visually know how much the Price has traveled in your Timeframe. This way you can confront this level of effort with the resulting Volume, etc... Weis Waves indicator: https://www.mql5.com/en/market/produc
FREE
MW Volume
Martin Bittencourt
3.8 (5)
The Martinware Volume indicator plots a colored moving average over volume bars. The coloring uses three colors and can be done in different ways choosable by the user and is applied both to the average as to the volume bars. Three types of coloring are possible: None: no coloring is done Increasing or decreasing: changes the color depending on the current value being bigger or lesser than the previous one Volume relative to average: colors vary if the current volume is bigger or lesser then
FREE
## HiddenGapVolume Indicator Overview **HiddenGapVolume** is a sophisticated MetaTrader 5 technical indicator designed to detect hidden market gaps and volume anomalies through statistical analysis. It combines rolling volume averages with dynamic color-coded visualization to identify potential trading opportunities. ### Core Features - **Statistical Volume Analysis**: Calculates moving average and standard deviation bands around volume - **Dynamic Color Coding**: 6-color histogram signaling
FREE
Vwap Freeze
Ricardo Almeida Branco
5 (1)
The previous day's vwap is used by some traders as a support and resistance point, after all it is one of the ways to consider the fair price of that asset or that pair the day before. Possible defenses can occur in this region indicating a reversal, or triggering stops starting a new, more directional movement. It is a matter of analyzing how it will add to your operational. To avoid manually drawing the previous day's vwaps and saving time for your analysis, use the Vwap Freeze indicator, as
Pivot eXtreme Pivot adalah level referensi penting yang digunakan trader untuk memetakan potensi support & resistance intraday maupun jangka lebih panjang. Dalam sistem ini, level pivot dikembangkan menjadi P (Pivot Point utama) , R1–R13 (Resistance) , serta S1–S13 (Support) . Pivot Point (P) Titik pusat utama, dihitung dari rata-rata harga (High + Low + Close) / 3 . Berfungsi sebagai acuan keseimbangan harga : Jika harga di atas P → tren cenderung bullish. Jika harga di bawah P → tren cenderung
FREE
С этим продуктом покупают
SuperScalp Pro
Van Minh Nguyen
5 (14)
SuperScalp Pro – Продвинутая система скальпингового индикатора с множеством фильтров SuperScalp Pro — это продвинутая система скальпингового индикатора, объединяющая классический Supertrend и множество интеллектуальных подтверждающих фильтров. Индикатор эффективно работает на всех таймфреймах от M1 до H4 и особенно подходит для XAUUSD, BTCUSD и основных валютных пар. Может использоваться как самостоятельная система или гибко интегрироваться в существующие торговые стратегии. Индикатор включает б
Azimuth Pro
Ottaviano De Cicco
5 (6)
АКЦИЯ НА ЗАПУСК Цена Azimuth Pro установлена на уровне 299$ для первых 100 покупателей. Финальная цена составит 499 $ . РАЗНИЦА МЕЖДУ РОЗНИЧНЫМИ И ИНСТИТУЦИОНАЛЬНЫМИ ВХОДАМИ — НЕ В ИНДИКАТОРЕ, А В МЕСТОПОЛОЖЕНИИ. Большинство трейдеров входят на произвольных ценовых уровнях, гонясь за импульсом или реагируя на запаздывающие сигналы. Институциональные игроки ждут, пока цена достигнет структурных уровней, где спрос и предложение действительно меняются. Azimuth Pro автоматически определяет эти у
Каждый покупатель этого индикатора получает дополнительно Бесплатно: Авторскую утилиту "Bomber Utility", которая автоматически сопровождает каждю торговую операцию, устанавливает уровни Стоп Лосс и Тейк профит и закрывает сделки согласно правилам этой стратегии, Сет-файлы для настройки этого индикатора на различных активах, Сет-файлы для настройки Bomber Utility в режимы: "Минимум Риска", "Взвешенный Риск" и "Стратегия Выжидания", Пошаговый видео-мануал, который поможет вам быстро установить, на
Entry In The Zone and SMC Multi Timeframe is a real-time market analysis tool developed based on Smart Money Concepts (SMC). It is designed to analyze market structure, price direction, reversal points, and key zones across multiple timeframes in a systematic way. The system displays Points of Interest (POI) and real-time No Repaint signals, with instant alerts when price reaches key zones or when signals occur within those zones. It functions as both an Indicator and a Signal System (2-in-1), c
RelicusRoad Pro: Квантовая Рыночная Операционная Система СКИДКА 70% ПОЖИЗНЕННЫЙ ДОСТУП (ОГРАНИЧЕНО) - ПРИСОЕДИНЯЙТЕСЬ К 2000+ ТРЕЙДЕРАМ Почему большинство трейдеров теряют деньги даже с «идеальными» индикаторами? Потому что они торгуют Единичными Концепциями в вакууме. Сигнал без контекста — это лотерея. Чтобы выигрывать стабильно, вам нужна КОНФЛЮЭНЦИЯ . RelicusRoad Pro — это не простой стрелочный индикатор. Это полная Количественная Рыночная Экосистема . Она отображает «Дорогу Справедливой Сто
CGE Trading Suite
Carl Gustav Johan Ekstrom
5 (1)
CGE Trading Suite delivers the analytical edge typically reserved for professional trading desks. The platform integrates a full suite of analytical tools into one seamless workflow: dynamic grid mapping, liquidity behavior analysis, ECM, trend lines, MIDAS, trade cycles, and directional channel projections. Together, these provide a unified view of market structure and momentum. Directional clarity is further enhanced by the capital flow index, which measures currency basket strength to identif
Если вы покупаете этот индикатор, вы получите мой профессиональный Trade Manager + EA БЕСПЛАТНО. Прежде всего стоит подчеркнуть, что эта торговая система является индикатором без перерисовки, без повторной отрисовки и без задержки, что делает ее идеальной как для ручной, так и для роботизированной торговли. Онлайн курс, руководство и загрузка пресетов. «Smart Trend Trading System MT5» - это комплексное торговое решение, созданное для новичков и опытных трейдеров. Он объединяет более 10 премиаль
Gold Entry Sniper – Профессиональная Мульти-Таймфрейм ATR Панель для Скальпинга и Свинг-Трейдинга на Золоте Gold Entry Sniper — это передовой индикатор для MetaTrader 5, разработанный для точных сигналов на покупку/продажу по XAUUSD и другим инструментам. Основан на логике ATR Trailing Stop и мульти-таймфрейм анализе , этот инструмент идеально подходит как для скальперов, так и для среднесрочных трейдеров, обеспечивая чёткие точки входа с высокой вероятностью . Основные возможности и преимуществ
FX Trend NG: Следующее поколение интеллектуального анализа трендов на разных рынках Обзор FX Trend NG — это профессиональный инструмент анализа трендов и мониторинга рынка с поддержкой нескольких таймфреймов. Он позволяет за секунды получить полное структурное понимание текущего состояния рынка. Вместо переключения между десятками графиков вы мгновенно видите, какие инструменты находятся в тренде, где импульс ослабевает и где наблюдается сильная синхронизация между таймфреймами. Специальное пр
Power Candles – Входные сигналы на основе силы для любого рынка Power Candles переносит проверенный анализ силы Stein Investments прямо на ценовой график. Вместо реакции только на цену каждая свеча окрашивается на основе реальной рыночной силы, позволяя мгновенно распознавать накопление импульса, ускорение силы и четкие смены тренда. Одна логика для всех рынков Power Candles автоматически работает со всеми торговыми инструментами . Индикатор определяет, является ли текущий символ валютной парой
Meridian Pro
Ottaviano De Cicco
5 (1)
Meridian Pro: Профессиональная мульти-таймфрейм матрица трендов для MT5 Обзор Meridian Pro — это мульти-таймфрейм матрица трендов от Merkava Labs , которая сжимает направление, силу, состояние импульса и согласованность матрицы в одну компактную панель. Один адаптивный движок, последовательно применяемый от M1 до W1. Без настройки под отдельные символы. Без нагромождения индикаторов. Одна структурированная оценка по всем активам и всем таймфреймам. Акция запуска — получите Meridian Pro за USD 99
Раскройте силу торговли трендами с помощью индикатора Trend Screener: вашего идеального решения для торговли трендами, основанного на нечеткой логике и мультивалютной системе! Повысьте уровень своей торговли по тренду с помощью Trend Screener, революционного индикатора тренда, основанного на нечеткой логике. Это мощный индикатор отслеживания тренда, который сочетает в себе более 13 инструментов и функций премиум-класса и 3 торговые стратегии, что делает его универсальным выбором для превращения
[ My Products ] , [ My Channel ]   ,  [ LIVE SIGNAL ] HFT Spike Detector HFT Spike Detector — это профессиональный инструмент мониторинга тиков, разработанный для анализа и измерения высокочастотных ценовых движений (вызванных HFT резкими скачками) в режиме реального времени. Цель — позволить вам выявлять аномальные значения проскальзывания, разрывы ликвидности и миллисекундные ценовые скачки, вызванные брокером, с помощью числовых данных. Поскольку инструмент анализирует поток тиков в реаль
Прежде всего стоит подчеркнуть, что этот торговый индикатор не перерисовывается, не перерисовывает и не отставает, что делает его идеальным как для ручной, так и для роботизированной торговли. Руководство пользователя: настройки, вводы и стратегия. Атомный аналитик - это индикатор ценового действия PA, который использует силу и импульс цены, чтобы найти лучший край на рынке. Оборудованный расширенными фильтрами, которые помогают убирать шумы и ложные сигналы, и повышают торговый потенциал. Испо
Инструмент маркет-мейкеров. Meravith будет: Анализировать все таймфреймы и отображать текущий действующий тренд. Выделять зоны ликвидности (объёмное равновесие), где бычий и медвежий объём равны. Показывать все уровни ликвидности с разных таймфреймов прямо на вашем графике. Генерировать и отображать текстовый анализ рынка для вашего ориентирования. Рассчитывать цели, уровни поддержки и стоп-лосс в соответствии с текущим трендом. Вычислять соотношение риск/прибыль для ваших сделок. Определять раз
OmniSync Projection
Antonio-alin Teculescu
5 (1)
Chronos Fractal Engine is an innovative price projection indicator for MetaTrader 5, designed to transform your technical analysis by intelligently identifying and projecting historical price patterns. Built upon an advanced correlation algorithm and the fractal principles of the market, this powerful tool visualizes potential future price movements, giving you a unique edge in your trading decisions. What is Chronos Fractal Engine? At its core, the Chronos Fractal Engine employs a sophisticat
ARICoin is a powerful trading companion designed to generate high-probability entry signals with dynamic TP/SL/DP levels based on volatility. Built-in performance tracking shows win/loss stats, PP1/PP2 hits, and success rates all updated live. Key Features: Buy/Sell signals with adaptive volatility bands Real-time TP/SL/DP levels based on ATR Built-in MA Filter with optional ATR/StdDev volatility Performance stats panel (Success, Profit/Loss, PP1/PP2) Alerts via popup, sound, push, or email Cust
Quantum TrendPulse
Bogdan Ion Puscasu
5 (22)
Представляем   Quantum TrendPulse   , совершенный торговый инструмент, который объединяет мощь   SuperTrend   ,   RSI   и   Stochastic   в один комплексный индикатор, чтобы максимизировать ваш торговый потенциал. Разработанный для трейдеров, которые ищут точность и эффективность, этот индикатор помогает вам уверенно определять рыночные тренды, сдвиги импульса и оптимальные точки входа и выхода. Основные характеристики: Интеграция SuperTrend:   легко следуйте преобладающим рыночным тенденциям и п
Currency Strength Dashboard Pro Профессиональная панель анализа силы валют в реальном времени для MetaTrader 5. Индикатор рассчитывает и отображает силу 8 основных валют (EUR, USD, GBP, JPY, CHF, AUD, CAD, NZD) по 28 валютным парам одновременно на нескольких таймфреймах. Панель даёт трейдеру полную картину рынка с первого взгляда — без лишних расчётов и переключений между графиками. Метод расчёта В основе индикатора лежит продвинутый математический метод анализа силы валют — более точный и объек
Представляю Вам отличный технический индикатор GRABBER, который работает, как готовая торговая стратегия "Все включено"! В одном программном коде интегрированы мощные инструменты для технического анализа рынка, торговые сигналы (стрелки), функции алертов и Push уведомлений.  Каждый покупатель этого индикатора получает дополнительно БЕСПЛАТНО:  Grabber Утилиту для автоматического управления открытыми ордерами, Пошаговый видео-мануал : как установить, настроить и торговать, Авторские сет-файлы дл
Представляем       Quantum Breakout PRO   , новаторский индикатор MQL5, который меняет ваш способ торговли в зонах прорыва! Разработан командой опытных трейдеров со стажем торговли более 13 лет,       Квантовый прорыв PRO       разработан, чтобы поднять ваше торговое путешествие к новым высотам с его инновационной и динамичной стратегией зоны прорыва. Quantum Breakout Indicator покажет вам сигнальные стрелки на зонах прорыва с 5 целевыми зонами прибыли и предложением стоп-лосса на основе поля
FX Power: Анализируйте силу валют для более эффективной торговли Обзор FX Power — это ваш незаменимый инструмент для понимания реальной силы валют и золота в любых рыночных условиях. Определяя сильные валюты для покупки и слабые для продажи, FX Power упрощает принятие торговых решений и выявляет высоковероятные возможности. Независимо от того, хотите ли вы следовать за трендами или предсказывать развороты с использованием экстремальных значений дельты, этот инструмент идеально адаптируется под
Bill Williams Advanced предназначен для автоматического анализа графика по системе " Profitunity " Билла Уильямса. Индикатор анализирует сразу четыре таймфрейма. Инструкция/Мануал ( Обязательно читайте перед приобретением ) Преимущества 1. Анализирует график по системе "Profitunity" Билла Уильямса. Сигналы помещает в таблицу в углу экрана и на график цены. 2. Находит все известные сигналы АО и АС, а также сигналы зон. Оснащён трендовым фильтром по Аллигатору. 3. Находит "Дивергентный бар", а та
Этот индикатор является уникальным, качественным и доступным инструментом для торговли, включающим в себя наши собственные разработки и новую формулу. В обновленной версии появилась возможность отображать зоны двух таймфреймов. Это означает, что вам будут доступны зоны не только на старшем ТФ, а сразу с двух таймфреймов - таймфрейма графика и старшего: отображение вложенных зон. Обновление обязательно понравится всем трейдерам, торгующим по зонам спроса и предложения. Важная информация Для макс
Индикатор точно показывает точки разворота и зоны возврата цены, где входят   крупные игроки . Вы видите, где формируется новый тренд, и принимаете решения с максимальной точностью, держа контроль над каждой сделкой. VERSION MT4     -    Раскрывает свой максимальный потенциал в связке с индикатором  TREND LINES PRO Что показывает индикатор: Разворотные конструкции и разворотные уровни с активацией в начале нового тренда. Отображение уровней  TAKE PROFIT  и  STOP LOSS  с минимальным соотношением
Market Structure Order Block Dashboard MT5 — это индикатор MT5 для анализа структуры рынка и подхода ICT / Smart Money Concepts: HH/HL/LH/LL , BOS , ChoCH , а также Order Blocks , Fair Value Gaps (FVG) , Liquidity (EQH/EQL, sweeps), Sessions / Kill Zones и встроенный Volume Profile с компактным dashboard конfluences. Важно: это инструмент анализа . Он не открывает сделки и не управляет позициями (это не EA). Бонус для покупателей После покупки вы можете получить 2 бонусных индикатора (на выбор)
Market Structure Patterns
Samuel Manoel De Souza
4.47 (19)
Available for   MT4   and   MT5 . Join the Market Structure Patterns channel to download materials available for study and/or additional informations. Related posts: Market Structure Patterns - Introduction Beyond Fancy Order Blocks: Using True Volumetric Analysis with Market Structure Patterns & Timeless Charts Market Structure Patterns   is an indicator based on   smart money concepts   that displays   SMC/ICT   elements that can take your trading decisions to the next level. Take advantage
Crystal Heikin Ashi Signals - Professional Trend & Signal Detection Indicator Advanced Heikin Ashi Visualization with Intelligent Signal System for Manual & Automated Trading Final Price: $149 ---------> Price goes up $10 after every 10 sales . Limited slots available — act fast . Overview Crystal Heikin Ashi Signals is a professional-grade MetaTrader 5 indicator that combines pure Heikin Ashi candle visualization with an advanced momentum-shift detection system. Designed for both manual traders
Узнайте, какая стратегия действительно работает на вашем инструменте - прежде чем рисковать реальными деньгами. Power Bar обнаруживает экстремальные ценовые бары на любом инструменте и любом таймфрейме, затем мгновенно тестирует 3 различные торговые стратегии, чтобы вы могли сравнить процент выигрышей, профит-факторы и прибыль/убыток. Все в одной интерактивной панели. Никаких догадок. Никакой подгонки. Только данные. Что делает Power Bar уникальным? Большинство индикаторов дают сигнал и оставля
Smart Stop Indicator – Интеллектуальная точность стоп лоссов прямо на графике Обзор Smart Stop Indicator это специализированное решение для трейдеров, которые хотят устанавливать стоп лоссы чётко и методично, а не на интуитивной основе. Индикатор объединяет классическую логику прайс экшн (higher highs, lower lows) с современной системой распознавания пробоев, чтобы определить действительно логичный уровень стопа. В трендах, диапазонах или фазах резких движений он показывает оптимальные зоны SL
Другие продукты этого автора
Important Lines
Terence Gronowski
4.88 (24)
Индикатор отображает линии пивот, уровни максимума, минимума и закрытия предыдущего дня, а также минимум и максимум предыдущего часа. Нужно просто установить этот индикатор на график, чтобы отобразить все эти важные линии, нет необходимости настраивать множество отдельных индикаторов. Почему важны определенные линии Максимум и минимум предыдущего дня : эти уровни используются для торговли на дневном графике. Очень часто, если цена становится выше или ниже минимума/максимума предыдущего дня, про
FREE
Opening Range Indicator   Idea Toby Crabel introduced this way of trading in the ealy ninties in his book "Day Trading with Short Term Price Patterns and Opening Range Breakout". In simple terms this means to trade the brekouts from the limits of the first trading hour with the stop loss at the opposite side. I.e. if the first hourly candle meausres 40 points (Crabel calls this the "stretch") you set the stop loss at breakout level minus 40 points and the take profit at the breakout level plus 4
FREE
Swiss CandleTime What ist CandleTime for This indicaor just displays the remaining time for a candle to build. It is best used if you trade with timframes from 3 minutes. I use it in M3 to keep postions. If I have two following red candles i usually liquidate the position. Timeframes M1 to H1 Inputs Arrow displayed => Edit your arrow string Arrow for waiting conditions => Arrow if chart is offline Text Color => color of the text Tell if there is a trend change => tells you, if the two preciding
FREE
Normal Parabolic SAR with label of long or short state. Tells also "Parabolic long" and "short". Can be used in multitimeframe layouts together with Swiss HolyGrail indicator or in different timeframes. So, if all the indicators show "long" or "short" you can be sure that the risk of a wrong direction is small. The standard values for Parabolic SAR are 0.02 for step and 0.2 for maximum. You may experiment with changing the maximum to get smother curves.  Note that changes in parabolic SAR are la
FREE
Shows min and max of last M5 Candle. Can be used to trade breakouts of last M5 candle.  The M5 Candle Breakout Strategy avoids to stay too long in a sindways phase. See documentation on  @swisstrader3713, where you can follow my live trading. The only parameters are the color of the lines defining the M5 stretch. Best use the indicator in M1 timeframe. The M5 Breakout Strategy has helped me to reduce overtrading.
FREE
Swiss InsideOutsideBar Imortance of Inside- and Outside Bars Inside bars are completely engulfed by its previous bar. The pattern is also known as "harami" (pregnant). Outsidebars engulf the previous bar. Inside bars might mark situations before an outbreak. They are a condensed form of a symmetrical triangle. Symmetrical triangles represent a battle between bulls and bears. There can be an outbreak to either side, mostly the outbreak is in direction of the main trend. The combination of inside
FREE
Swiss HolyGrail
Terence Gronowski
3 (1)
Swiss Holy Grail Indicator Motivation and functioning The HolyGrail indicator serves to optimize an entry. At that very moment I caught myself, that I went short in an uptrend, so I got into a trade in an anti-cyclical way. Or I have entered into a much too mature trend. This indicator should prevent such errors: One should always be aware of whether it is pro- or anticyclic entry, and one must always know about the maturity of the trend. Don't enter an old trend. Linda Raschke advises to buy th
FREE
RSI talking, use all your senses while trading! The idea When trading your eyes might be very stressed. Therefore I programmed the RSItalking. Trade what you see and what you hear ! Function This indicator says "rsioverbought" when rsi is over a threshold value (default 75%) and "rsioversold" if it is under a lower threshold (default 25%). When you keep a long position be adviced to realize profit when the indicator tells you "rsioverbought" and vice versa. You will find an explanation of the
FREE
FasterShark
Terence Gronowski
5 (1)
Idea I programmed this tool out of the necessity to be constantly informed about what is going on. Before I sometimes forgot to set a stopp loss, this is impossible with this tool. Further this tool allows you to make distributed entries, eg. with a first feeler with 0.1 contracts and when the direction is the right one you just put more contacts into the game. Money- and risk management is built in. If you use more then the predetermined number of contracts there is a warning. You are constantl
FREE
Фильтр:
Kedrov
1181
Kedrov 2025.05.15 12:07 
 

Просмотрел штук 40 VWAP в разных исполнениях. Но ни в одном не нашел коррекции по временной зоне по GMT – такое впечатление, что все брокеры работают в одной зоне. Странно!

Isabella
77
Isabella 2024.04.17 11:56 
 

sehr nützlich zB für daily Entscheidung, aber auch kurzfristig sinnvoll

Swisstomek
51
Swisstomek 2020.11.27 15:09 
 

super Filter / Indikator. Kann ich nur empfehlen. Genauso kann ich auch den "important Lines" Indikator empfehlen.

contraror
77
contraror 2020.08.06 09:31 
 

Good work! The comments are useful reminders not to trade on the wrong side.

WillieBeGood
119
WillieBeGood 2020.05.14 07:14 
 

I have not been using it for long, so a review at this time would not be fair. I plan on leaving my computer run 24/7, so maybe it will give a better indication of performance

112586
362
112586 2020.04.30 23:26 
 

Пользователь не оставил комментарий к оценке

Ответ на отзыв