Hyper Vision
- Индикаторы
- Версия: 1.30
- Обновлено: 25 апреля 2026
HyperVision is a professional-grade, all-in-one Smart Money Concepts indicator engineered for traders who want to stop guessing and start trading with institutional precision. Built from the ground up for MetaTrader 5, it combines market structure analysis, order flow detection, machine learning forecasting, and advanced risk management into a single, seamlessly integrated system.
No repainting on confirmed signals. No lag. No guesswork
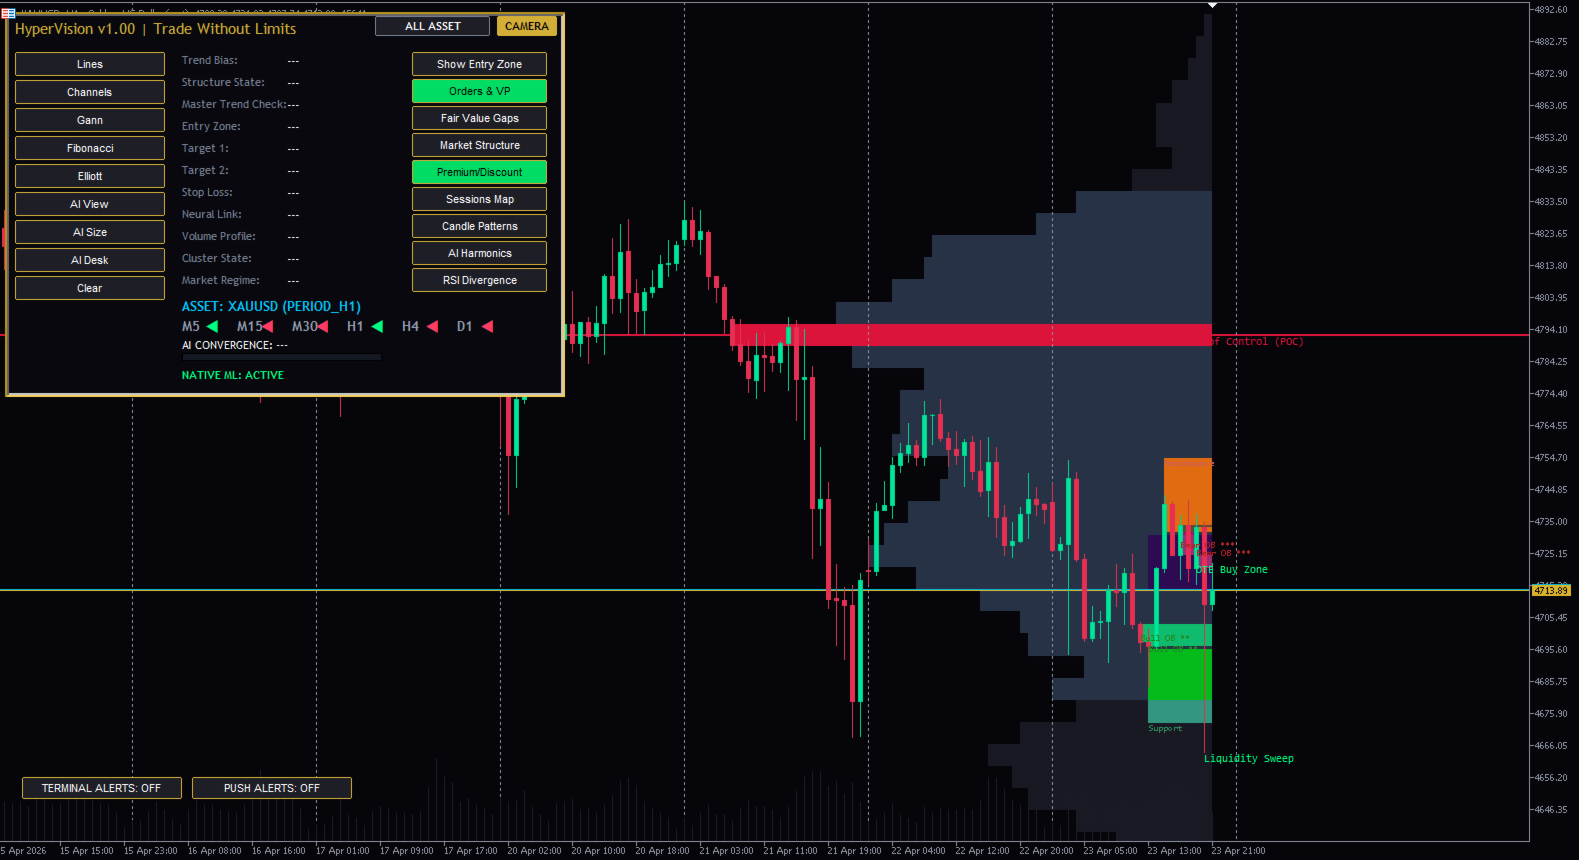
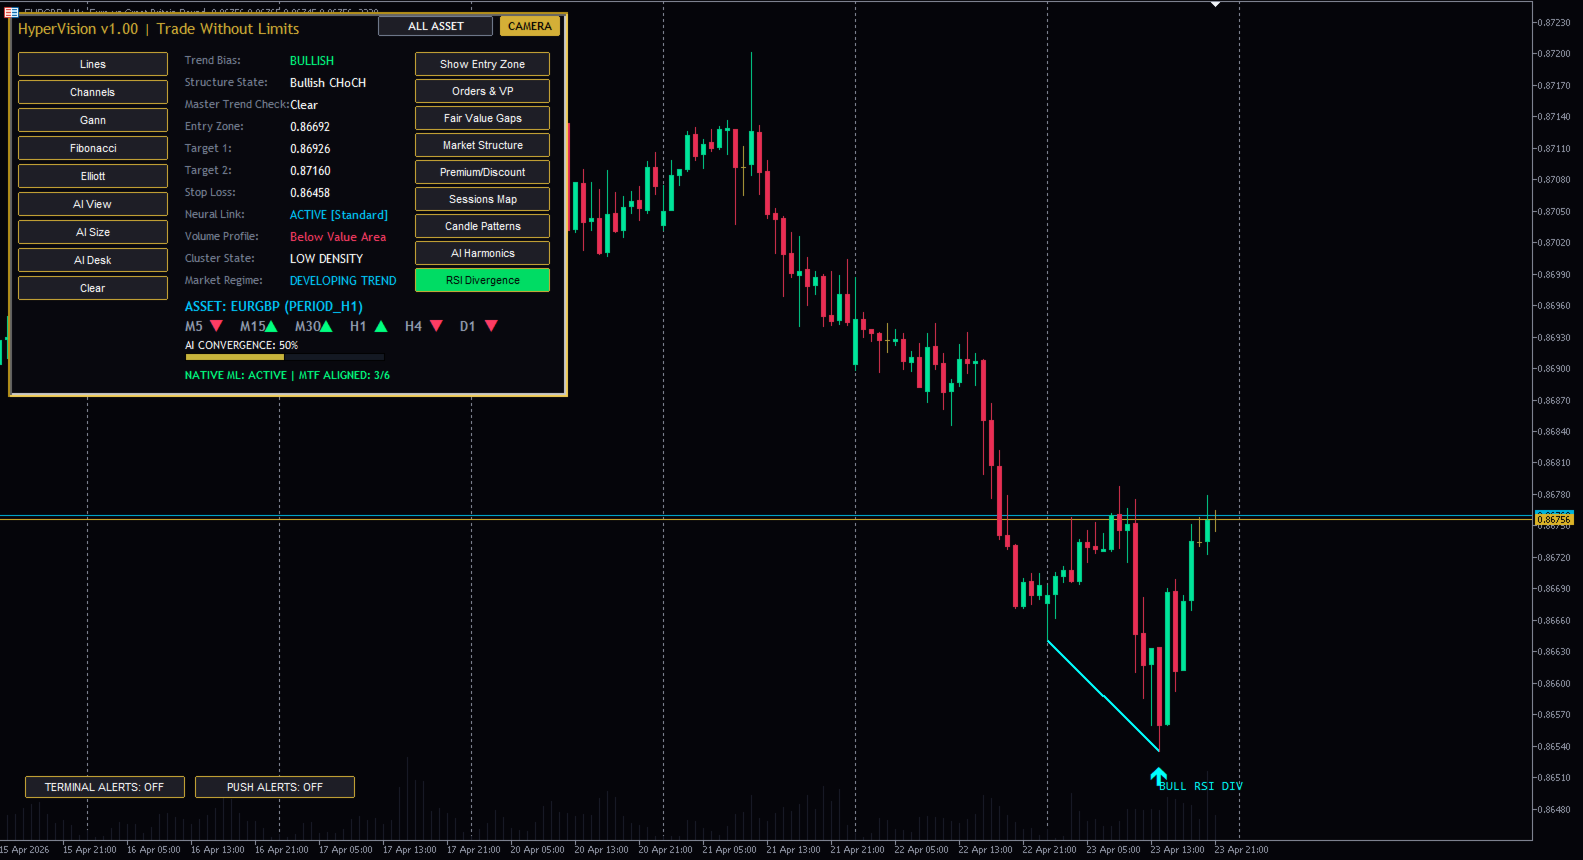
What Makes HyperVision Different Most SMC indicators detect one or two elements. HyperVision runs a full institutional analysis engine on every tick — simultaneously detecting market structure, order blocks, fair value gaps, liquidity sweeps, session timing, harmonic patterns, RSI divergence, volume profile, and multi-timeframe bias — and fuses all of it into one unified confidence score. You do not need ten separate indicators. Everything lives in one draggable, real-time control panel. Core Detection Engine Market Structure (BOS / CHoCH) HyperVision continuously tracks swing highs and swing lows across your lookback window, classifying the market into six states in real time: Bullish Structure, Bearish Structure, Bullish BOS, Bearish BOS, Bullish CHoCH, and Bearish CHoCH. Break of Structure fires when a confirmed close breaks past the last swing pivot. Change of Character detects the earliest possible reversal signal before the trend fully flips. All levels are drawn directly on the chart with arrows, labels, and dashed level lines. Order Block Identification The indicator scans every bar for institutional order blocks — bearish candles followed by strong bullish breakouts (bullish OBs) and bullish candles followed by strong bearish breakdowns (bearish OBs). Only unmitigated blocks are displayed. Each block is rated 1–3 stars based on the momentum of the breakout that created it. Blocks are drawn as filled rectangles extending to the current bar for continuous visual reference. Fair Value Gap (FVG) Zones Three-candle imbalance detection identifies both bullish and bearish FVGs in real time. Only unfilled gaps are shown — the moment price returns to fill a gap, it is removed automatically. FVG zones extend forward to the present candle, giving you a clear visual of open imbalance areas price is likely to revisit. Volume Profile with Point of Control A full session volume profile histogram is calculated across your chosen lookback period and displayed anchored to the live price. The Point of Control (POC) — the price level with the highest traded volume — is marked with a dedicated horizontal line. Value Area High and Value Area Low are separately color-coded. The POC is used directly in entry calculation when it coincides with an Order Block. Multi-Timeframe Bias (HTF) Two configurable higher timeframes (default H4 and D1) are continuously analyzed. Their swing structure is assessed independently and compared to your current chart direction. An HTF alignment adds +7 confidence points. An HTF conflict triggers a −35 point penalty and displays a "DANGEROUS CONFLICT" warning in the HUD — automatically filtering out the most common cause of losing trades. Session-Based Analysis Asia, London, and New York sessions are automatically boxed on the chart with their high-low ranges. London Kill Zone (07:00–10:00 GMT) and New York Kill Zone (12:00–15:00 GMT) are identified in real time and labeled directly on the chart. Trading inside a Kill Zone adds +5 confidence to any setup. Candlestick Pattern Detection Fourteen pattern types are detected across the last 30 bars, including: Doji, Marubozu, Pin Bar, Shooting Star, Bullish and Bearish Engulfing, Piercing Line, Dark Cloud Cover, Tweezer Top and Bottom, Harami, Three White Soldiers, Three Black Crows, Morning Star, and Evening Star. Each pattern is marked with a directional arrow and label. Recent patterns (within 2 bars) that align with the trend add +8 confidence. AI Harmonic Pattern Detection Four classic harmonic patterns — Gartley, Bat, Butterfly, and Crab — are detected using Fibonacci ratio validation with 15% tolerance. When a harmonic pattern's D-point coincides with an Order Block or FVG, it receives an "AI Verified" label and is highlighted in full color. Patterns are displayed as filled triangles (XAB and BCD legs) directly on the chart. RSI Divergence Classic bullish and bearish RSI divergences are detected by comparing price swing levels against RSI values at those same bars. Divergence lines are drawn connecting the swing points, with directional arrows and text labels. A bearish RSI divergence on a resistance zone, combined with a bearish BOS, is one of the highest-probability setups the indicator can produce. Liquidity Sweep Detection The indicator monitors whether recent wicks have swept beyond the last major swing high or low and immediately closed back inside — a hallmark of institutional stop hunting. When a sweep is confirmed, a "Liquidity Sweep" label is placed on the chart and +8 points are added to the confidence score. The AI Convergence EngineEvery factor detected by HyperVision feeds into a unified confidence scoring system that runs on every tick. Scores range from 0 to 97%. The scoring breakdown is as follows:
Structure Type: up to +20 points (BOS confirmed) Trend Strength: up to +8 points OTE Retrace: up to +12 points (price near the 62% level) Liquidity Sweep: up to +8 points Order Block Confluence: up to +10 points FVG Confluence: up to +5 points HTF Alignment: up to +12 points (both timeframes aligned) Candlestick Confirmation: up to +8 points Kill Zone Timing: up to +5 points HTF Conflict: −35 points (severe penalty, displayed as warning)
When the score reaches 80% or higher, the HUD displays "PRECIOUS ENTRY DETECTED" and the progress bar turns green. This is the only signal level at which alerts fire and the system recommends execution.
The Precious Entry mechanism adds an additional layer: if the Volume Profile Point of Control sits precisely inside an unmitigated Order Block that matches the trend direction, the entry price upgrades from the standard 62% OTE level to the POC price itself — the highest statistical confluence point in the market.
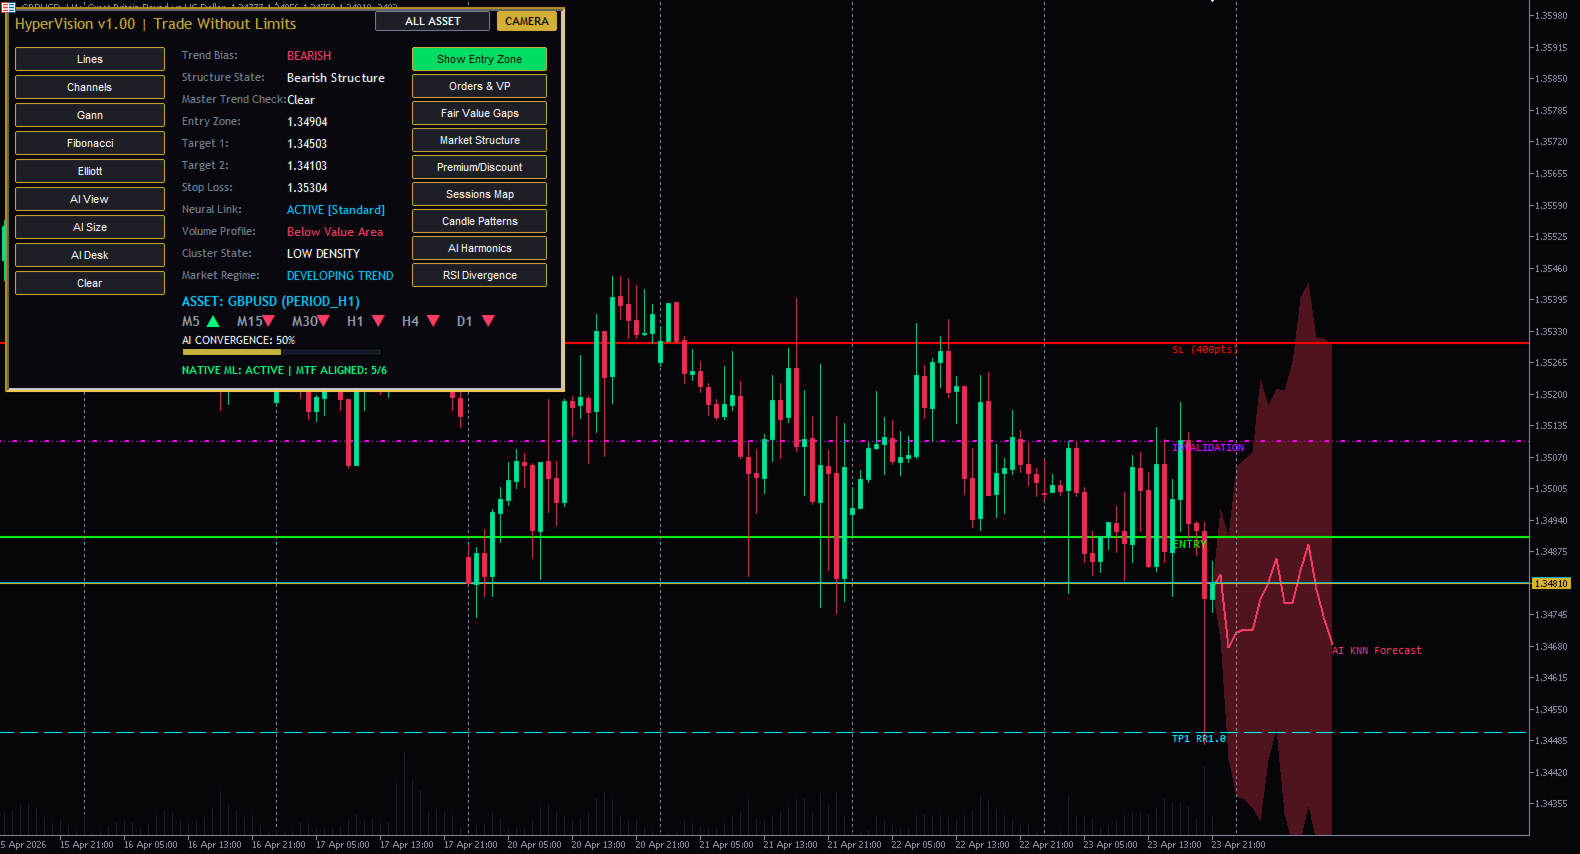
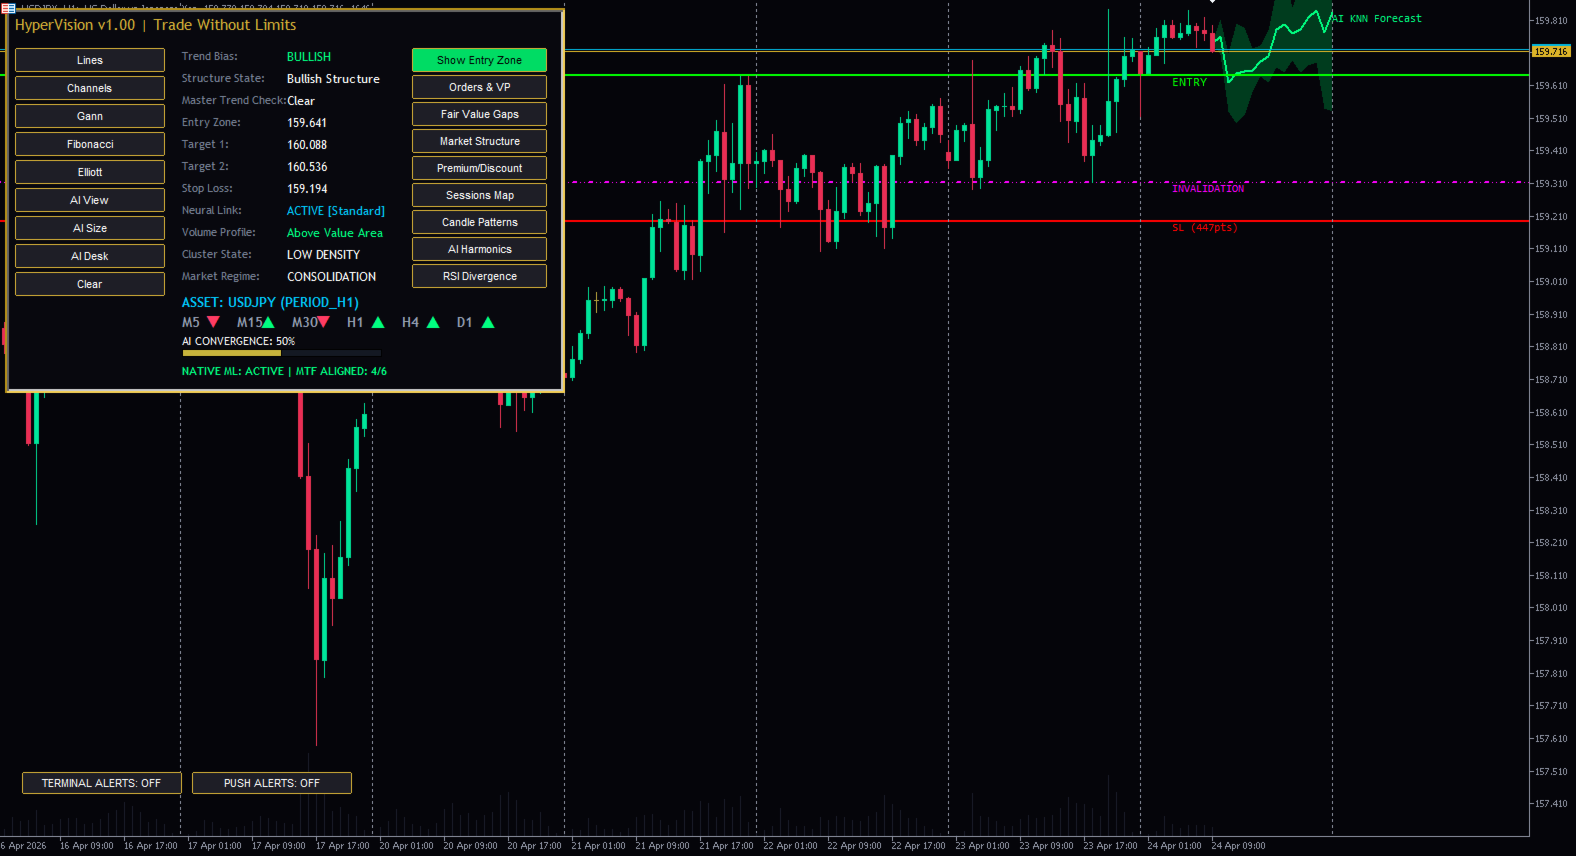
The HUD DashboardA professional 560-pixel control panel appears on your chart and updates on every tick. It is fully draggable — hold the title bar and position it anywhere on screen.
The left column contains nine tool buttons: Lines, Channels, Gann, Fibonacci, Elliott, AI View, AI Size, AI Desk, and Clear. The middle column displays eleven live values: Trend Bias, Structure State, Master Trend Check, Entry Zone, Take Profit 1, Take Profit 2, Stop Loss, Neural Link status, Volume Profile zone, Cluster State, and Market Regime. Below the values, an AI Convergence progress bar shows the current setup score with color coding (red below 50%, amber 50–79%, green 80%+). The right column contains nine individual layer toggles for precise chart control.
A six-timeframe MTF tracker (M5, M15, M30, H1, H4, D1) displays directional arrows for every timeframe simultaneously using live price data, showing alignment across the full market structure at a glance.
AI Position Sizing Engine (AI Size Panel)The AI Size panel runs a full quantitative position sizing calculation on demand. It uses your live account data, the current detected setup, and real-time volatility to calculate:
Optimal Lot Size — calculated using Kelly Criterion blended with ATR-based dynamic stop distance and your configured risk percentage. Value at Risk (VaR) — exact dollar amount at risk for the calculated lot size. Expected Value (EV) — statistical expected profit per trade based on win rate projection and risk:reward ratio. Volatility Regime — classified as Compressed, Stable, Elevated, or Extreme Volatility using a 60-bar ATR comparison, with appropriate lot size scaling. Margin Usage Impact — percentage of free margin consumed by the trade. Native AI Probability — a K-Nearest Neighbors machine learning algorithm embedded directly in the indicator scans up to 2,500 bars of price history, finds the 45 most similar recent patterns, and calculates what percentage of those historical matches resulted in an upward move 5 bars later. This generates a live BUY% and SELL% probability displayed in the panel.
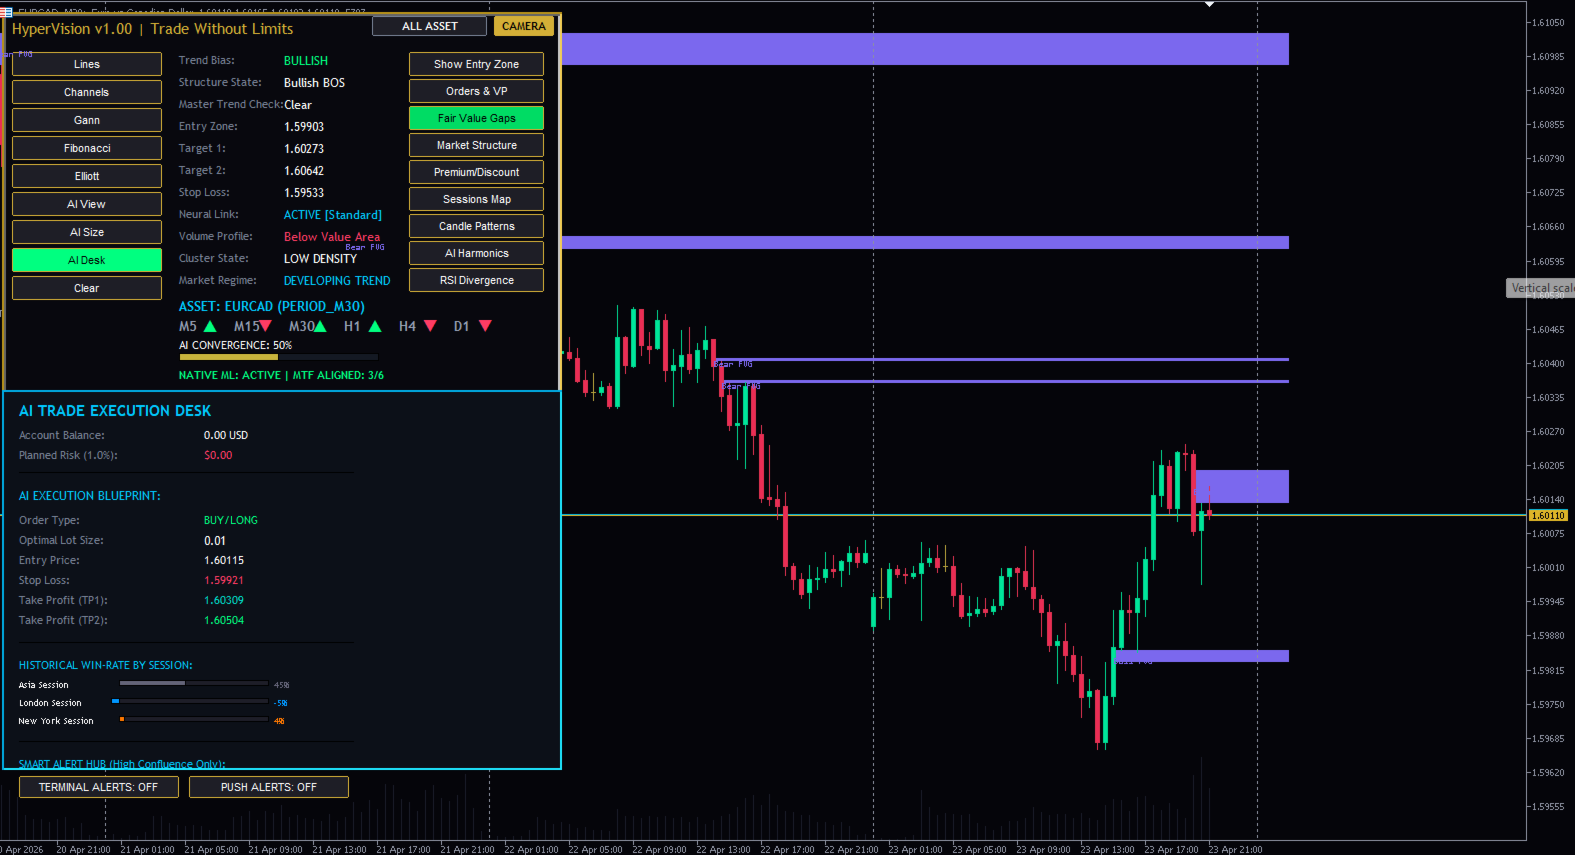
AI Trade Execution DeskThe AI Desk panel presents a complete trade blueprint using your live account and current setup. It shows account balance, risk allocation, order type, optimal lot size, entry price, stop loss, TP1 and TP2 with exact prices in your account currency, and a session win-rate breakdown for Asia, London, and New York. Smart Alert Hub controls for terminal and push notifications are embedded directly in the panel.
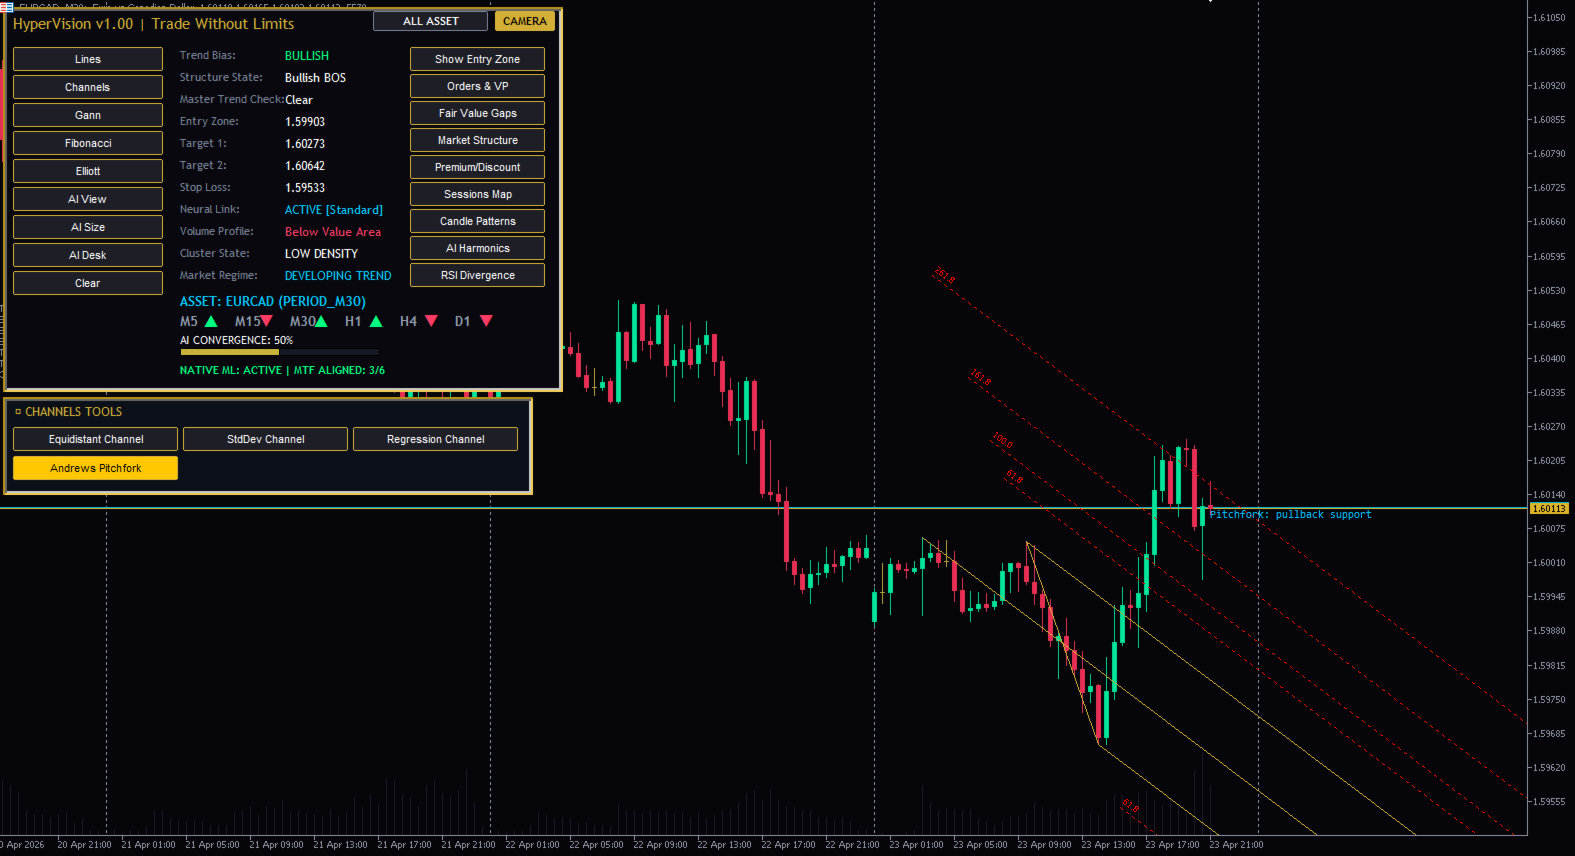
Drawing Tools SuiteFive categories of professional chart tools are available from the main panel, all auto-anchored to detected swing points:
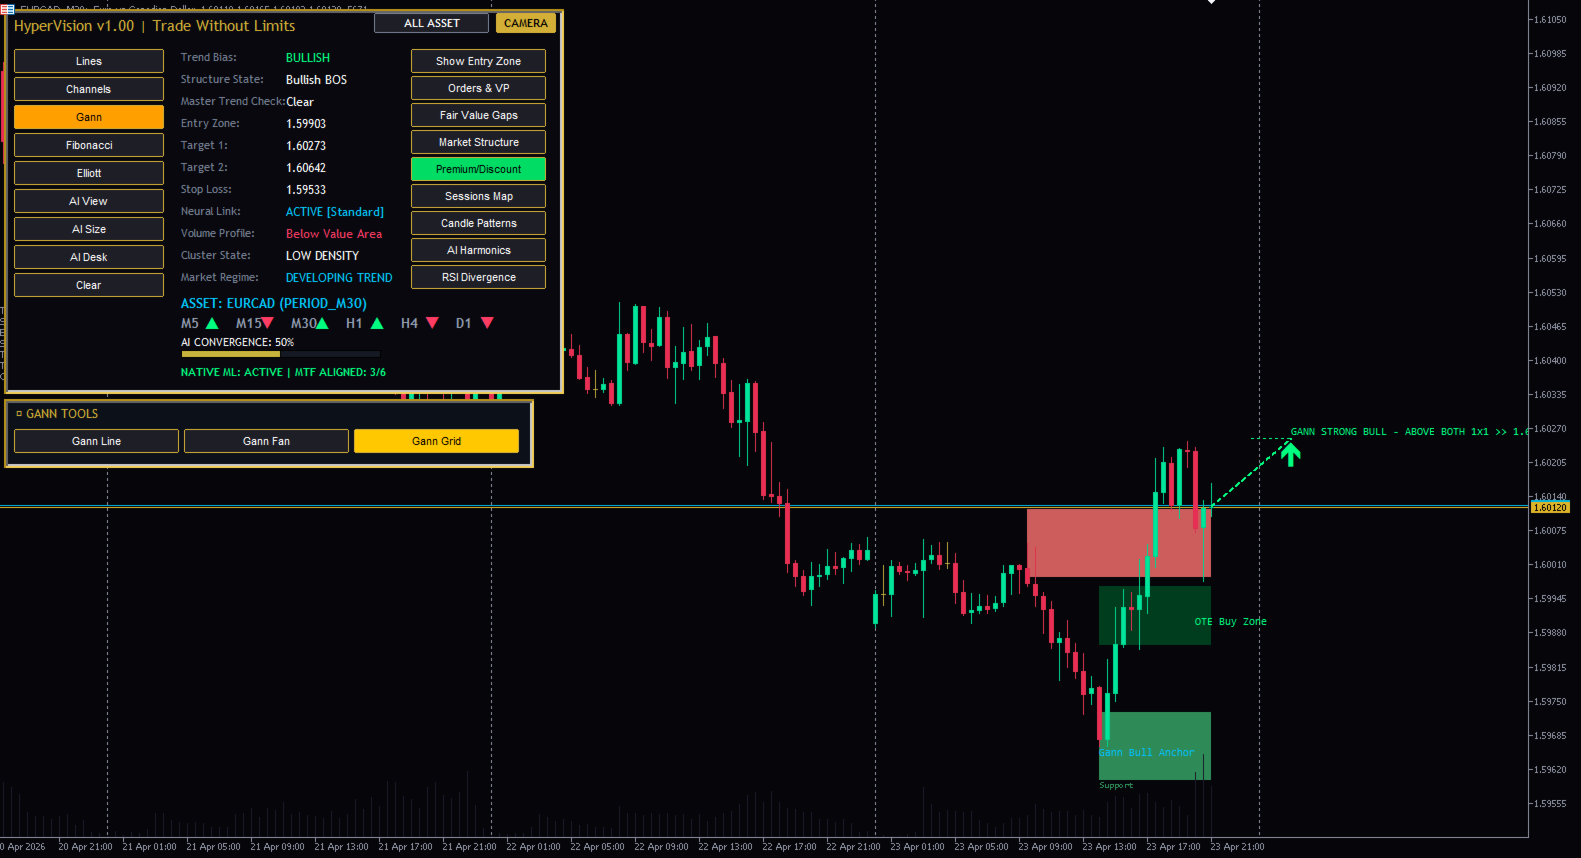
Lines — Vertical Line, Horizontal Line, Trendline, Trend by Angle, Cycle Lines, Arrowed Line Channels — Equidistant Channel, Standard Deviation Channel, Regression Channel, Andrews Pitchfork Gann — Gann Line, Gann Fan, Gann Grid. All three include an independent directional forecast projection based on the bullish and bearish 1×1 angle relationship — the tool reads where price is relative to both angles and draws a dashed projection line, directional arrow, and price target 10 bars into the future without requiring any manual input. Fibonacci — Retracement, Time Zones, Fan, Arcs, Channel, Expansion. All auto-placed using detected swing highs and lows. Elliott Wave — Motive (5-wave) and Corrective (3-wave), both with forward forecast zones. The Motive tool detects whether price is in a Wave 3 extension or approaching Wave 5 exhaustion using momentum comparison, then projects accordingly. The Corrective tool automatically forecasts trend resumption following the ABC structure.
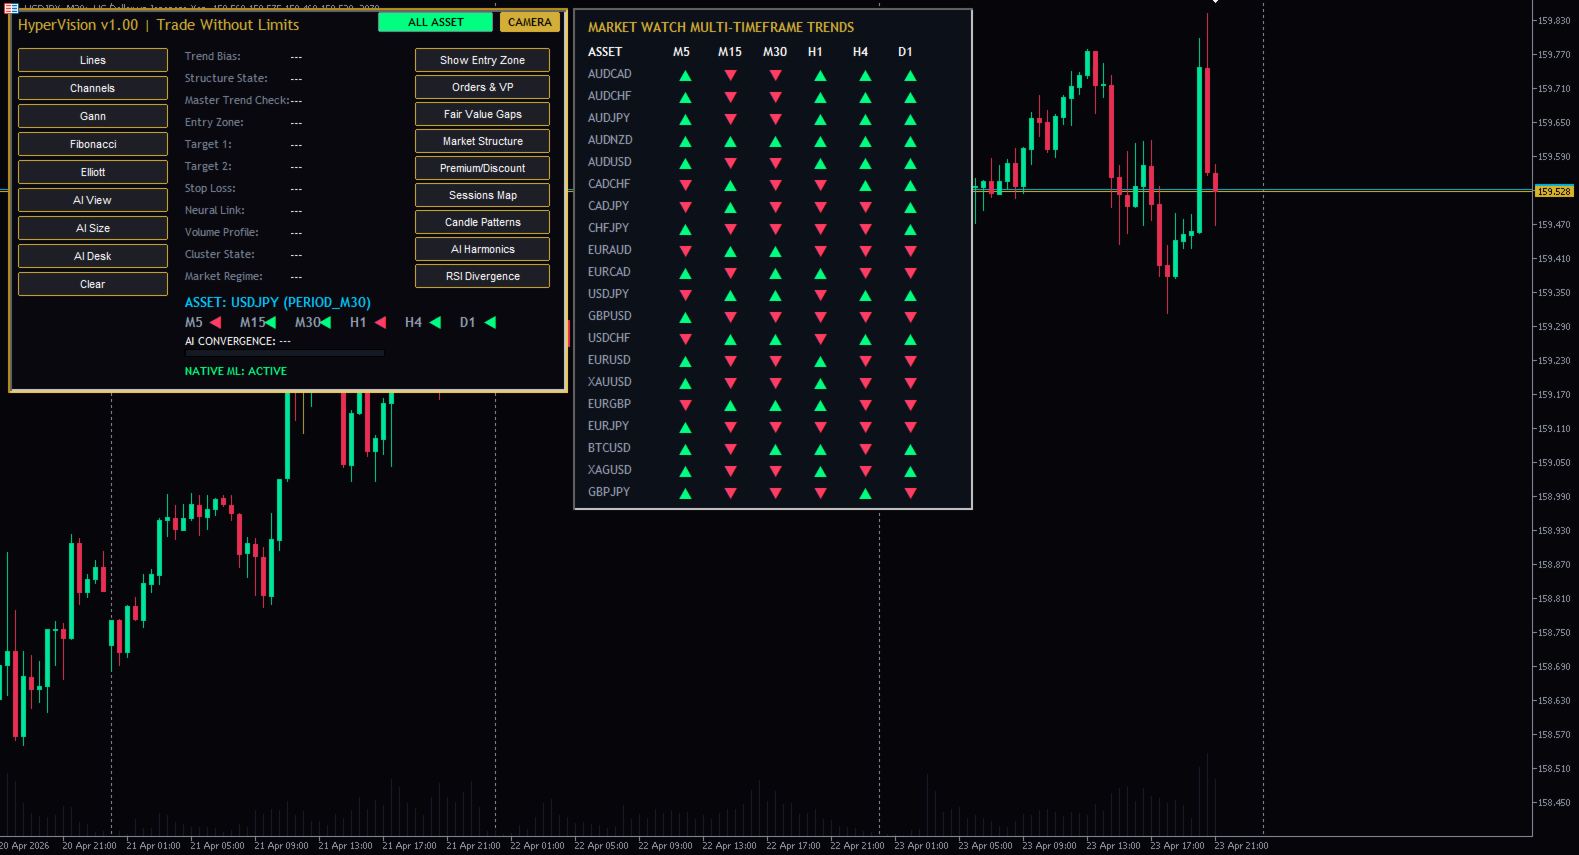
All Asset ScannerThe ALL ASSET panel opens a full Market Watch multi-timeframe scanner showing directional trend arrows across M5, M15, M30, H1, H4, and D1 for every symbol in your Market Watch list simultaneously. Green arrows indicate bullish structure, red indicates bearish. Use this to identify the strongest aligned pairs before selecting your trade.
Candlestick ScreenerThe Candle Patterns toggle opens a per-symbol, per-timeframe candlestick scanner across all Market Watch symbols, checking M15, M30, H1, H4, and D1 for Bullish Engulfing, Bearish Engulfing, Bullish Harami, Bearish Harami, and Doji patterns in real time.
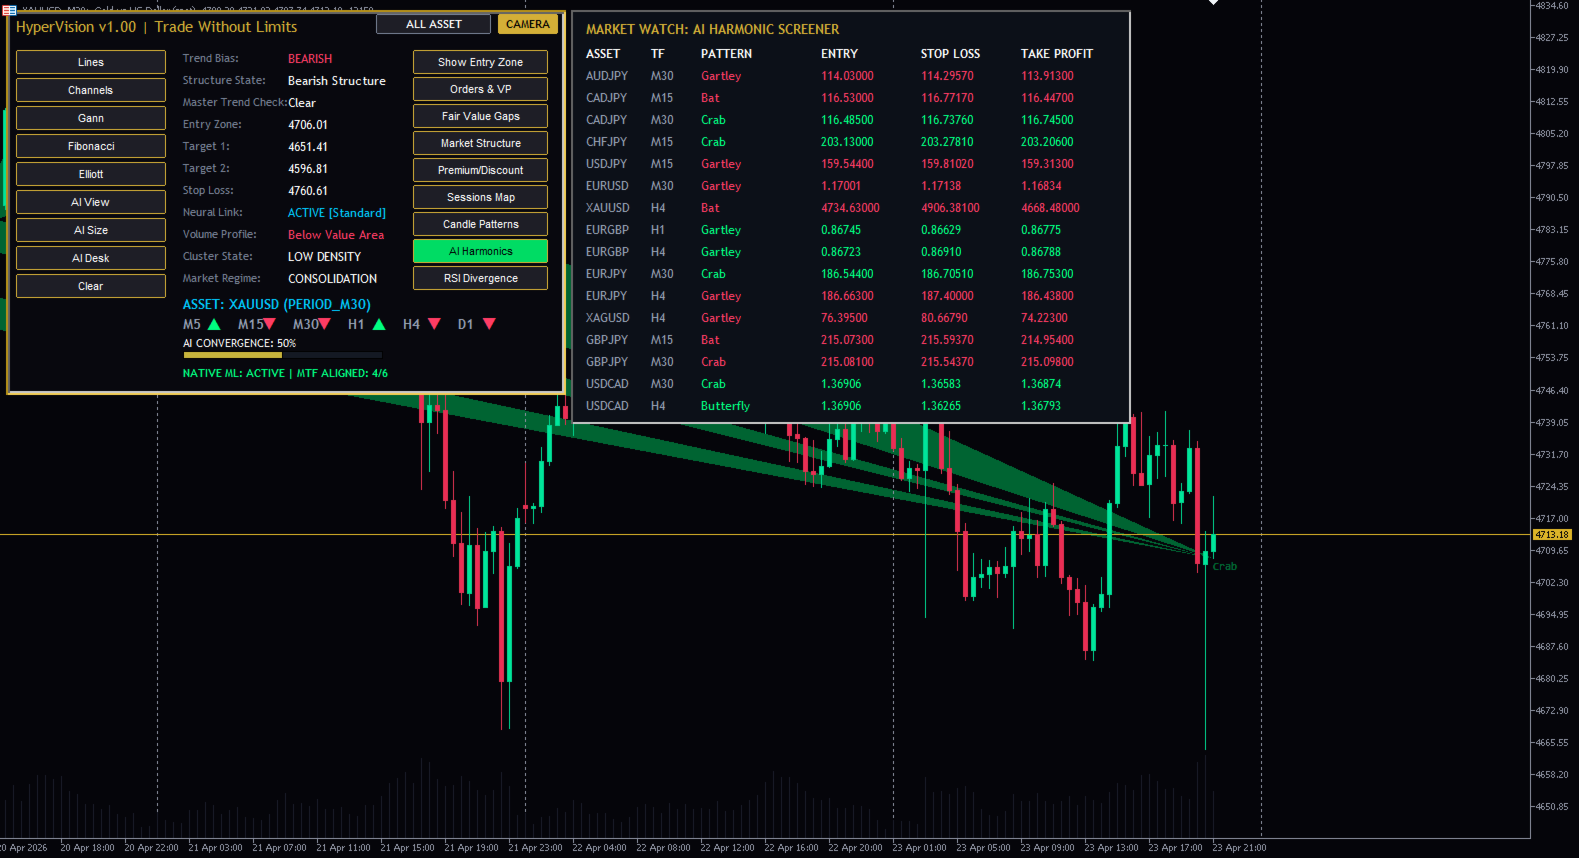
Harmonic ScreenerThe AI Harmonics toggle opens a live harmonic scanner across all Market Watch symbols on M15, M30, H1, and H4, displaying any detected Gartley, Bat, Butterfly, or Crab patterns with their asset, timeframe, pattern name, entry price, stop loss, and take profit in a formatted table.
Smart Alert SystemAlerts fire only when the AI Convergence score reaches 80% or higher AND price is within 15% of ATR from the entry zone AND the setup is at a new price level not previously alerted. This prevents spam and ensures every alert is a genuine high-probability setup. Each alert message includes the symbol, timeframe, direction, entry price, stop loss, TP1, and TP2.
Supported alert types: popup, sound, terminal, and push notification to the MetaTrader mobile app.
How to Read a SignalStep 1 — Open HyperVision on your chosen chart. The indicator auto-applies a premium chart theme.
Step 2 — Check the Structure State in the HUD. Look for Bullish BOS, Bearish BOS, Bullish CHoCH, or Bearish CHoCH. Avoid trading a "Range" state.
Step 3 — Check Master Trend Check. It must show "Clear." If it shows "DANGEROUS CONFLICT," skip this setup regardless of how strong it looks on the current timeframe.
Step 4 — Check Market Regime. "STRONG TREND" and "DEVELOPING TREND" are tradeable. "CHOPPY / RANGING" and "CONSOLIDATION" require caution.

Step 5 — Enable the Orders & VP toggle and the Fair Value Gaps toggle. Confirm that the Entry Zone shown in the HUD sits inside or near an Order Block or FVG zone.
Step 6 — Check the AI Convergence bar. Only enter when it reaches 80% and shows "PRECIOUS ENTRY DETECTED."
Step 7 — Confirm timing. Setups during the London Kill Zone (07:00–10:00 GMT) and New York Kill Zone (12:00–15:00 GMT) carry the highest historical success rate.
Step 8 — Execute at the Entry price shown in the HUD, with the Stop Loss and Take Profit levels provided. Use the AI Size panel to calculate your exact lot size.
Key Input Parameters
Lookback Bars — How many bars back to scan for pivots (default 450) Swing Strength — Pivot detection sensitivity, 1–10 (default 3) Max Order Blocks — Maximum OBs displayed (default 4) Max Fair Value Gaps — Maximum FVGs displayed (default 6) ATR Period — ATR calculation period for dynamic zones (default 14) Use Dynamic Zones — ATR-based zone widths (recommended: true) Risk Per Trade % — Base risk for position sizing (default 1.0%) TP1 Risk:Reward — First take profit ratio (default 1.0) TP2 Risk:Reward — Second take profit ratio (default 2.0) Higher Timeframe 1 — First HTF for bias (default H4) Higher Timeframe 2 — Second HTF for bias (default D1) Broker GMT Offset — Adjust session timing for your broker's server clock (default 0) Auto Refresh — Enables timed refresh of AI analysis (default true) Refresh Interval — How often the AI view updates in seconds (default 8)
Compatible MarketsForex — all major, minor, and exotic pairs Gold — XAUUSD (optimized) Silver — XAGUSD Indices — US30, NAS100, SPX500, DAX40, UK100 Crypto — BTCUSD, ETHUSD, and all available crypto pairs Any symbol available in your MetaTrader 5 broker
Recommended Timeframes: M15, M30, H1, H4 Works on: All timeframes from M1 to Monthly
Who Is This ForHyperVision is suited for any trader who works with price action — from beginners learning Smart Money Concepts for the first time to professional traders who need a reliable, multi-confluence confirmation system. Intraday traders benefit from the Kill Zone timing and session analysis. Swing traders benefit from the H4 and D1 bias alignment. Gold traders benefit from the volume profile and OB precision. Algorithmic-minded traders benefit from the AI position sizing and KNN probability engine.
After PurchaseFull setup assistance is available via the MQL5 private messaging system. All future updates are provided free of charge to existing purchasers.
HyperVision v1.00 — See the market the way institutions do. Trade without limits.