Смотри обучающее видео по маркету на YouTube
Как купить торгового робота или индикатор
Запусти робота на
виртуальном хостинге
виртуальном хостинге
Протестируй индикатор/робота перед покупкой
Хочешь зарабатывать в Маркете?
Как подать продукт, чтобы его покупали
Торговые роботы и индикаторы для MetaTrader 5 - 47

Osmosis is an advanced data driven automated trading robot which uses dynamic price differential algorithm and market volume to trade retracement on Gold (XAUUSD) . The price differential algorithm identifies various possible prices of execution, simultaneously pends and modifies orders until it gets the best possible price of execution. This makes the EA to use a flexible and dynamic execution conditions which depends on price action unlike other regular trading robots that use fix entry condi

50% Off Today Only! Price Goes Back Up at 11 PM (EST)
Marketkeys Trade Manager EA for MT5: Your Pathway to Forex Trading Mastery
What Traders Are Saying: "Much better than lots of other trade managers I've tested..." – R Vdr "Saves me time from manually calculating lots sizes and risks...amazing support." – Richard Obi Efficiency and precision are paramount in Forex trading. Marketkeys Trade Manager EA for MT5 offers just that - a seamless interface combined with robust risk management tools.

Основное:
Не мартингейл, не сеточник, работает на всех парах; В основе хороший рациональный алгоритм; Работа по взаимодействию двух индикаторов: Parabolic Sar и Moving Average (можно задавать отдельный Timeframe для каждого индикатора); Присутствует хорошая система money management (есть несколько вариантов trailing stop loss); Есть возможность работы по закрытым свечам, и по текущим свечам; Быстро оптимизируется (максимально ускорена работа). Очень хорошо оптимизируется на EURUSD . Актуальные

Ping: Ваш незаменимый инструмент для надёжной торговли Ваш интернет-провайдер и VPS обещают стабильное соединение, но действительно ли вы можете им доверять? В мире, где каждая миллисекунда имеет значение, медленное или нестабильное соединение может обернуться упущенной прибылью или убытками. Ping позволяет вам: * Принимать осознанные решения: Наглядно сравнивайте скорость разных VPS-серверов и брокеров, чтобы выбрать самое быстрое и надёжное соединение для вашей стратегии. * Исключить риски: О

Golden Star MT5 - это профессиональный трендовый индикатор для платформы MT5, разработанный группой профессиональных трейдеров. В основе алгоритма его работы - оригинальный авторский метод, позволяющий с высокой вероятностью находить потенциальные точки разворота тенденции и получать сигналы на вход в рынок в начале формирования тренда. Этот индикатор подойдет для работы на золоте, криптовалюте и валютными парами на Forex. Система оповещений (алерт, уведомления на почту и мобильный телефон) пом
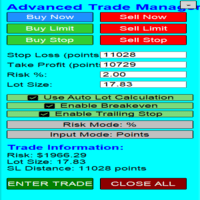
Overview Are you tired of complex manual calculations, emotional execution errors, and the constant fear of risking too much? The Advanced Trade Manager (ATM) is your all-in-one solution, a professional-grade Expert Advisor for MetaTrader 5 designed to give you institutional-level control over every aspect of your trade. From flawless risk calculation to intelligent, one-click execution, the ATM EA streamlines your entire trading process, allowing you to focus on your strategy, not the mechanics
FREE

Ichimoku Cloud Strategy EA MT5 — это продвинутый инструмент, разработанный исключительно для MetaTrader 5, упрощающий торговлю за счет использования индикатора Ишимоку для автоматизации входов и выходов из сделок на основе шести различных стратегий. EA поддерживает обратные торговые установки в ключевых зонах, предлагая универсальный подход к управлению сделками. Тщательно протестированный, он обеспечивает точные методы входа, гибкие правила выхода и продвинутое управление рисками, потребляя мин

Gold Breakout PRO-P - Прецизионная торговля прорывами для золота и форекс Овладейте рынками с непревзойденной точностью и безопасностью Gold Breakout PRO-P — это передовой экспертный советник (EA), разработанный для доминирования на рынке XAUUSD (золото), а также для успешной работы на парах Форекс, таких как EURUSD. Созданный для трейдеров проп-фирм, розничных инвесторов и энтузиастов алгоритмической торговли, этот EA использует сложную стратегию прорыва, усиленную подтверждением отклонений, об

Кнопка «Закрыть все сделки» (MT5)
Утилита для закрытия позиций в один клик для MetaTrader 5. Отображает на графике красную кнопку, при нажатии которой закрываются все открытые позиции с автоматической обработкой отклонений и реквот.
Назначение
Закрытие нескольких позиций по отдельности в условиях волатильности или при проблемах с платформой отнимает время и увеличивает риск проскальзывания. Кнопка «Закрыть все сделки» обеспечивает мгновенную ликвидацию портфеля одним нажатием кнопки.
FREE

Meet ACE VEX! --- Your Spike-Sniffing Market Detective! ️️ Alrighty then! Step right up, ladies and gentlemen, and meet the WILD, most efficient trading animal the market has ever seen! This is -- ACE VEX! -- This beauty is just like me: NO boring, average Expert Advisor here. ACE VEX doesn't trust regular candles; he's a volatility-sniffing, grid-throwing detective who treats every bar like a suspect and only trades the ones that SERIOUSLY MISBEHAVE! --- Picture this: Instead of just ha

Wyckoff fans, enjoy!
Ideally to be used with the Weis Waves indicator, but it can be easily used alone, the Waves Sizer puts the range (in resulting Price movement) done by the Price on its market swings. You can control how accurate or loose will be the swings. This tool is very helpful for visually know how much the Price has traveled in your Timeframe. This way you can confront this level of effort with the resulting Volume, etc... Weis Waves indicator:
https://www.mql5.com/en/market/produc
FREE

Position Size Tool – Smart Risk Management & Trade Execution Panel The Position Size Tool is a powerful and intuitive MT5 panel that simplifies your trading by combining position sizing , risk calculation , risk/reward visualization , and order placement —all in one place. ️ Clean & Functional Interface The tool features a compact, real-time panel with the following: Balance & Equity display Live Price tracking Customizable Risk % input Auto-calculated Lot Size based on SL and Risk Input for S
FREE

Full implementation of Directional Movement System for trading, originally developed by Welles Wilder, with modifications to improve profitability, to reduce the number of unfavorable signals, and with Stop Loss lines.
No re-paint
Features
Buy/sell signals displayed on the chart Stop levels visually indicated on the chart Profit-taking points presented in the indicator window Exit points for unfavorable positions presented in the indicator window Signal confirmation through high/low swing cros

Session Killzone Indicator
Indicator that helps you to identify the killzone times of both London and NewYork sessions which usually is the most times for high volatility and taking liquidity from the market. Killzone times are configurable through indicator parameters. The indicator adjusts the range of the killzones based on the daily trading range.
FREE

Индикатор Chandelier Exit для MT5 – это мощный инструмент, предназначенный для управления сделками путем динамической настройки уровней стоп-лосса на основе волатильности рынка. Он основан на среднем истинном диапазоне (ATR) и следует за трендом, устанавливая уровни стоп-лосса выше или ниже цены в зависимости от направления тренда. Это делает его эффективным инструментом для следования за трендом, торговли на пробоях и управления рисками .
Ключевые особенности: • Динамическое размеще
FREE

Gold Trump EA – The Ultimate Grid Trading Powerhouse Dominate the Markets with a Smart, Adaptive, and Highly Customizable EA! Join Our Telegram Group! First, enter the group Join Here
Then, access the main section Go Here In this channel, you can chat with other traders and download the full PDF guide with all the details about this EA. Join now and stay updated Hey everyone! I'm working on a new version of Cristoforo Gold , and it’s almost ready for release! For the first 10 customers ,

Зоны поддержки и сопротивления на основе объема Volume-based Support and Resistance Zones — это мощный и гибкий индикатор для MetaTrader 5, который помогает трейдерам определять ключевые уровни рынка, формирующиеся из объемных всплесков на фрактальных максимумах и минимумах. Инструмент автоматически строит зоны поддержки и сопротивления в местах, где цена с высокой вероятностью отреагирует, помогая вам торговать с большей уверенностью и ясностью.
Основные особенности Логика на основе объема : з
FREE

Unlock Enhanced Stability and Superior Returns with Our Latest Expert Advisor
Hello! We're a dedicated team of experienced traders and developers with over a decade of combined expertise in the forex markets. Building on our success and continuous market analysis, we've significantly enhanced our trading algorithm to deliver even more stable and profitable performance. Introducing Nexus MultiCurrency EA v3.0—our most advanced iteration designed to maximize your trading potential while maintainin

Multitimeframe Viewer HiddenEdge – HTF Realtime MiniChart A clear view of higher-timeframe structure — directly inside your main chart.
No need to switch timeframes anymore. HiddenEdge Multitimeframe Viewer shows the last candles of any higher timeframe in a compact, real-time panel — so you can see the bigger picture while staying focused on execution. Key Features Realtime update: the current higher-timeframe candle is drawn live, updating every second. Select how many candles to display:
FREE

AstroCycles: Advanced Financial Astronomy Indicator Overview AstroCycles is a sophisticated technical analysis tool developed for the MetaTrader 5 (MQL5) platform. It bridges the gap between orbital mechanics and financial market analysis by calculating precise astronomical cycles and visualizing them directly on your trading chart. Unlike standard indicators that rely on past price data, AstroMaster utilizes high-precision astronomical algorithms (Keplerian Elements and Brown’s Lunar Theory)
FREE

Индикатор сканирует до 15 торговых инструментов и до 21 таймфрейма на наличие высоковероятностных моделей паттерна Двойная вершина/дно с ложными прорывами . Что определяет этот индикатор: Этот индикатор находит особую форму таких паттернов, так называемые двойных вершин и нижних частей, так называемый Двойная вершина/дно с ложными прорывами . Паттерн "Двойная вершина с ложными прорывами" формируется, когда максимальная цена правого плеча выше левого плеча. Паттерн "Двойное дно с ложными прорывам

Gold Rush EA Lite — Advanced XAUUSD Trading System for MT5 This is the Lite version of Gold Rush EA.
It has limited features compared to the full version:
– Runs only on XAUUSD M15
– Maximum lot size capped at 0.10 Key Features Specialized for Gold (XAUUSD) — Optimized to exploit gold’s volatility and liquidity. Multi-Timeframe Confirmation — Signal timeframe (default H1) with execution on lower timeframe (default M15). ARM → TRIGGER → EXECUTE Workflow ARM : Detect overbought/oversold extreme
FREE

Echelon EA – Chart Your Unique Trading Constellation Like the celestial guides that lead explorers through the vast universe, Echelon EA empowers you to create and optimize your very own trading strategies. This versatile system combines advanced grid and martingale techniques with cutting‐edge indicators, offering you an endless palette for designing a strategy that is truly your own. Craft Your Personal Strategy: Infinite Possibilities – Customize every parameter to build a trading system t
FREE

Light Venus - Adaptive Grid Profit Maximizer *Users are encouraged to share their set files that have performed well in the comments section. Why Choose Light Venus? Master the Grid Strategy : Harness the power of grid trading, where orders are strategically placed at calculated intervals. This method allows you to profit from market fluctuations without being glued to your screen. Profit with Precision : Define your profit goals, and let Light Venus handle the rest. Its intelligent system clo
FREE

Safe Trader Advanced – советник для ловли рыночных всплесков с уникальной системой риск-менеджмента для стабильной и безопасной торговли Safe Trader сочетает алгоритм обнаружения всплесков с продуманной системой управления капиталом, обеспечивая точность и защиту в условиях волатильного рынка. Он разработан специально для того, чтобы захватывать и торговать рыночные всплески с высокой точностью и последовательностью. В отличие от типичных роботов, основанных на нестабильных сигналах или переопти
This indicator is the mql version of the Linear Regression Candles indicator. There are many linear regression indicators out there, most of them draw lines or channels, but this one actually draws a chart.This script includes features such as linear regression for open, high, low, and close prices, signal smoothing with simple or exponential moving averages. Find out more here: https://www.mql5.com/en/users/rashedsamir/seller I welcome your suggestion for improving the indicator
To incre
FREE

Developed by Charles Le Beau and featured in Alexander Elder's books, the Chandelier Exit sets a trailing stop-loss based on the Average True Range (ATR). The indicator is designed to keep traders in a trend and prevent an early exit as long as the trend extends. Typically, the Chandelier Exit will be above prices during a downtrend and below prices during an uptrend.
Calculation
The original Chandelier Exit formula consists of three parts: a period high or period low, the Average True Rang
FREE

Infinite Storm EA - это безопасный и полностью автоматический советник, который анализирует рыночные тенденции и движения цен и благодаря этому может достигать высоких показателей прибыльных сделок. У каждого ордера есть стоп-лосс (реальный или виртуальный), а советник реализовал расширенные функции фильтрации вместе с защитой от спреда и проскальзывания. Этот советник НЕ использует какие-либо опасные стратегии, такие как Мартингейл, Сетка или Арбитраж. Этот советник полностью настраивается пол

Detailed blogpost: https://www.mql5.com/en/blogs/post/766378
Key Features
Adaptive Upper/Lower bands Smooth Center Line Customizable Length (sensitivity) Non-Repainting (only current ongoing bar is updated every "Refresh After Ticks" number of ticks) Multiple Price Sources - Choose from close, open, high, low, median, typical, or weighted close Components:
The Basis Line The smooth center line represents the weighted average of price. Think of this as the "true" price level when all the noise
FREE

Build your EA with Build EA Simple, with it you can build your strategy with the available indicators and tools.
Build EA Simple does not have any defined strategy, but with it you can use combinations of indicators and use them as signals or filters and build your strategy!
Build EA Simple is a simplified version of Build EA that doesn't have as many tools. Discover Build EA Pro https://www.mql5.com/pt/market/product/88859?source=Unknown%3Ahttps%3A%2F%2Fwww.mql5.com%2Fpt%2Fmarket%2Fmy
Indi
FREE
*** ATR --------------------------------- RSI ***
MQLuxe B1 is a special MT5 Robot that is a fully automated trading system that doesn't require any special skills from you. Just fire up this EA and rest. You don't need to set up anything, EA will do everything for you. EA is adapted to work on small deposits. Combining the Average True Range (ATR) indicator with the Relative Strength Index (RSI) can create a robust trading strategy in the Forex market. This combination can help you i
FREE

WYSIWYG Candle for WYSIWYG ORB Smart Breakout Candles is a professional multi-method breakout detection indicator that combines ATR, Bollinger Bands, Opening Range Breakout (ORB), and Squeeze Detection to identify high-probability breakout opportunities across all financial instruments. This indicator provides real-time visual signals through colored candles and precise arrow placements, making it ideal for traders seeking reliable volatility-based entries. "Use in conjunction with the WYS
FREE
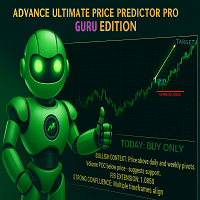
THE ADVANCE PRICE PREDICTOR - GURU EDITION Tired of Guesswork?
Meet the AI-Powered "Almighty Predictor" – Pinpoints High-Probability Targets Before the Move, With Surgical Precision
Stop chasing pips. Start attracting them. Our proprietary algorithm fuses Multi-Timeframe Analysis + Smart Money Concepts + Real-Time Confluence Scoring to give you a clear, calculated edge on every trade.
Are You Constantly Wondering…
"Is this the top, or will it keep going?"
"Where should I real
FREE
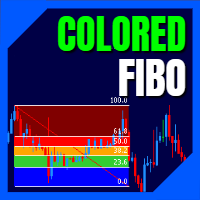
LT Colored Fibo is a simple indicator that paints the price zones between Fibonacci Retracement levels. Its configuration is extremely simple. It is possible to change the colors of each level of the retracement, choose between background or front of the chart and also work only with the current asset or all open. If you found a bug or have any suggestion for improvement, please contact me. Enjoy!
This is a free indicator, but it took hours to develop. If you want to pay me a coffee, I apprecia
FREE

Bitcoin Rocket Pro AI Robot EA is a highly advanced automated trading system for MetaTrader 5, specifically developed for intraday trading on the BTCUSD pair. It integrates a powerful combination of Elliott Wave theory, harmonic pattern detection, artificial intelligence, and machine learning algorithms to deliver accurate trade signals and intelligent position management. At the core of Bitcoin Rocket Pro AI is its multi-layered analysis system. The EA uses Elliott Wave principles to map the na

Relative Volume or RVOL is an indicator that averages the volume of X amount of days, making it easy to compare sessions volumes.
The histogram only has 3 colors:
Green - Above average volume
Yellow - Average volume
Red - Below average volume
The default setting is 20 days, which corresponds more or less to a month of trading.
In this version is possible to choose between tick and real volumes (if you are using a broker which offers future contracts)
With the data obtained from this in
FREE

MACD Support–Resistance Candle Analyzer — Professional This indicator enhances the classic MACD by combining momentum analysis with dynamic Support & Resistance detection , giving traders a clearer view of breakout strength and market structure. It transforms price action into color-coded MACD candles , highlights SnR break levels , and provides clean visual confirmation of trend continuation or reversal. Ideal for scalpers, intraday traders, and swing traders who rely on fast, structured trend
FREE
RSI + Grid Distance Strategy with 200 EMA Filter Overview The RSI + Grid Distance Strategy integrates momentum and mean-reversion principles within a structured grid trading framework. By combining the Relative Strength Index (RSI) with dynamic grid levels and a 200-period Exponential Moving Average (EMA) filter, the system seeks to optimize trade timing, trend alignment, and overall position efficiency. Core Logic 1. RSI Signal Generation
The algorithm utilizes a 17-period RSI , identifying b

Session Box Indicator for MetaTrader 5
Description: The SessionBox indicator is designed to visually represent the trading sessions on a chart, specifically the Asian, European, and American sessions. This indicator draws customizable rectangles around each session, allowing traders to easily identify different trading periods. It also includes labels to denote each session, enhancing clarity.
Users only need to input the session start and end hours in their server time. Please note, the Asia
FREE

Free forever simple pip meter for MT5 with customizable font color. Display profit or loss in both points count and currency value. Supports 4 currency symbols ($,€,£ ,¥). For unsupported currencies, it shows a 3-character currency short form. Enhance your trading interface with clarity and precision. Easy to use and tailored for diverse Forex traders. Perfect for MT5!
FREE

Кнопка Phoenix Breakeven (MT5)
Инструмент для корректировки стоп-лоссов в MetaTrader 5 одним щелчком мыши. Перемещает все открытые позиции в безубыточное положение одним нажатием кнопки, устраняя риск потери прибыли после того, как сделки приносят прибыль.
Назначение
Ручная настройка стоп-лоссов по нескольким позициям во время активных сделок отнимает время и вызывает колебания. Кнопка Phoenix Breakeven обеспечивает мгновенную защиту от рисков, позволяя трейдерам одним нажатием зафиксировать
FREE

ClickDrag легко рисует линии и перемещает объекты на графике.
Нажмите и затем перетащите мышь, чтобы начать рисовать линию тренда.
Перемещение мыши по горизонтали рисует линию цены.
Перемещение мыши по вертикали рисует линию даты.
Существующие линии и объекты можно перемещать с помощью щелчка и перетаскивания.
Отображает цену и разницу во времени между начальной и конечной точкой.
После запуска Нажмите и перетащите,
Встряхните влево и вправо, чтобы изменить цвет.
Встряхните вверх и вн
FREE

MSX Unified Hybrid EA — Lite Version MSX Unified Hybrid EA (Lite) is a free demonstration Expert Advisor designed to showcase the core internal hybrid trend engine used in the MSX trading systems. This Lite version focuses on entry and exit behavior only , allowing users to observe how the strategy reacts to real market conditions without advanced money management or capital protection features. ️ Core Strategy Logic The Expert Advisor operates using an internally coded hybrid trend engine ,
FREE

"The Easiest 3 EMA Technique + Grid Scalping (High WinRate)" describes a specific strategy in the realm of financial trading, with a focus on simplicity and effectiveness. Let's break down the key components:
1. **3 EMA Technique**: EMA stands for Exponential Moving Average, a type of moving average that places a greater weight and significance on the most recent data points. The '3 EMA' likely refers to a technique that uses three different EMAs with varying time frames to identify potential
FREE

The TMA Centered Bands Indicator for MT5 draws bands on the chart and shows the overall price trend. It displays three bands - the lower and upper boundaries of the channel and the median. The bands are made up of moving averages, and each of them has an MA period. The name TMA comes from triangular moving averages, as the indicator draws triangular bands. The price will fluctuate between these ranges whenever the trend changes direction, thus creating entry and exit points. How to trade
FREE
RSI Bollinger DualStrike Signals offers a clear and structured approach to identifying areas that may be favorable for potential trend reversals. By combining the RSI with Bollinger Bands, the indicator highlights moments when price shows signs of pressure or loss of momentum. The BUY/SELL signals help traders make more organized and disciplined decisions. It is a useful tool for scalping, day trading, or swing trading not to predict the market, but to improve the reading and understanding of pr
FREE

For those who love to follow Volume behavior here it is a little indicator that could be used as a replacement for the old and standard MT5 built-in volume indicator. The trick here is that this indicator paints the volume histogram based on the direction of the candle giving to the trader a quick "Heads Up" on what is happening, visually! It could be used to study and see for instance, the volume and past bars volume during (or, reaching) a peak (Tops and Bottoms). UP candles are shown in pale
FREE

Данный индикатор определяет внутренние бары нескольких диапазонов, тем самым упрощая обнаружение и принятие мер по пробою внутреннего бара трейдерам, торгующим по ценовому действию. Прост в понимании и использовании Настраиваемый выбор цвета В индикаторе предусмотрены визуальные/почтовые/push/звуковые уведомления. Индикатор не перерисовывается и не рисует на истории Внутренним называется бар (или серия баров), который полностью находится в пределах диапазона предыдущего бара. Синяя рамка - это б
FREE

Официальная цена релиза 65$ только за первые 1 0 экземпляров, следующая цена 125$ Gold Scalper System — это многофункциональная торговая система, объединяющая стратегию прорыва ключевых уровней ликвидности с подтверждением и встроенный модуль Smart DOM Pro, для анализа рыночной глубины. Система определяет зоны скопления лимитных ордеров, отслеживает активность на уровнях поддержки и сопротивления и генерирует сигналы в момент их прорыва. Smart DOM Pro визуал
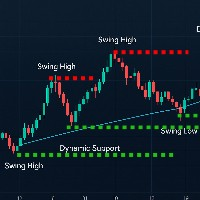
A professional swing point detection indicator that identifies key highs and lows with precision. Features include: Smart Detection : Identifies swing highs/lows based on customizable left/right bar analysis Visual Alerts : Clear arrows and labels (optional) mark swing points Dynamic Lines : Draws support/resistance lines that disappear when price touches them (toggle on/off) Real-Time Alerts : Sound and popup notifications for new swings Non-Intrusive : Preserves all manual chart drawings Perfe
FREE

Indicator Name: CM EMA Trend Bars Overview: The CM EMA Trend Bars indicator is a straightforward yet effective tool that changes the color of price bars based on their relationship to the Exponential Moving Average (EMA). This visual cue helps traders quickly identify trend direction and potential trading opportunities. Key Features: Dynamic Bar Coloring: The indicator changes the color of the bars depending on whether they are above or below the EMA, providing a clear visual representation of t
FREE
UPD: https://t.me/mql5_neuroExt актуальная версия и обсуждение.
- за успешные созданные базы обучения предоставлю советник во временное пользование бесплатно.
- базы обучения будут выкладываться по мере обучения.
- обучение требует примерно 20 эпох. Возможно применять одну из двух стратегий - либо торговля в 2-х направлениях, либо - использовать СЛ. При использовании СЛ результаты торговли будут идентичны результатам обучения. Так как при обучении используется только 1 ордер одновременно.
FREE
The Multi-Frame MACD Indicator is a robust MetaTrader 5 (MT5) indicator that utilizes the Moving Average Convergence Divergence (MACD) to analyze trends across multiple timeframes. This indicator synchronizes MACD-based trend signals from up to nine timeframes (M1, M5, M15, M30, H1, H4, D1, W1, MN1) and presents them with clear visual cues, including a colored MACD line, signal arrows, and a customizable dashboard. Perfect for traders seeking momentum and trend reversal insights. Features Multi-
FREE
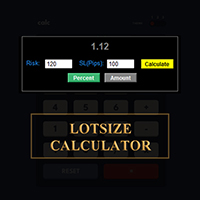
РАССЧИТАЙТЕ РАЗМЕР ВАШЕГО ЛОТКА ПРЯМО ЗДЕСЬ, НА METATRADER!!!
Привет, трейдеры! Вы ориентированы на управление рисками? Если да, то это для вас. Меня зовут Ибрагим, и я разработал инструмент, который поможет вам рассчитать размер лота на основе процента риска относительно баланса вашего счёта. Этот инструмент также поможет вам рассчитать размер лота, если вы готовы рисковать абсолютным значением, а не указывать риск в процентах. Например, вы можете указать, что готовы рисковать 100 долларами о
FREE

Probability emerges to record higher prices when RVi breaks out oscillator historical resistance level. It's strongly encouraged to confirm price breakout with oscillator breakout since they have comparable effects to price breaking support and resistance levels; surely, short trades will have the same perception. As advantage, a lot of times oscillator breakout precedes price breakout as early alert to upcoming event as illustrated by last screenshot. Furthermore, divergence is confirmed in
FREE

Fibomathe Indicator: Support and Resistance Tool for MT5 The Fibomathe Indicator is a technical analysis tool designed for MetaTrader 5 (MT5) that assists traders in identifying support and resistance levels, take-profit zones, and additional price projection areas. It is suitable for traders who use structured approaches to analyze price action and manage trades. Key Features Support and Resistance Levels:
Allows users to define and adjust support and resistance levels directly on the chart.
FREE

Совершение сделок может быть довольно утомительным, когда вам нужно смотреть на несколько вещей одновременно.
Формат свечей, поддержек, сопротивлений, графиков, новостей и индикаторов.
Этот инструмент призван облегчить анализ индикатора ADX. Раскрашивает свечи в зависимости от уровней индикатора и линий DI.
Период, лимит индикатора и цвета свечей настраиваются. Вы также можете разместить наглядное пособие в нижней правой части графика, чтобы просмотреть значения ADX, DI + и DI-.
FREE

СПЕЦИАЛЬНОЕ ПРЕДЛОЖЕНИЕ НА ЗАПУСК – Бесплатно до 05.01.2026 или для первых 100 загрузок (что наступит раньше) Если вы видите эту страницу, значит вы всё ещё находитесь в рамках эксклюзивного периода запуска. После достижения лимита индикатор будет продаваться на Market MQL5 на стандартных условиях. Mikko Breakout Indicator – Интеллектуальное определение пробоев для MetaTrader 5 Профессиональный индикатор пробоев для MetaTrader 5, предназначенный для Forex, индексов и криптовалют. SqueezeMAX Pro
FREE
Специальное предложение : ВСЕ ИНСТРУМЕНТЫ , всего по $35 за каждый! Новые инструменты будут стоить $30 в течение первой недели или для первых 3 покупок ! Канал Trading Tools на MQL5 : присоединяйтесь к моему каналу MQL5, чтобы получать последние новости от меня Этот индикатор визуализирует уровни ликвидности и зоны ликвидности на основе концепций ICT, а также Liquidity Voids для подсветки однонаправленных ценовых смещений. Он фокусируется на местах, где склонны скаплива

This utility here gives you a lot of bang for your buck by being a 2 in 1 custom candles generator. For the price of 1 utility, you get 2 !! It creates offline charts that will behave like a live chart.
It has 2 modes of operation: Tick and Range
These are not time based charts. They will enhance your analysis giving you an edge by filtering a lot of useless and confusing price noise, leaving behind the most important price levels/market structure.
When set to "Tick" mode, it will generate

Carbon Drift Price today is 70. When 5 copies are sold, the new price will be 90. Don’t miss the early slot. Currently sold: 4 . Contact me now to get a demo-account test version.
Вступите в новую эру автоматизированной торговли с Carbon Drift —EA, разработанным для интерпретации природной “динамики потока” рынка. Созданный для точности, эта система сосредоточена на чтении изменений импульса в реальном времени, выявлении зон исчерпания и выполнении входов в моменты, когда исчерпание тренда встр

Introducing a sophisticated BreakOut and RecoveryZone tool designed to empower traders in any market scenario, facilitating the optimization of trade opportunities.
The core strategy revolves around executing price breakouts using BuyStop and SellStop orders to achieve specific profit targets in dollars. Notably, traders can manually set the BuyStop and SellStop levels by simply clicking and dragging lines on the chart (FixedZone=true is required).
For swift market entry, you can drag the BuyS
FREE

Big bull scalper Short Description Master market structure with the precision of the popular Big bull scalper This tool automatically identifies key pivot highs and lows, plotting unique "angling" trend lines that dynamically define market context. It visually confirms Breaks of Structure (BOS) and Changes of Character (CHoCH), removing all guesswork from your analysis.
Key Features: Automatic Pivot Detection Instantly spots significant swing highs and lows. Dynamic Angling Lines Visual
FREE

EXPERT for YOUR OWN ACCOUNT - Этот советник был спроектирован, разработан и оптимизирован специально для вашего собственного использования.
Это мощный советник (EA) для использования лучших и самых больших возможностей в инструменте AUDUSD, во всех фазах тренда, от начала до конца, на таймфрейме H1 и на платформе MT5. Впечатляющая точность, производительность и последовательность в бэктестах за последние 3 года. Советник работает как охотник, снайпер, анализируя движение цены, ее силу и тренд,
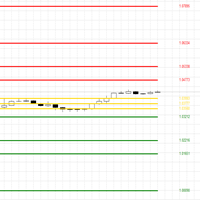
Индикатор CPR — это мощный инструмент технического анализа, разработанный для идентификации ключевых уровней поддержки и сопротивления на ваших графиках MetaTrader 5. Он рассчитывает Центральный Пивот (CP) как среднее значение максимальной, минимальной и закрывающей цен предыдущего дня, предоставляя центральную точку отсчета. Рассчитывает и отображает 11 уровней (CP, BC, TC, S1-S4, R1-R4) Настраиваемый период ретроспективы (по умолчанию: 5 дней) Возможность включения/отключения ценовых меток с р
FREE

AlphaPrice MT5 – это торговый советник, разработанный для работы на рынке Форекс и других финансовых рынках через платформу MetaTrader 5. Он основан на стратегии торговли ценовыми импульсами, что позволяет эффективно захватывать сильные движения цены и минимизировать риски в периоды застоя. Советник использует минимальные настройки, что делает его удобным для быстрого запуска, и при этом полностью исключает опасные методы, такие как мартингейл и сеточные стратегии. Ключевые особенности: То
FREE
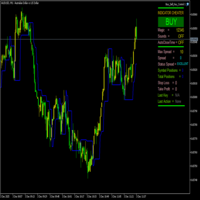
FractalBreakoutLevels — индикатор динамических уровней, построенных на основе анализа ценовых движений. Индикатор использует комбинацию исторических ценовых данных для определения ключевых уровней, которые могут служить ориентирами при торговле. Общее описание работы: Индикатор анализирует структуру рынка, выявляя значимые ценовые уровни на основе соотношения текущих и исторических ценовых данных. Он строит непрерывную линию, которая адаптируется к изменяющимся рыночным условиям, выполняя функ
FREE

Power Hedging X EA | Advanced Risk Management & Profit Protection Power Hedging X is a next-generation Expert Advisor designed for traders who want to control risk, maximize profit potential, and protect their accounts using strategic hedging techniques. This EA intelligently manages buy and sell positions to balance exposure, reduce drawdown, and secure profits even in volatile market conditions. Key Features: Automated Hedging Logic (Buy & Sell Balance)
Smart Recovery System for D
FREE

MACD Divergence Scanner is a multi-timeframe and multi-symbol dashboard and alert that checks all timeframes and symbols to find regular and hidden divergences between price chart and MACD indicator. This divergence scanner is integrated with support and resistance zones so you can check the MACD divergences in the most important areas of the chart to find trend reversals in the price chart. Download demo version (works on M4,M6,M12,M20,H3,H8 timeframes of 20 symbols of Market Watch window)

Manual Trade Manager for XAUUSD (v1 – Always BreakEven) – FREE Take your manual gold trading to the next level with this lightweight yet powerful trade management tool.
This Expert Advisor does not open trades in live trading — it is specifically designed to manage manually placed orders on XAUUSD , helping you automate risk control through smart break-even and trailing stop logic. Key Features: Break-even Stop Loss : Automatically adjusts SL to break even when a specified profit level is reache
FREE
MetaTrader Маркет - лучшее место для продажи торговых роботов и технических индикаторов.
Вам необходимо только написать востребованную программу для платформы MetaTrader, красиво оформить и добавить хорошее описание. Мы поможем вам опубликовать продукт в сервисе Маркет, где его могут купить миллионы пользователей MetaTrader. Так что занимайтесь только непосредственно своим делом - пишите программы для автотрейдинга.
Вы упускаете торговые возможности:
- Бесплатные приложения для трейдинга
- 8 000+ сигналов для копирования
- Экономические новости для анализа финансовых рынков
Регистрация
Вход
Если у вас нет учетной записи, зарегистрируйтесь
Для авторизации и пользования сайтом MQL5.com необходимо разрешить использование файлов Сookie.
Пожалуйста, включите в вашем браузере данную настройку, иначе вы не сможете авторизоваться.