Смотри обучающее видео по маркету на YouTube
Как купить торгового робота или индикатор
Запусти робота на
виртуальном хостинге
виртуальном хостинге
Протестируй индикатор/робота перед покупкой
Хочешь зарабатывать в Маркете?
Как подать продукт, чтобы его покупали
Торговые роботы и индикаторы для MetaTrader 5 - 53

Haven Fibonacci Volume Profiles — Ваш Автоматический Аналитик Рыночных Диапазонов Представляем Haven Fibonacci Volume Profiles — мощный инструмент, который выводит анализ рынка на новый уровень. Этот индикатор автоматически определяет ключевые ценовые диапазоны, построенные по значимым точкам разворота (пивотам), и накладывает на каждый из них детализированный Профиль Объема вместе с уровнями Фибоначчи. Это позволяет трейдерам мгновенно видеть, где сосредоточена ликвидность и где находятся истин

Reward Multiplier is a semi-automatic trade manager based on pyramid trading that opens additional orders with the running profit of your trades to maximize return exponentially without increasing the risk.Unlike other similar EAs, this tool shows potential profit/loss and reward to risk ratio before even entering the first trade! Download full version here ( In the mini version. Starting lot is fixed at 0.01 (or minimum allowed lot size ) Guide + tips here MT4 version here You only open the
FREE

PipsCounter Basic — это индикатор для MetaTrader 5, который в реальном времени отображает изменение позиций в пунктах и предоставляет ежедневное резюме по закрытым сделкам. Вся информация выводится непосредственно в основном окне графика в понятном и ненавязчивом формате. Возможности Отслеживание пунктов в реальном времени
Непрерывное обновление разницы в пунктах для каждой активной позиции на каждом тике рынка. Ежедневный итог в пунктах
Отображает чистое значение в пунктах по всем закрытым сд
FREE

Multi-Currency Strength Dashboard PRO MT5 (v2.6) – Индикатор силы валют с визуальной панелью Multi-Currency Strength Dashboard PRO — это индикатор для MetaTrader 5 , который измеряет относительную силу 8 основных валют (USD, EUR, GBP, JPY, CHF, CAD, AUD, NZD) в реальном времени, анализируя до 28 валютных пар Forex (в зависимости от доступных у вашего брокера символов). Цель инструмента — дать быстрый и структурированный обзор силы/слабости валют, чтобы помочь выбирать пары для анализа (сильная в

DA 100€/$ A 400.000 IN UN ANNO !!! SI è PROPRIO COSI QUESTO BOT METTE AUTOMATICAMENET L'INTERESSE COMPOSTO. ( SCARICARE IL FILE SET DA INSERIRE NELLE IMPOSTAZIONI ALTRIMENTI IL BACK TEST NON FA GLI STESSI PROFITTI, LO TROVATE SOTTO I COMMENTI )
G-load Pro. MARCHIO REGISTRATO è L'UNICO ORIGINALE I TEST SONO STATI FATTI SU XMGLOBAL ( NO ECN) ( SCARICARE IL FILE SET DA INSERIRE NELLE IMPOSTAZIONI ALTRIMENTI IL BACK TEST NON FA GLI STESSI PROFITTI, LO TROVATE SOTTO I COMMENTI )
TIME FRAME h1
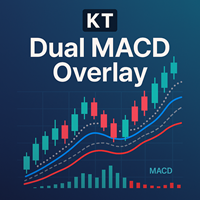
KT Dual MACD Overlay выводит два полноценных осциллятора MACD прямо на ценовой график: один для текущего таймфрейма, другой — с более высокого таймфрейма. Быстрый MACD фиксирует краткосрочный импульс, а медленный MACD удерживает вас в русле широкой тенденции. Так как оба слоя расположены поверх свечей, вы получаете полный обзор рыночного импульса без переключения окон или графиков.
Buy Entries
Основной вход в лонг: синяя вертикальная линия появляется при начале восходящего тренда. Дополнительны

USD STRENGHT VERSUS MARKET USD (DXY) Versus Market Panel is a professional visual indicator designed to analyze US Dollar strength and pressure against major trading symbols in real time. The indicator compares USD performance (based on DXY logic or internal strength calculation) versus selected symbols, allowing traders to quickly identify dominant currency flow, relative strength, and market bias from a single panel view. Built with a clean, lightweight, and non-intrusive panel , this tool hel
FREE

INTRODUCTION Maximize Your Trading Potential Gold Miner Pro is an automated trading tool designed for the gold market (XAUUSD). It applies a precise scalping strategy powered by mathematical models and statistical analysis to detect favorable market setups. Specializing in gold trading, Gold Miner Pro works for you 24/7, minimizing risk and maximizing trading performance. Let Gold Miner Pro be your trusted companion in your gold investment journey!
RECOMMENDATIONS - Account Type: Use a Cent Acc

Gold Range Breakout Bot for MetaTrader 5 This Expert Advisor trades based on a defined price range between 3:00 and 6:00 AM server time on XAUUSD. When the price breaks out of this range, a single trade is triggered — either long or short. The trade automatically closes at 6:55 PM. A fixed stop loss of 1% is used. The strategy follows a time-based logic with daily resets and no overnight exposure. No indicators are required. Built using structured conditions and tested logic for controlled execu
FREE

INTRODUCTION Gold Rush Turbo – Ride the Fastest Wave of Gold Trading Experience the thrill of fast-paced gold trading. Gold Rush Turbo is a high-performance, medium-risk Expert Advisor designed for traders who thrive in dynamic market conditions. Built for aggressive scalping on XAUUSD (gold), it uses rapid market entries, tight stops, and momentum-based logic to capture short-term price movements. If you’re ready for high-speed decision-making, Gold Rush Turbo keeps your strategy sharp and your

Представляем CandleBot - ваш инструмент для идентификации и торговли свечными паттернами! С CandleBot вы легко определите бычьи и медвежьи поглощения, утреннюю и вечернюю звезду, а также сигналы молота, что даст вам мощное преимущество на рынке. Свечные паттерны, полученные из цен открытия, максимальной, минимальной и закрытия за определенный период, служат визуальным отражением движения цен, помогая трейдерам анализировать настроения на рынке и предсказывать возможные развороты или продолжения
FREE

Dom Book HeatMAP Lightning Trading Panel Professional-Grade Microstructure Lightning Trading Panel · User Manual
Major update explanation: On January 10, 2016, automatic trading EA and control panel were added. For detailed parameter configuration, please refer to the latter half of this article.
Important Note: 1、As this is a heatmap, footprint map, and DOM trading panel tool based on EA, its demo version cannot function properly and only works in a live environment! 2、Enabling high-performa
Simple Spread Indicator (SSI) is a simple and lightweight indicator that displays the current spread value directly on the main chart window.
It helps traders instantly recognize market liquidity conditions and trading costs without opening additional panels or tools. Features Real-time spread display on the main chart Customizable position and font size Minimal system load and no data buffering Useful for scalping and low-spread strategy monitoring How it works The indicator calculates the diff
FREE

Several assets in several markets have the behavior of using specific numbers as Force Numbers, where support, resistance and price thrust is created. Let this indicator draw those levels of support and resistance for you. You can also stack it to show different level of Prices! This technique is being used by Tape Readers and Order Flow traders all over the world for a long time. Give it a try. Challenge yourself to study new ways of Price Action!
SETTINGS
What Price reference to use in the c
FREE

Откройте для себя mrKrabsGold – Kelly MultiTP — ваш ультра-оптимизированный скальпинг-робот, созданный для максимизации прибыли и контроля рисков: Ключевые возможности: Стратегия скальпинга и хеджирования: автоматически выявляет и использует быстрые развороты тренда с хеджированием для ограничения просадок. Динамический размер по Келли: рассчитывает оптимальный объем позиции на основе вашей истории сделок с настраиваемым коэффициентом Келли. Многоступенчатый тейк-профит: фиксир
FREE

Slave EA (v1.x) – All Key Features Signal Reader
Grabs Master’s trade signals (via GlobalVariable or CSV) in real time. Most Powerful Future
• Copy from any read only or investor password account also
Trade Copier
• Opens new trades to match Master
• Updates SL/TP instantly when Master modifies
• Closes trades the moment Master closes them ️ Smart Filters & Options
• Symbol Filter – Copy only specified pairs or “ALL”
• Direction Filter – BUY only, SELL only, or BOTH
•
FREE

GoldMacher – Session-Aware XAUUSD EA Start from $50 – Low Leverage 1:20 or 1:10 – Fixed Lot – No Martingale Contact me for the manual for back testing pls LAST COPY available at $90 MT4 Version available here Trade gold with structure, timing, and discipline.
GoldMacher is built for traders who want clarity, not complexity. It focuses on the sessions and market conditions where XAUUSD tends to behave in repeatable ways — and it stays quiet when conditions are poor. Why GoldMacher? Session int

Hetti is a Martingale based EA works with netting mode on mt5 platform. Signals for buy or sell orders are based on Aligator and Bollinger band indicators. Recommended to run on cent based account with at least 200000 when operating with higher starting lot sizes. (max3)
You can change many setting to find the optimal operation for every vehicle you choose to run. Lets see an example for settings on EURUSD pair from the period of 2016-2023 with every tick based on real ticks. (screenshots
FREE

Cycle Sniper MT5 Cycle Sniper MT4 Version and definitions : https://www.mql5.com/en/market/product/51950 Important Notes: MT5 Version does not include Breakout Mode and Late Entry Mode Features.
MT5 Version does not include RSI and MFI filter. **Please contact us after your purchase and we will send you the complimentary indicators to complete the system.**
This indicator does not send any signal without a reason...You can observe and analyze the indicator and the signals it sends Cycle Sni

Этот индикатор сочетает в себе классические индикаторы MACD и Zigzag для обнаружения расхождения между ценой и индикаторами. Он также использует передовые технологии искусственного интеллекта (ИИ) для обнаружения достоверности расхождения. MACD известен как "король индикаторов", а Zigzag также является очень полезным индикатором. Объединяя эти два индикатора, этот индикатор использует преимущества обоих. Обнаружение расхождения является вероятностной проблемой. Часто расхождения возникают только

CandleForce Pro: The Ultimate Decision-Support Dashboard for Modern Traders Introduction: Overcoming the Chaos of Modern Markets
In today's hyper-connected financial markets, the modern trader faces a paradox of choice. We are inundated with an endless stream of data, indicators, news, and strategies, all promising to unlock the secrets of profitable trading. This constant influx often leads to "analysis paralysis"—a state of cognitive overload where conflicting signals create confusion, hesit
FREE
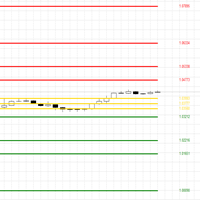
Индикатор CPR — это мощный инструмент технического анализа, разработанный для идентификации ключевых уровней поддержки и сопротивления на ваших графиках MetaTrader 5. Он рассчитывает Центральный Пивот (CP) как среднее значение максимальной, минимальной и закрывающей цен предыдущего дня, предоставляя центральную точку отсчета. Рассчитывает и отображает 11 уровней (CP, BC, TC, S1-S4, R1-R4) Настраиваемый период ретроспективы (по умолчанию: 5 дней) Возможность включения/отключения ценовых меток с р
FREE

Description This is a Utility tool for MT5 which will make our chart analysis task quite more efficient and save large amount of time. As for chart analysis, some are watching out several symbol simultaneously with single timeframe and others are trading only one single pair with multi timeframe analysis. For both, a common troublesome issue is “scroll chart to look back” or “draw chart objects” in multi charts at the same time. Especially for those who are trading with multi timeframe soluti

"Представляем вам NakaTrend: ваш идеальный индикатор тренда для MetaTrader 5!
Готовы к революции в вашем опыте торговли? Знакомьтесь с NakaTrend, вашим надежным индикатором для определения изменений тренда с точностью и легкостью.
С NakaTrend вы никогда не упустите возможность скапитализировать на изменениях рынка. Когда появляется бычий тренд, NakaTrend сигнализирует о нем зеленым знаком доллара, подталкивая вас к оформлению ордера на покупку. И когда наступает медвежий период, появляется кр
FREE

The Monthly Weekly Open Line is an indicator that plots: The current month open line that will extend till the last week on the month. Weekly lines that span the look back days period that you have set . Each line will extend from the respective weekly Monday zero GMT till friday of the respective week. Monthly and Weekly open lines can be used to build very powerfull anc consistent trading strategies. They act as natural S/R price barriers.
FREE
Advanced MACD Indicator with 6 Colors & Adjustable Line Thickness Elevate your trading charts with this fully customizable MACD indicator for MetaTrader 4/5. With six independent color slots and per-line thickness controls, you can tailor every element to your exact preferences. Key Features Six Separate Color Slots
Customize each component with its own color: MACD Line Signal Line Histogram Bars (Bullish) Histogram Bars (Bearish) Zero Line Adjustable Line Thickness
Choose any thickness—from e
FREE

EMA SMA Gold Scalper is a precision scalping indicator developed for XAUUSD (Gold) traders. It combines the dynamic responsiveness of the 55 EMA (High/Low) with the broader market direction filter of the 200 SMA , delivering clean and actionable Buy/Sell signals. The indicator also includes real-time "Live Blue Arrows" , which notify traders when an entry setup is forming—giving you a critical edge before the candle closes. This tool is optimized and recommend for M5 scalping a
FREE

2025 Spike Killer Dashboard - Advanced Trading Signals & Market Analytics Transform Your Trading with Intelligent Market Insights! The 2025 Spike Killer Dashboard is a powerful MQL5 indicator that combines cutting-edge signal generation with an intuitive crystal dashboard for real-time market analysis. Designed for traders who demand precision and clarity, this all-in-one tool delivers actionable signals and comprehensive market metrics at a glance. Key Features: Dual Signal System Shved S

Introduction To Time Box Indicator Time Box Indicator is a must have indicator for any trader. It will display daily, weekly and Monthly box according to your preferences. Yet, you can extend any important price levels in your chart automatically. You can use them as the significant support and resistance levels. It is very simple but effective tool for your trading.
Graphic Setting Use White Chart Line Style for Current Open price
Daily Setting Update Timeframe for daily box Number of days to
FREE

It is a system with many options to help each user find their own settings. There are possibilities to use a filter based on two averages, as well as the choice of whether the system will work at certain hours of the market. The default settings are tested for the eurusd pair. I would recommend that each user do their own testing and find settings that suit their preferences. This is not a ready-made system that you will use without working on it. But it is a good tool to build each user a strat
FREE

This utility EA will display simple renko, hence the name essential renko. The renko will be shown in a new tab and using custom symbol.
Please do note (especially for those who new to Renko), that Renko does not follow timeline as it will follow price movement.
That's why it has a lot of potential where you can attach any EA that you want and use any custom indicator in this new custom symbol for renko. Always use M1 timeframe.
Most of the time you don't need to change anything. But if you d
FREE

В Clock GMT Live есть все, что вам нужно, чтобы узнать больше о нашем брокере, много раз вы задавались вопросом, на каком GMT я нахожусь или над каким GMT работает мой брокер, что ж, с помощью этого инструмента вы сможете узнать в режиме реального времени как GMT смещение времени брокера и вашего местного времени, вы также будете постоянно знать пинг брокера Просто поместив его на время суток, вы можете получить информацию
Цена увеличивается за каждое приобретение, с этим мы защитим, чтобы нем
FREE
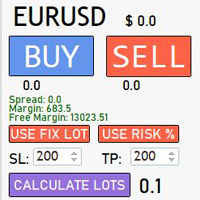
Easy Dashboard MT5 is more than just a trade management tool - it's a powerful solution designed to help you manage risk and make better trading decisions in less time. With its sleek design and user-friendly interface, Easy Dashboard MT5 makes trading on the Meta Trader 5 platform a breeze. Best MT5 Dash Board for manual traders to boost their performance.
One of the key features of Easy Dashboard MT5 is its ability to buy, sell, and manage limit and stop orders with a fixed lot or by using ris
FREE

This trading robot is based on a candlestick pattern and RSI indicator strategy. It looks for candles that have a small body relative to their shadows, indicating indecision in the market. It also checks if these candles are placed at the pivot point. If the close of one of the next candles breaks the resistance line from below and the RSI is above the MA of RSI, then the robot opens a buy order. If the close of one of the next candles breaks the support line from above and the RSI is below th
FREE

Описание советника: USDJPY & EURUSD Trading Buddy EA MT5 BOT Версия: 1.03 Инструменты: USDJPY, EURUSD Платформа: MetaTrader 5 (MT5) Тип советника: трендовый, система пересечения скользящих средних Обзор USDJPY & EURUSD Trading Buddy EA MT5 BOT — полностью автоматизированный советник, предназначенный для торговли парами USDJPY и EURUSD на платформе MetaTrader 5. Советник использует стратегию тройного пересечения скользящих средних для определения направления тренда и открытия сделок. Встроенные ф

APICT Chart Patterns – Trend Line & Pattern Recognition for MT5 Enhance your technical analysis with the APICT Chart Patterns Indicator — an advanced tool for automatic pattern and trend line detection in MetaTrader 5. Key Features Automatic Pattern Detection: Identifies over 10 classic chart patterns, including pennants, wedges, channels, and double tops/bottoms. Real-Time Trend Lines: Draws support and resistance lines using smart algorithms. Custom Sensitivity: Adjust detection for major or
FREE

The Forex Breakout Scalping EA follows a scalping breakout strategy. It trades the breakouts from relative highs and lows. For the entry stop orders are used for the fastest possible execution. Profits can be secured by the adjustable trailing stop .This is also a high frequency breakout trading system. It produces high return if compounded properly with high speen internet and low commission. Since the strategy works with small average profits it is highly suggested to trade with a low spread a
FREE

Осталось только 7/10 копий по стартовой цене $85!
Философия — «Строить только тогда, когда рынок говорит "да".»
Большинство сеток просто расставляют уровни и надеются. MAM White сначала спрашивает разрешение — у тренда, у волатильности и у вашего брокера. Она строит одностороннюю LIMIT-сетку только тогда, когда быстрая EMA совпадает с сильным медленным EMA-трендом, а цена находится на правильном расстоянии от центра. Нет тренда? Нет построения. Новый разворот? Период охлаждения. Слишком шир
FREE

UT Bot Alerts is a technical indicator for MetaTrader 5 that highlights potential directional changes based on momentum conditions.
The indicator marks signal points directly on the chart and can generate optional notifications for convenience. The signal generation logic can operate in two modes: Closed-bar mode: signals are confirmed only after the bar closes. Live-bar mode: signals are displayed during the formation of the current bar. Both modes are available depending on the user's preferr

This indicator is a sophisticated MetaTrader 5 tool that calculates and displays Average Daily Range (ADR) levels on your chart. It draws horizontal lines representing expected price movement ranges based on historical daily volatility, helping traders identify potential daily high and low targets. ADR (Average Daily Range) = The average difference between the daily high and low over a specified period (default: 14 days). Unlike ATR which includes gaps between days, ADR focuses purely on int
FREE

HiLo Ladder — это переосмысление классического индикатора HiLo , который широко используется трейдерами для определения трендов и возможных точек разворота на рынке. В отличие от традиционной версии, HiLo Ladder отображается в виде ступенчатого формата — популярных «лесенок» , что делает движение цены гораздо более наглядным и простым для анализа. Основные преимущества: Упрощённая визуализация фаз роста (зелёный) и падения (красный). Более интуитивный анализ без потери сути классического HiLo
FREE

ATR Based Swing Trader Indicator Description The ATR Based Swing Trader Indicator is a sophisticated technical analysis tool designed for MetaTrader 5 (MT5) to assist swing traders in identifying potential buy and sell signals based on the Average True Range (ATR) and trend direction. Developed by Rahulkumar Kanani, this indicator leverages volatility and price movement to generate actionable trading signals, making it suitable for traders who aim to capture short- to medium-term price swings in
FREE
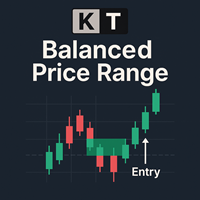
KT Balanced Price Range выделяет зону пересечения между двумя последовательными противоположными Fair Value Gaps (FVG) . Эта концепция, известная как Balanced Price Range (BPR), популярна среди трейдеров прайс-экшн, особенно тех, кто использует методы Smart Money Concepts (SMC) и Inner Circle Trader (ICT). Трейдеры часто используют зоны BPR для поиска сделок с высокой вероятностью успеха, особенно при откатах или при продолжении тренда. Эти зоны могут указывать на возможный разворот, продолжение

El indicador "Time Broker Deriv" está diseñado específicamente para su uso en los índices sintéticos Boom y Crash, así como en otros pares de trading disponibles en la plataforma MT5. Su función principal es proporcionar la hora del broker en comparación con nuestra hora local. Es importante destacar que el indicador "Time Broker Deriv" solo muestra la hora del broker.
FREE

Currency Strength Chart is a powerful Forex indicator designed to track and visually represent the strength of individual currencies within a basket of the 8 major currencies: USD, EUR, GBP, JPY, AUD, NZD, CAD, and CHF. By calculating the relative strength of each currency, the indicator provides traders with a comprehensive overview of how each currency is performing against the others in real-time. This indicator helps traders identify potential trading opportunities by highlighting strong cur
FREE

Раскройте секреты, которые крупные игроки не хотят, чтобы вы видели. Вы когда-нибудь задумывались, всегда ли рыночные «киты» входят в рынок в одно и то же время и в одном и том же направлении? Этот индикатор покажет вам. Он не даёт сигналов на вход, но раскрывает исторические закономерности движения по часам или дням , которые обычно остаются незамеченными. Например, вы можете обнаружить, что по четвергам в 15:00 у пары EURUSD есть 80% вероятность движения вверх. Идеально подходит для трейдеров,
FREE

Автоматизированная торговая система с умными алгоритмами входа/выхода, которая прибегает к методам сетки и мартингейла для максимизации прибыли. Текущие сигналы можно поискать на этой странице, либо написать мне личное сообщение: https://www.mql5.com/ru/signals/author/test-standart Настройки по умолчанию ( таймфрейм М1 ) подходят для валютных пар, особенно для пар с GBP. Все новые сеты появляются тут: https://www.mql5.com/en/blogs/post/747929 Описание параметров эксперта можно находить в ветк

Привет, алготрейдеры. Эксперт торгует по золоту (XAUUSD), таймфрейм любой (одинаково на любом ТФ), начальный баланс аккаунта от 100$.
Доступны следующие сеты "GS SL dynamic 001for100" . Каждая позиция имеет несколько логик закрытия, в том числе и скрытый StopLoss, который рассчитывается индивидуально для каждой позиции, исходя из волатильности последних часов. (Если у вас есть особые требования к стопам, то вы можете установить свои SL и TP в пунктах через параметры: "TakeProfit_Safety" и "St

Swiss CandleTime What ist CandleTime for This indicaor just displays the remaining time for a candle to build. It is best used if you trade with timframes from 3 minutes. I use it in M3 to keep postions. If I have two following red candles i usually liquidate the position. Timeframes M1 to H1 Inputs Arrow displayed => Edit your arrow string Arrow for waiting conditions => Arrow if chart is offline Text Color => color of the text Tell if there is a trend change => tells you, if the two preciding
FREE

The indicator shows your profit and loss (PnL) for the current day right on your trading chart. Anchored at the top-right corner, it displays "PnL: [amount]"—green if you’re up, red if you’re down, white if it’s zero. Every time you close a trade, it updates instantly, adding up your profits, commissions, and swaps from all buys and sells trades since midnight. No fuss, no extra charts—just real-time feedback on how your day’s going.
FREE

Simple utility to help identify local time of price movements. This way you can analyze better and prepare for future movements. Just point to the candle and it will display the time of the candle in your local time zone.
See my other products in the MQL market: https://www.mql5.com/en/users/jdelgadocr/seller Thanks for checking them out. If you have a need for something not too complex, let me know.
FREE

Here is the Russian version of the MQL5 Marketplace-compliant product description for RiskRewardPanel : RiskRewardPanel — Утилита расчета риска и прибыли для MetaTrader 5 RiskRewardPanel — это утилита, предназначенная для помощи трейдерам в планировании сделок путем расчета объема позиции, уровней стоп-лосса и тейк-профита на основе заданных параметров риска. Панель обеспечивает визуальный подход к управлению риском прямо с графика. Основные функции: Расчет риска и прибыли
Вычисляет и отобража
FREE

Об индикаторе: DALA Forecast - универсальный инструмент предсказания динамики временных рядов любой природы. Для предсказания используется модифицированные методы анализа нелинейной динамики, на основе которых строится предсказательная модель с применением методов машинного обучения. Для получения ознакомительной версии индикатора вы можете связаться со мной в личных сообщениях.
Как пользоваться индикатором: Примените индикатор к выбранному вами финансовому интрументу или индикатору с нужными
FREE

«Gold Trader» — финансовый робот, призванный помочь инвесторам и трейдерам принимать более последовательные и прибыльные инвестиционные решения на рынке золота. Робот использует передовые алгоритмы анализа данных для анализа тенденций на рынке золота в режиме реального времени и предоставляет информацию о том, когда следует покупать, продавать или удерживать золотые активы.
С помощью «Gold Trader» инвесторы могут воспользоваться опытом и знаниями в области технического анализа инвестиционных э
FREE

Megatron Shark Indicator – MT5 Harmonic Pattern Detection Tool The Megatron Shark Indicator is a MetaTrader 5 tool for detecting and displaying Shark harmonic patterns directly on the chart. It automatically identifies bullish and bearish Shark formations, calculates entry, stop-loss, and take-profit levels, and provides real-time alerts. This allows traders to quickly integrate harmonic pattern analysis into their trading process without manual drawing. Advantages * Automatic Pattern Detection
FREE

This EA generates custom Heiken Ashi bars (Standard or Smoothed) on a separate symbol. Below is a guide for using the EA effectively with each input setting: 1. HeikenAshiType input ENUM_HEIKEN_ASHI HeikenAshiType = HEIKEN_STANDARD; Options: HEIKEN_STANDARD or HEIKEN_SMOOTHED Use: Choose the type of Heiken Ashi to generate: HEIKEN_STANDARD for traditional Heiken Ashi bars. HEIKEN_SMOOTHED for smoothed versions using MA filters. 2. SmoothingPeriod input int SmoothingPeriod = 7; Use: Applies only
FREE

CRYSTAL AI PRO v7.21 — советник MT5 Обзор
CRYSTAL AI PRO — автоматическая система для XAUUSD (золото) и основных валютных пар. Управляет входами, SL/TP, трейлингом и контролем просадки по фиксированным правилам. Прибыль не гарантируется; см. предупреждение о рисках. Требования Платформа: MetaTrader 5 Тип счёта: ECN/RAW рекомендуется Подключение: 24/7 (желательно VPS) Таймфреймы: M1–H4 Начальная настройка Включите Algo Trading . Прикрепите советник к графику (один символ — один график). В Input

This MetaTrader 5 indicator identifies and visually displays the trading hours of major financial markets (Europe, US, and Asia) on the chart. Through customizable colored fills, it marks the trading periods of each market, respecting server times (GMT+2) and excluding weekends. Market names are displayed near the top of the chart in Arial Black font, also with customizable color. The indicator automatically adjusts to the chart scale, maintaining the fill across its entire vertical range.
FREE
TW Volume Signal Pro MT5 , используя передовые технологии ИИ и запатентованные интеллектуальные алгоритмы, позволяет вам с большей уверенностью торговать на рынке золота и предоставляет уникальный и непревзойденный опыт торговли.
Ищете высокоточность и исключительные торговые сигналы на рынке золота?
С TW Volume Signal Pro MT5 вы можете стать профессиональным трейдером и достичь большого успеха на рынке золота. Попробуйте бесплатно!
Ключевые особенности TW Volume Signal Pro MT5: Точные сигна

The big figure is a crucial aspect of forex trading, serving as a reference point for trade execution, risk management, and technical analysis. By understanding the importance of the big figure and incorporating it into their trading strategies, forex traders can improve their decision-making process and increase the likelihood of successful trades. Why is the Big Figure Important? The big figure is important for several reasons: Simplification: Traders often refer to the big figure when discu
FREE
The Absorption & Exhaustion Detector Professional indicator is a sophisticated volume analysis tool designed to identify critical market turning points by analyzing the relationship between price movement and cumulative volume delta (CVD). This indicator helps traders spot when price movements lack volume confirmation, indicating potential absorption or exhaustion zones. KEY FEATURES Real-time Cumulative Volume Delta (CVD) calculation and normalization Price-volume divergence gap measurement dis

Phoenix Magic Number Dashboard (MT5) Real-time multi-EA monitoring dashboard for MetaTrader 5. Tracks multiple Expert Advisors simultaneously using magic numbers, displaying live open and closed profit/loss for each strategy. Purpose Running multiple Expert Advisors without consolidated oversight creates blind spots in risk, performance, and exposure. Monitoring EAs individually wastes time and increases the chance of missed drawdown or silent failures. The Phoenix Magic Number Dashboar
FREE

Pivot Points Classic – L’indicatore essenziale per ogni trader tecnico Questo indicatore disegna automaticamente i livelli di Pivot Point più utilizzati dai trader professionisti, con supporto completo a 4 metodi di calcolo: Metodi supportati :
• Traditional
• Fibonacci
• Woodie
• Camarilla Caratteristiche principali :
Calcolo su timeframe superiore (multi-timeframe)
Visualizzazione chiara dei livelli P, R1, R2, R3, S1, S2, S3
Etichette dinamiche con nome e valore del livello
Colori per
FREE

Visualize Market Momentum with Precision
MultiMA_ICHIMOKU_STO_Color is a comprehensive technical analysis tool designed to provide clear market signals by combining three powerful indicators into one smart system. This indicator integrates three customizable Moving Averages, key components of the Ichimoku Cloud, and the Stochastic oscillator. Its unique feature is the intelligent candle coloring system that instantly reveals market conditions: Bullish (Blue): Price is above all three MAs AND Sto
FREE

ENGLISH DESCRIPTION (Standard MQL5 Optimized) Product Name: Quantum Howl Seraph [Subtitle: Donchian Breakout | MFI Volume Filter | Time-Decay Exit] Introduction Price is the vehicle, but Volume is the fuel. Most breakout strategies fail because they trade on "empty tanks"—price moves without volume support. Quantum Howl Seraph is an advanced algorithmic trading system designed to capture high-probability volatility explosions by combining Price Compression (Donchian) with Money Flow analysis (MF
FREE

Советник основанный на сигналах индикатора Stochastic в зоне перекупленности - продаем, в зоне перепроданности - покупаем. Версия для МТ4 https://www.mql5.com/ru/market/product/62952 Если советник используется в режиме 5/24 на VPS, я рекомендую использовать данный эксперт в консервативном режиме, ограничивая количество ордеров в сетке с помощью параметра " Count_Orders_Max_Grid " . По бесплатным экспертам, справок и сетов не даю. Они потому и бесплатные)) Оптимизация и прочие прелести ложатс
FREE

Price and Spread Indicator
Version: 1.0 Developer: Creative Tech Solutions Website: https://www.creativetechsolutions.co.uk
Overview The Price and Spread Indicator is a great tool for MetaTrader 5 that displays the Ask and Bid prices along with the spread directly on the chart. This indicator provides real-time updates and allows traders to make informed decisions based on accurate price information.
Features - Real-time Price Updates: Continuously updates Ask and Bid prices. - Spread Disp
FREE

Introducing the AI Keltner Channel , a cutting-edge Forex indicator that leverages machine learning to dynamically calculate Keltner Channels in real-time. Unlike traditional Keltner Channel indicators, which rely on static inputs, the AI Keltner Channel adapts continuously to ever-changing market conditions, providing traders with a more accurate and responsive view of price trends and volatility. Powered by advanced machine learning algorithms, the AI Keltner Channel analyzes historical and re
FREE

Описание эксперта
Торговая система эксперта основана на входе и выходе при определенном отклонении цены актива от значения скользящей средней. Эксперт обладает рядом параметров, манипулируя которыми можно реализовывать разные торговые системы и так же получать разные результаты при торговле на разных активах, учтите это при настройке эксперта и не используйте стандартные настройки на всех инструментах и тайм фреймах.
Рекомендации по эксплуатации
Рабочими тайм фреймами эксперта является M5,M
FREE
ZigZag Reversal Detector Signals This is a technical indicator based on the ZigZag principle, designed to automatically detect market reversal points and generate clear buy and sell signals. Customizable Parameters ️: Level : Determines the sensitivity of the ZigZag to price changes. Ecart : Sets the minimum distance between two ZigZag points. Rebond : Adjusts the confirmation threshold for a reversal. Alerts & Notifications : Enable or disable according to your needs. Pe
FREE
MetaTrader Маркет - торговые роботы и технические индикаторы для трейдеров, доступные прямо в терминале.
Платежная система MQL5.community разработана для сервисов платформы MetaTrader и автоматически доступна всем зарегистрированным пользователям сайта MQL5.com. Ввод и вывод денежных средств возможен с помощью WebMoney, PayPal и банковских карт.
Вы упускаете торговые возможности:
- Бесплатные приложения для трейдинга
- 8 000+ сигналов для копирования
- Экономические новости для анализа финансовых рынков
Регистрация
Вход
Если у вас нет учетной записи, зарегистрируйтесь
Для авторизации и пользования сайтом MQL5.com необходимо разрешить использование файлов Сookie.
Пожалуйста, включите в вашем браузере данную настройку, иначе вы не сможете авторизоваться.