MetaTrader 5용 Expert Advisor 및 지표 - 47

Enhance your price action strategy: inside bar breakouts at your fingertips
This indicator detects inside bars of several ranges, making it very easy for price action traders to spot and act on inside bar breakouts. [ Installation Guide | Update Guide | Troubleshooting | FAQ | All Products ] Easy to use and understand Customizable color selections The indicator implements visual/mail/push/sound alerts The indicator does not repaint or backpaint An inside bar is a bar or series of bars which is/a
FREE

The Arbitrage365 EA is a basic script for MetaTrader that implements a triangular arbitrage strategy. It identifies and exploits price discrepancies between EURUSD, GBPUSD, and EURGBP to profit from temporary market mispricing. This EA capitalizes on the law of one price by simultaneously buying and selling currency pairs. Its advantages include speed, accuracy, scalability, consistency, cost-effectiveness, contribution to market liquidity, and portfolio diversification. However, it's a basic E
FREE

Hunt markets with Hunttern ZigZag . Easy to use with one parameter
You can use it for the following: -Classic patterns -Heads and shoulders -Harmonic patterns -Elliott Wave -Support and resistance -Supply and Demand
Single parameter: -Period (1-120)
Features: -Candle time -Single parameter -Light mode template
This is version 1 of Hunttern ZigZag. We are very happy to receive feedback from you.
FREE
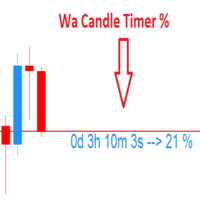
Wa Candle Timer Percentage MT5 is an indicator which shows the user how much time is remaining until the next candle will form. The percentage of the evolution of the current candle is also displayed. The user can set the percentage that the candle timer will change the color. These are the settings: 1- The percentage that the candle timer will change the color. 2- Color of Candle Timer when it's BELOW the percentage set by the user. 3- Color of Candle Timer when it's ABOVE the percentage set b
FREE

The official release price is $65 only for the first 10 copies, the next price is $125 Gold Scalper System is a multifunctional trading system that combines a breakout strategy for key liquidity levels with confirmation and a built-in Smart DOM Pro module for market depth analysis. The system identifies zones of limit order accumulation, tracks activity at support and resistance levels, and generates signals at the moment of their breako
Trade donchian breakouts with complete freedom. This EA can trade any breakout period, any timeframe, with pending or market orders- as desired- and implements many other useful features for the exigent trader, like customizable trading sessions and week days, a martingale mode and inverse martingale mode. [ Installation Guide | Update Guide | Troubleshooting | FAQ | All Products ] Easy to use and supervise Customizable trading direction Customizable donchian breakout period It can trade using
FREE
Three Sixty Dollar EA
M1 FTMO Strategy: over/under actual Price inp_1:Worktime inp_4/9:Lot Settings Real Account with 200$. Only Pair DE40, US100, US30. Automatic added London Session. This Version works with fixed Lot buy/ sell. Write me privat Message of Questions when undecided. Gratis ex5 Code by Request. Mq5 Source Code for 30$ for Payment of a EA on my Page.
FREE

Want to AUTOMATE this strategy? We have released the fully automated Expert Advisor based on this logic. Check out Range Vector Fibo Logic EA here: https://www.mql5.com/en/market/product/158065
UPGRADE AVAILABLE: Tired of manual trading? I just released the Automated MTF Version with Mobile Alerts and Auto-Targets. Get the Pro Version here: https://www.mql5.com/en/market/product/159350
Range Vector Fibo Logic (Indicator) One Candle Strategy
Stop waking up at 3 AM to draw lines manually. Ran
FREE
https://www.mql5.com/en/users/gedeegi/seller
The "RSI+ with 123 Fractals" logo is designed to provide a clear and professional visual representation of a complex technical indicator, focused on precise market analysis and reliable patterns. Each element in the design is crafted to reflect the philosophy and strengths of the indicator within the trading world. Design Elements: "RSI+" Text in Bold and White:
The main "RSI+" text is chosen to be the focal point, with a bold and clear font. The us
FREE

BlackHole Breakout EA: Unleash Precision Trading with Breakout Mastery
Discover the Power of Intelligent Breakouts The BlackHole Breakout EA is a cutting-edge Expert Advisor designed for MetaTrader 5, empowering traders to capitalize on market momentum with pinpoint accuracy. Built by Ngoa Long Tien Sinh (@blackholequantumpro on Telegram), this EA detects high-potential breakout (upward) and breakdown (downward) patterns, transforming volatility into profitable opportunities. Whether you're a
FREE

MT5 Smart Dashboard is the ultimate tool for manual traders who want speed and automatic risk management. It transforms your chart into a professional trading station with a clean dark theme. Key Features: Fast Execution Panel: Open Buy and Sell trades instantly. Place Pending Orders (Limit & Stop) with one click. Adjust Lot Size and Price easily via buttons (+/-). ️ Automatic Risk Management: Auto Break-Even (BE): Moves your Stop Loss to the entry price automatically
FREE
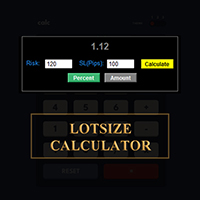
메타트레이더에서 바로 랏사이즈를 계산하세요!!!
안녕하세요, 트레이더 여러분. 위험 관리에 중점을 두시는 트레이더이신가요? 그렇다면 바로 이 기능이 도움이 될 것입니다. 저는 이브라힘입니다. 계좌 잔액 대비 위험 비율을 기반으로 랏사이즈를 계산하는 도구를 개발했습니다. 위험 비율을 %로 지정하는 대신 절대값을 지정하여 랏사이즈를 계산할 수도 있습니다. 예를 들어, 잔액에서 $100를 위험에 빠뜨리고 싶다고 지정할 수 있습니다.
MT4 버전: https://www.mql5.com/en/market/product/155026
무료입니다. 꼭 확인해 보세요. 댓글로 추가했으면 하는 기능이나 커뮤니티를 위해 개발했으면 하는 다음 도구에 대한 의견을 남겨주세요.
즐거운 트레이딩, 즐거운 자동화 되세요!!!
FREE

Keltner-Enhanced improves the accuracy and readability of Keltner Channels with many options for adjusting them and more five price calculations beyond the META default.
The Keltner-E indicator is a banded indicator similar to Bollinger Bands and Moving Average Envelopes. They consist of an upper envelope above a midline and a lower envelope below the midline.
The main occurrences to look out for when using Keltner Channels are breakouts above the Upper Envelope or below the Lower Envelope.
FREE

This Expert Advisor uses statistical arbitrage to trade cryptocurrency pairs (e.g., BTCUSD & ETHUSD). It identifies mispricings and executes trades based on deviations from historical correlations. The EA employs mean reversion, pair trading, and cointegration analysis. It features advanced risk management, including dynamic position sizing, ATR-based stop-loss/take-profit, equity protection, and drawdown limits. It also includes smart order handling, real-time position verification, and statis
FREE

The Trend Line Reverse Expert Advisor is a highly innovative and powerful tool that enables traders to effortlessly identify and trade trends in the financial markets. With this advanced tool, you can easily draw trend lines on your MT5 chart, and the EA will automatically buy or sell when the price reaches the trend line. This EA is user-friendly and requires minimal setup. You can simply attach it to your chart and start drawing up to three trend lines where you anticipate the price to reverse
FREE
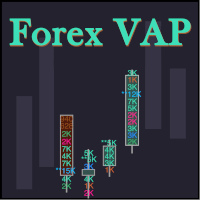
What do you see inside a candle? How to interpret the fight between bulls and bears? The candlestick chart brings a lot of information, but the volume is lacking in the candlestick body. This is where the Forex Volume At Price Expert Advisor comes in. This advisor searches for a set of recent trades, calculates the buy and sell attack volumes and prints on the candles, the volume value in each price range. You can also define up to ten colors to filter volumes and make it easier to
FREE

친애하는 친구, 나는 당신의 관심에 지표 Visual Correlation 를 제시합니다.
서로 다른 통화 쌍의 동작은 서로 연결되어 있습니다. Visual Correlation 표시기를 사용하면 척도를 유지하면서 하나의 차트에 다른 상품을 표시할 수 있습니다. 양의 상관 관계, 음의 상관 관계 또는 상관 관계 없음을 정의할 수 있습니다.
일부 악기는 다른 악기보다 먼저 움직이기 시작합니다. 이러한 순간은 그래프를 오버레이하여 확인할 수 있습니다.
차트에 상품을 표시하려면 Symbol 필드에 상품 이름을 입력합니다.
서로 다른 통화 쌍의 동작은 서로 연결되어 있습니다. Visual Correlation 표시기를 사용하면 척도를 유지하면서 하나의 차트에 다른 상품을 표시할 수 있습니다. 양의 상관 관계, 음의 상관 관계 또는 상관 관계 없음을 정의할 수 있습니다.
일부 악기는 다른 악기보다 먼저 움직이기 시작합니다. 이러한 순간은 그래프를 오버레이하
FREE
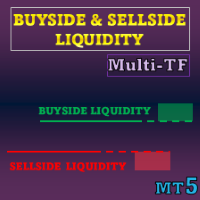
특별 제공 : 모든 도구 , 개당 $35 . 신규 도구 는 첫 주 또는 처음 3건 구매 까지 $30 입니다! MQL5 Trading Tools 채널 : 최신 소식을 받으려면 제 MQL5 채널에 가입하세요 이 지표는 유동성 레벨 과 유동성 존 을 ICT 개념 에 기반하여 시각화하고, 단방향 가격 이동을 강조하기 위해 Liquidity Voids 를 표시합니다. 스톱/미결 주문이 모이기 쉬운 위치와, 가격이 이를 통과한 이후 해당 영역이 어떻게 변하는지에 초점을 맞춥니다.
MT5 버전 더 보기: Buyside and Sellside Liquidity MT5 Multi Timeframe MT4 버전 더 보기: Buyside and Sellside Liquidity MT4 Multi Timeframe 더 많은 제품: All P roducts 핵심 하이라이트 • 색상으로 구분된 레벨/존으로 양방향 유동성 구조(buyside/sellside)를

This utility here gives you a lot of bang for your buck by being a 2 in 1 custom candles generator. For the price of 1 utility, you get 2 !! It creates offline charts that will behave like a live chart.
It has 2 modes of operation: Tick and Range
These are not time based charts. They will enhance your analysis giving you an edge by filtering a lot of useless and confusing price noise, leaving behind the most important price levels/market structure.
When set to "Tick" mode, it will generate
Stop guessing where the market will turn. Our advanced High/Low Indicator for MT5 is the ultimate tool for mastering price action and identifying key market structure. It automatically scans the chart to identify and clearly plot all critical swing highs and lows in real-time, helping you see the true story behind the candles. These crucial, non-repainting levels form the backbone of any successful trading strategy. Use them to instantly visualize the market's framework, allowing you to pinpoint
FREE

SMART SD ARROW INDICATOR
Trade Smarter, Not Harder: The Smart SD Arrow Indicator That Paints Clear Buy & Sell Signals Right On Your Chart!
Finally, an All-in-One Supply & Demand Tool That Doesn’t Just Draw Zones—It Gives You Precise, Actionable Entry Arrows. Stop Analyzing, Start Executing.
Dear Trader,
Let's be honest. You've tried indicators that draw complicated zones all over your chart. They look smart, but when it's time to pull the trigger, you're left with the same old question:
FREE

Swing Points Indicator for MetaTrader 5
The **Swing Points Indicator** is a custom-built technical tool designed for MetaTrader 5 (MT5), primarily used for identifying crucial reversal points in price action. By plotting swing highs and swing lows, it highlights potential trend reversals, making it a valuable tool for traders relying on price action analysis. This indicator helps traders anticipate changes in market direction by visually marking significant turning points on the chart.
Main F
FREE

Momentum-Driven MT5 Expert Advisor Using MACD & Bulls Power TRDR Bot-3 is a structured, momentum-focused Expert Advisor developed by TRADEWYZE, designed for traders who want a clean trend-confirmation system with disciplined exits and strong capital protection. The EA combines MACD, Bulls Power, and Momentum indicators to identify directional strength and exit trades when momentum begins to fade—making it ideal for sustained market moves in Forex, Indices and Commodities.
This EA is not a Black
FREE

Carbon Drift Price today is 70. When 5 copies are sold, the new price will be 90. Don’t miss the early slot. Currently sold: 4 . Contact me now to get a demo-account test version.
Carbon Drift 와 함께 자동 거래의 새로운 시대에 발을 디뎌 보세요. 이 EA는 시장의 자연적인 “흐름 동역학”을 해석하도록 설계되었습니다. 정밀함을 위해 설계된 이 시스템은 실시간 모멘텀 변화 읽기, 소진 구역 감지 및 추세 소진이 반전 강도와 만나는 지점에서 매수 실행에 주력합니다. 이는 비선형적이고 유동적인 접근 방식으로, 경직된 기계적 설정을 훨씬 뛰어넘습니다.
MQL에서 확장하는 거래자 커뮤니티에 참여하세요: (여기를 클릭하세요) EA의 통찰력을 더 깊이 다뤄보세요: (여기를 클릭하세요)
Need my assistance? For prop
RSI Bollinger DualStrike Signals offers a clear and structured approach to identifying areas that may be favorable for potential trend reversals. By combining the RSI with Bollinger Bands, the indicator highlights moments when price shows signs of pressure or loss of momentum. The BUY/SELL signals help traders make more organized and disciplined decisions. It is a useful tool for scalping, day trading, or swing trading not to predict the market, but to improve the reading and understanding of pr
FREE

Session Killzone Indicator
Indicator that helps you to identify the killzone times of both London and NewYork sessions which usually is the most times for high volatility and taking liquidity from the market. Killzone times are configurable through indicator parameters. The indicator adjusts the range of the killzones based on the daily trading range.
FREE
This expert is a pure volatility scalper working with market orders orders. Expert not use any indicator, only use prices action and volatility of price to generate signals. Using an algorithm to calculate the speed of price to generate the signals. There are three conditions for it to work: Tight spread Fast execution Stop level = 0 Please during the tests of this EA do not simultaneously use another EA in the same terminal because it affects the modification speed. Try expert on demo accoun
FREE

종합적인 트렌드 분석 및 거래 아이디어를 위한 "Demark Trends Indicator"의 강력함을 경험해보세요. Demark 지표는 시장 트렌드와 소진 지점을 평가하는 데 효과적으로 알려져 있습니다. 저희 Demark Trends Indicator는 이러한 전문성을 한 단계 더 높여, 자동으로 정확한 트렌드 라인을 차트에 그립니다. 캔들 수, 알람 설정, 라인 색상 등을 포함한 사용자 정의 가능한 매개 변수를 통해 분석에 완전한 제어력을 갖게 됩니다. 초보자든 경험이 풍부한 트레이더든 상관없이, 우리의 인디케이터는 트렌드 분석을 간단화하고 시간과 노력을 절약해줍니다. 다음과 같은 "Demark Trends Indicator"의 잠재력을 발휘하세요: 정확한 트렌드 식별: 자동으로 그려지는 정확한 트렌드 라인으로 시장 트렌드를 원활하게 분석합니다. 효율적인 거래 전략: 현재 트렌드 상태를 평가하고 정보에 기반한 거래 결정을 위해 잠재적인 소진 지점을 예측합니다. 사용자 정의 가능한
FREE

EXPERT for YOUR OWN ACCOUNT - 이 전문가 어드바이저는 사용자를 위해 특별히 설계, 개발 및 최적화되었습니다.
H1 차트주기와 MT5 플랫폼에서 추세의 시작부터 끝까지 모든 단계에서 AUDUSD 심볼의 최고 및 최대 기회를 활용할 수 있는 강력한 EA(전문가 조언자)입니다. 지난 3년간 백테스트에서 인상적인 정확도, 성능 및 일관성을 보였습니다. EA는 사냥꾼, 저격수처럼 가격 움직임, 강세 및 추세를 분석하고 인내심을 가지고 최고의 기회를 기다리며 매우 정확하게 작업을 수행합니다. EA는 SMC CHANGE OF CHARACTER (CHoCH) 전략을 기반으로하며 많은 기본 및 독점 지표를 사용합니다.
LIVE SIGNAL - STRATEGY No.1 - https://www.mql5.com/en/signals/2336247 LIVE SIGNAL - STRATEGY No.2 - https://www.mql5.com/en/signals/2336242
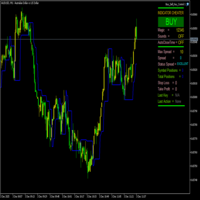
FractalBreakoutLevels 개요:
이 지표는 가격 변동 분석을 기반으로 동적인 가격 수준을 표시합니다. 거래의 참고가 될 수 있는 주요 수준을 식별하기 위해 과거 가격 데이터를 결합합니다. 작동 원리:
이 지표는 현재 및 과거 가격 데이터 간의 관계를 분석하여 시장 구조를 조사합니다. 변화하는 시장 조건에 적응하는 연속선을 그리며, 동적 지지/저항 수준으로 작용합니다. 수준 형성 원리: 지표는 여러 연속 봉에 대한 분석을 결합하여 사용합니다 특정 가격 관계 하에서 수준이 형성됩니다 명확한 신호가 없을 경우, 지표는 이전 값을 유지하여 연속선을 생성합니다 기술적 사양: 가격 차트에서 직접 작동합니다 연속 수준(파란색 선)을 표시합니다 외부 설정이 없으며 표준 가격 데이터로 작동합니다 과거 값을 다시 그리지 않습니다 적용:
이 지표는 다음과 같은 목적으로 사용할 수 있습니다: 잠재적 지지/저항 수준 식별 가능한 추세 반전 지점 탐지 표시된 수준에 대한 손절매 수준 설정
FREE

The "Close All Order Tools" tool is designed to solve common problems faced by Forex traders when managing profitable orders—especially in highly volatile market conditions or when dealing with multiple open trades simultaneously. Problems This Tool Solves: Unable to close orders in time : “Just when it was rising nicely, the price suddenly dropped—I couldn’t close it in time, and the profit vanished.” Closing orders one-by-one is time-consuming : “With multiple orders open, closing each one ind
FREE

MACD Divergence Scanner is a multi-timeframe and multi-symbol dashboard and alert that checks all timeframes and symbols to find regular and hidden divergences between price chart and MACD indicator. This divergence scanner is integrated with support and resistance zones so you can check the MACD divergences in the most important areas of the chart to find trend reversals in the price chart. Download demo version (works on M4,M6,M12,M20,H3,H8 timeframes of 20 symbols of Market Watch window)

Gold Pro SMC Big Player EA MT5 - Note This EA Can also be used on Indices such as US30, NASDAQ, FR40, DAX, UK, BTCUSD, Metals and Currencies. Write Separately to me for set files after purchase. Set file for Backtesting/forward testing is attached in Comment Section- Must Use it on XAUUSD/Gold in M30 time. The Gold Pro SMC Big Player EA MT5 is a next-generation trading system built on Smart Money Concepts (SMC) and institutional order flow logic .
It identifies high-probability zones where inst

Genaral: Not martingale, not a grid; Use on EURUSD Use on M5
Signals: There is a good rational algorithm. Work of two indicators: Chaikin and DeMarker (from 2 timeframes) (you can set a separate Timeframe for each indicator)
Stop Loss/Take Profit: There is a good money management system (there are several type for trailing stop loss); There is virtual levels of Stop Loss / Take Profit; There is smart lot (percent by risk) or fix lot
Important: EA can work on closed candles, and on curr
FREE

Setup Tabajara was created by a Brazilian trader known as "The OGRO of Wall Street" .
The idea of this setup is to indicate to the trader the current trend of prices and the type of operation should be looked for in the graph.
Operation
It does this through the relation of the closing price position and the of 20 periods, by painting the candles in 4 possible colors : Green -> Price rising in upward trend (Search entry points for PURCHASE) Black -> Price correcting in Bullish Trend (Sear
FREE
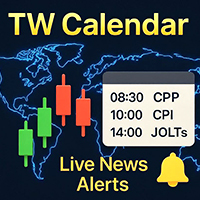
이 뉴스 도우미는 다양하고 쉬운 필터를 사용하여 터미널의 Market Watch를 기반으로 실시간 뉴스를 게시하는 주요 게시 소스에서 거래자가 필요로 하는 경제 이벤트를 가져오도록 설계되었습니다.
외환 거래자는 거시경제 지표를 사용하여 통화 구매 및 판매에 대한 정보에 근거한 결정을 내립니다. 예를 들어, 거래자가 미국 경제가 일본 경제보다 빠르게 성장할 것이라고 믿는다면 미국 달러를 매수하고 일본 엔화를 매도할 수 있습니다.
이 제품의 특징: 브로커의 시장 관찰을 기반으로 항목 표시 가치는 공개되자마자 이벤트 게시자의 주요 소스로부터 정보 수신 이벤트 값 공개 시 경고 간편한 필터링 가능성 가장 가까운 이벤트 표시 이벤트 값이 공개되기 X분 전에 알림 이벤트에 대한 유용한 설명 이벤트의 현재 가치와 예측 및 중요성을 보여줍니다. 쉽게 작업할 수 있는 그래픽 사용자 인터페이스 빛과 어둠 테마 패널 최소화 및 이동 기능 쉬운 설치 이 기본 도구를 전문 신호 지표와 함께 사용하여
FREE

This is a simple Orderblock alert indicator. it alerts you once it spots a bullish or bearish OB. what you choose to do with the alert, is left to you. Feel free to test on demo before use. (I'll be working on a combo i.e this and an EA working side by side, anticipate) Bullish OB has a light blue color and bearish has a light red color (rectangle box drawn on chart). Please trade wisely and don't forget to leave a positive review. thanks More blues to you, and Happy Trading!
FREE

Daily Reversal is a reliable scalping strategy which takes advantage of larger trend reversals. It draws a range every day of the body of the previous daily candle and places pending orders according to whether the previous day was bullish or bearish. Then, it uses multiple trailing stop losses to manage all of the positions. Daily Reversal includes a prop firm mode, our recovery system and also has a news filter to further protect your capital against volatile events. For a more active strateg
FREE

The Horse Signal 1.26 – Price Action AI Indicator for Gold & Forex Overview: Start your 2026 trading year with "The Horse Signal," the latest precision tool from the WinWiFi Robot Series. Designed specifically for traders who demand high-accuracy entries, this indicator utilizes advanced Price Action analysis combined with an AI scanning algorithm to identify high-probability reversal and trend continuation points in real-time. Key Features: Dynamic Price Action Scan: Automatically analyzes can
FREE

ATR Based Swing Trader Indicator Description The ATR Based Swing Trader Indicator is a sophisticated technical analysis tool designed for MetaTrader 5 (MT5) to assist swing traders in identifying potential buy and sell signals based on the Average True Range (ATR) and trend direction. Developed by Rahulkumar Kanani, this indicator leverages volatility and price movement to generate actionable trading signals, making it suitable for traders who aim to capture short- to medium-term price swings in
FREE

WaveTrendPro Arrow – Adaptive Cross Signal with Smart Alerts Description WaveTrendPro Arrow is a clean and powerful visual indicator designed to detect trend-reversal points using the classic WaveTrend oscillator (WT1/WT2 cross) , enhanced with intelligent on-chart arrows , real-time alerts , and mobile push notifications . Unlike traditional WaveTrend indicators that display signals in a subwindow, this version shows precise entry arrows directly on the main chart , positioned adaptively
FREE

WYSIWYG Candle for WYSIWYG ORB Smart Breakout Candles is a professional multi-method breakout detection indicator that combines ATR, Bollinger Bands, Opening Range Breakout (ORB), and Squeeze Detection to identify high-probability breakout opportunities across all financial instruments. This indicator provides real-time visual signals through colored candles and precise arrow placements, making it ideal for traders seeking reliable volatility-based entries. "Use in conjunction with the WYS
FREE

Smart Grid MT5 automatically recognizes any symbol, period and scale of the chart and marks it up accordingly. It is possible to mark up the chart by trading sessions. The grid consists of the two main line types.
Vertical lines There are two visualization methods: Standard - the lines are divided into three types, separating: Small time period. Medium time period. Large time period. Trading Session - the lines are divided into groups (a total of ten). Each group has two lines: the first is res
FREE
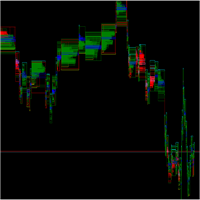
O SpreadFlow é um indicador para MetaTrader que gera um gráfico totalmente baseado no comportamento do fluxo de negócios, em vez de se limitar apenas a candles de tempo ou volume.
Ele organiza as informações de cada tick em quatro dimensões principais: Spread – monitora a diferença entre BID e ASK ao longo do tempo, mostrando momentos de compressão e alargamento do spread, associados a maior ou menor liquidez. Negócio no mesmo preço – identifica quando sucessivos negócios ocorrem no mesmo nível
FREE

"거래 알림"은 개설 또는 마감된 모든 거래에 대한 모바일 알림이나 단말기 알림 은 물론 각 거래의 $ 이익/손실 결과를 알려주는 것을 목표로 하는 유틸리티 도구입니다 . 제가 오랫동안 사용해오던 도구인데, 무료로 공유하게 되었습니다!
입력 매개변수: (모든 입력은 참/거짓 유형입니다. 값을 변경하려면 두 번 클릭하세요.) 마감된 포지션 손익에 대한 알림 : true인 경우 마감된 거래의 $ 결과를 알려줍니다. 이렇게 하면 거래가 종료되는 시기와 그 결과에 대한 정보를 얻을 수 있습니다.
이는 차트에 얽매이지 않고 거래의 PnL이 오르락내리락하는 것을 지켜보는 데 유용한 기능입니다. 이는 스트레스를 덜 받는 거래로 이어집니다. 새로 개설된 거래에 대해 알림 : true인 경우 새 거래가 개설될 때 알려줍니다. 지정가 주문을 설정하고 언제 진입 레벨이 시작되는지 알고 싶을 때 매우 중요한 매개변수입니다.
귀하가 알고 트레이더이고 시장에 진입
FREE

Close Manager MT5로 거래 종료 프로세스를 최적화하세요. 이 강력한 전문가 어드바이저(EA)는 MetaTrader 5에서 수동 또는 다른 EA에 의해 열린 거래의 출구를 자동화하도록 설계되었으며, 트레이더에게 출구 전략에 대한 정밀한 제어를 제공합니다. MQL5, Forex Factory, Reddit의 r/Forex에서 다양한 맞춤형 종료 기준으로 높은 평가를 받고 있으며, 이 EA는 외환, 지수, 암호화폐와 같은 변동성이 큰 시장에서 스캘퍼, 데이 트레이더, 스윙 트레이더들 사이에서 인기가 많습니다. 사용자들은 수동 거래 관리 시간이 30-50% 감소하고 리스크 관리가 개선되었다고 보고하며, 많은 이들이 엄격한 출구 규칙을 준수함으로써 수익성이 향상되었다고 언급합니다. Close Manager MT5는 지속적인 모니터링 없이 리스크 관리와 출구 효율성을 최적화하려는 트레이더에게 이상적이며, 초보자와 숙련된 트레이더 모두 다양한 거래 전략을 지원합니다. Close Ma
FREE

Hetzer News Trading은 주요 뉴스 발표 시 작동하도록 특별히 설계된 지능형 트레이딩 로봇입니다. 중요한 경제 및 금융 데이터가 공개될 때 시장에 진입하기 위해 정확한 시간 간격을 설정하여 미리 거래를 계획할 수 있습니다. Hetzer News Trading의 주요 장점: 유연한 설정: 뉴스 일정에 따라 거래 스케줄을 미리 설정할 수 있습니다. 예를 들어, 내일 16:00과 17:00에 중요한 뉴스가 발표된다는 것을 알고 있다면, 해당 시간에 로봇이 자동으로 활성화되도록 설정할 수 있습니다. 주간 계획: 며칠 앞선 뉴스 이벤트를 미리 확인할 수 있어, 전략을 신속하게 조정하고 위험을 최소화하며 이익 잠재력을 최적화할 수 있습니다. 거래 작업의 자동화: 로봇은 지정된 시간에 자동으로 작동하여, 지속적으로 뉴스를 모니터링하고 수동으로 시장에 진입할 필요가 없습니다. 효과적인 위험 관리: 미리 설정된 시간 간격과 전략은 뉴스 이벤트와 관련된 시장 변동성의 영향을 줄이는 데
FREE

RSI ALARM (For Metatrader 5)
This indicator works like a normal RSI with all its settings (Periodicity, colors, levels, etc),
but additionally, alarms can be set at the upper and lower level (Example 70 and 30), with the possibility of adjusting these levels by moving the blue and red lines to establish the upper and lower levels.
You can also turn on and off an additional function that creates an arrow on the chart when the expected upper or lower RSI is met.

The indicator has been designed for use on FORTS, but it can also work on other markets, at brokers broadcasting the required data. A peculiarity of these data is that they cannot be requested from the broker's server as a section of history, but can only be obtained for the current moment. The indicator periodically requests the broker, collects to a file and displays the following history from the stored file: The weighted average price. The volume of buy pending orders. The volume of sell pen
FREE

DAX Falcon is a pending-order system built for the early movement of the DAX. The EA reads the initial structure of the session and places buy and sell stops at predefined levels. No grid, no martingale, no averaging. Each position has fixed and independent risk. The logic focuses on the morning range and the reversals at the end of the European session.
Core Characteristics: Pending orders only Defined stop loss and take profit
CFD vs Futures Pricing Warning: This model depends on accurate p
FREE

BandPulse is a powerful trading expert that combines Martingale, Hedging, and Scalping strategies, simplifying the management of trading complexities. This EA uses advanced algorithms to maximize the strengths of each strategy while meticulously managing risks.
The balance-based risk management feature provides users with safety, and when used in conjunction with IAMFX-Agent , it can achieve both risk management and profit maximization.
This combination is designed to offer users the best pos
FREE
This indicator provides a clear, at-a-glance dashboard for monitoring both the Relative Strength Index (RSI) and Stochastic Oscillator on any instrument or timeframe.
Whenever both RSI and Stochastic %K simultaneously exceed their respective overbought or oversold levels, the indicator displays an arrow signal in the indicator window.
These signals highlight strong momentum and can help traders quickly identify high-probability reversal zones. As with all my free tools, the arrow symbol can be e
FREE

Mouse Calculation은 마우스로 가리킨 가격에서 청산한다고 가정했을 때, 각 주문의 손익을 빠르게 계산해 줍니다. 그리드, 마틴, 분할 진입 등 다수 주문 운용 시 빠른 의사결정에 적합합니다. 손익분기 가격과 목표 가격을 한눈에 확인할 수 있습니다. 핵심 기능 Mouse PnL (M) : 주문별/총 손익 미리보기(스왑 swap 포함). Break even Price (B) : 전체 포지션의 손익분기 가격/라인 표시. Time_Sync_Lines (T) : 최근 N일의 동일한 시각을 맞춰 비교; 드래그로 핵심 구간 복기. Panel (P) : 패널 표시/숨김. About (A) : 사용 안내 및 정보. 차트 표시 안내 B / S : 주문의 현재 손익 M : 마우스 가격 기준 “해당 가격 청산 시 손익” 추정 T : 총 손익 추천 사용 시나리오 그리드 : 바스켓 익절 구간을 빠르게 결정. 마틴 : 손익분기/플러스 전환에 필요한 반등 범위를 빠르게 확인. 다수 주문 : 부분 청
FREE

Description. This product was created based on low investment EA,
EA "OPHEX" is an advanced system that exploits GOLD XAUUSD Only. I uses both Scalping and Hedging Strategy. Once the Scalping hits SL it converts the position into Hedging and recovers the loss.EA gives upto 10% return every month with low risk. We can increase initial lot size for more return while account grows.
Advantages. Get upto 10% Returns every month with very low risk; Much cheaper than similar alternatives; Operat
FREE

If you trade on financial markets, you’ve probably realized how important the spread is—the difference between the buy (ask) and sell (bid) price can seriously impact your profit. Spread Size is a simple yet highly useful indicator that displays the current spread right on the chart. No more constantly monitoring data manually—everything is right in front of your eyes! Why is it needed?
The spread isn’t just a number. It’s your real money. A low spread means entering and exiting a trade will
FREE

The Investment Castle Chances indicator will show signals on the chart for entering a buy or sell trade. There are 2 types of signals for each direction as follows: Buy / Sell (Orange colored candlesticks) Strong Buy (Green colored candlesticks) / Strong Sell (Red colored candlesticks) You may place a buy trade once you see the Buy arrow or vise versa, or you might prefer to wait for a further confirmation “Strong Buy” / “Strong Sell”. This indicator works best with the high time frames H1,
FREE
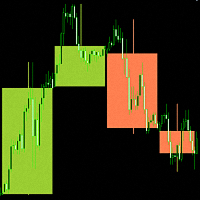
"Candlesticks MTF 5" is an information indicator that displays "Japanese Candlesticks" . The indicator analyzes and determines the opening and closing times of candles from higher time frames.
An algorithm has been developed for the "Candlesticks MTF 5" indicator that corrects the discrepancy between the opening and closing times of candles from higher time frames. For example, if the opening time of a candle on a weekly time frame is the 1st of the month, and on the smaller time frame this da
FREE
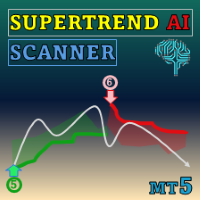
Special offer : ALL TOOLS , just $35 each! New tools will be $30 for the first week or the first 3 purchases ! Trading Tools Channel on MQL5 : Join my MQL5 channel to update the latest news from me MetaTrader 5 (MT5) 용의 혁신적인 거래 도구인 SuperTrend AI Clustering MT5 with Scanner 로 AI의 힘을 발견하세요. 이 지표는 K-means 클러스터링과 널리 알려진 SuperTrend 지표를 결합하여 시장 분석을 재정의하고, 거래자가 트렌드와 신호를 탐색할 때 유리한 위치를 차지할 수 있도록 합니다. See more MT4 version at: SuperTrend AI Clustering MT4 with Scanner See more products at:
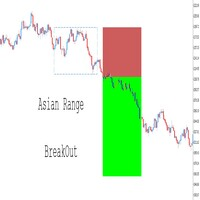
완전 맞춤 설정 가능 – 범위 시간, 색상, 선 스타일 및 리스크-보상 설정과 같은 매개변수를 수정하여 자신의 트레이딩 스타일에 맞게 지표를 조정할 수 있습니다. 트레이드 레벨 시각화 – 돌파 조건을 기반으로 진입 가격, 스톱로스(SL) 및 테이크프로핏(TP) 레벨을 자동으로 표시합니다. 전문가 어드바이저(EA)와 완벽한 통합 – RSI, 이동 평균, 구조적 돌파(BOS) 등과 같은 추가 확인 기능을 추가하여 자동화된 전략을 완벽하게 제어할 수 있습니다. 또한, 버퍼 이름을 사용자 지정 하여 EA 요구 사항에 맞게 조정할 수 있어 전략의 유연성이 더욱 향상됩니다. 멀티 자산 및 멀티 타임프레임 백테스트 – 외환, 암호화폐 및 기타 금융 상품 에서 다양한 설정을 테스트하여 최적의 트레이딩 전략을 찾을 수 있습니다. 깔끔하고 직관적인 인터페이스 – 가격 움직임에 집중할 수 있도록 방해 요소 없이 거래 신호를 쉽게 해석할 수 있도록 설계되었습니다. 이 지표는 브레이크아웃
FREE
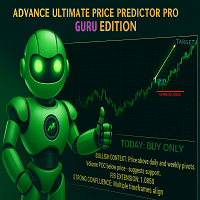
THE ADVANCE PRICE PREDICTOR - GURU EDITION Tired of Guesswork?
Meet the AI-Powered "Almighty Predictor" – Pinpoints High-Probability Targets Before the Move, With Surgical Precision
Stop chasing pips. Start attracting them. Our proprietary algorithm fuses Multi-Timeframe Analysis + Smart Money Concepts + Real-Time Confluence Scoring to give you a clear, calculated edge on every trade.
Are You Constantly Wondering…
"Is this the top, or will it keep going?"
"Where should I real
FREE

혁신적인 Trades Time Manager로 손쉽게 거래 루틴을 관리하세요. 이 강력한 도구는 지정된 시간에 주문 실행을 자동화하여 거래 방식을 변화시킵니다. 수동 개입 없이 구매에서 주문 설정에 이르기까지 다양한 거래 작업을 위한 개인화된 작업 목록을 만드십시오. 거래 시간 관리자 설치 및 입력 가이드 EA에 대한 알림을 받으려면 MT4/MT5 터미널에 URL을 추가하십시오(스크린샷 참조). MT4 버전 https://www.mql5.com/en/market/product/103716 MT5 버전 https://www.mql5.com/en/market/product/103715 수동 모니터링에 작별을 고하고 간소화된 효율성을 수용하십시오. 직관적인 인터페이스를 통해 기호, 실행 시간, 가격, 손절매(SL), 이익실현(TP) 포인트 및 로트 크기를 포함한 정확한 매개변수를 설정할 수 있습니다. 도구의 유연성은 시장 행동과 일치하는 적응형 반복 옵션으로 강조됩니

Product Name: HTF Candle Insight (EurUsd) - See the Big Picture Description: IMPORTANT: This version works EXCLUSIVELY on the EURUSD symbol. (It supports all broker prefixes/suffixes, e.g., pro.EURUSD, EURUSD.m, but will NOT work on Gold, Bitcoin, or other pairs). Experience the full power of "HTF Candle Insight" completely on EURUSD! Stop switching tabs constantly! This indicator allows you to visualize Higher Timeframe price action directly on your current trading chart. Whether you are a Sca
FREE

For those who love to follow Volume behavior here it is a little indicator that could be used as a replacement for the old and standard MT5 built-in volume indicator. The trick here is that this indicator paints the volume histogram based on the direction of the candle giving to the trader a quick "Heads Up" on what is happening, visually! It could be used to study and see for instance, the volume and past bars volume during (or, reaching) a peak (Tops and Bottoms). UP candles are shown in pale
FREE

The indicator is an analytical tool incorporating 37 different variations of moving averages developed by authors such as Patrick Mulloy, Mark Jurik, Chris Satchwell, Alan Hull, and others. It provides the capability for historical virtual testing. The indicator can be used on various instruments, including gold, cryptocurrencies, stock indices, currency pairs, and other assets. An integrated visual backtester allows users to simulate virtual trading positions, track results, and visually assess
FREE
Power Hedging X EA | Advanced Risk Management & Profit Protection Power Hedging X is a next-generation Expert Advisor designed for traders who want to control risk, maximize profit potential, and protect their accounts using strategic hedging techniques. This EA intelligently manages buy and sell positions to balance exposure, reduce drawdown, and secure profits even in volatile market conditions. Key Features: Automated Hedging Logic (Buy & Sell Balance)
Smart Recovery System for D
FREE
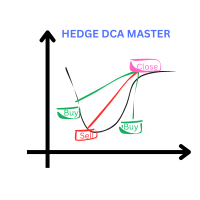
Wealth gained hastily will dwindle, but whoever gathers little by little will increase it.
This Expert is using DCA and Hedging Strategy. Live Account with startlot 0.04 : Hedge DCA Master HighRisk x4
Live Account with Middle Risk and recovery from loss other EA : https://www.mql5.com/en/signals/2289704
www.myfxbook. com/portfolio/hedge-dca-master/11230507 delete space before com I cut the loss and change the demo to Gold m15 because more happening on gold pair
The Key point: Use my cu
FREE

Unlock powerful breakout opportunities
The 123 Pattern is one of the most popular, powerful and flexible chart patterns. The pattern is made up of three price points: a bottom, a peak or valley, and a Fibonacci retracement between 38.2% and 71.8%. A pattern is considered valid when the price breaks beyond the last peak or valley, moment at which the indicator plots an arrow, rises an alert, and the trade can be placed. [ Installation Guide | Update Guide | Troubleshooting | FAQ | All Products ]

Unlock market continuations with the accurate pennants indicator
This indicator finds pennants , which are continuation patterns identified by converging trendlines surrounding a price consolidation period. Trades are signaled using a breakout period alongside the formation breakout. [ Installation Guide | Update Guide | Troubleshooting | FAQ | All Products ] Easy to use Customizable colors and sizes It implements breakout signals It implements alerts of all kinds
Optimal Usage To see pennants

Developed by Charles Le Beau and featured in Alexander Elder's books, the Chandelier Exit sets a trailing stop-loss based on the Average True Range (ATR). The indicator is designed to keep traders in a trend and prevent an early exit as long as the trend extends. Typically, the Chandelier Exit will be above prices during a downtrend and below prices during an uptrend.
Calculation
The original Chandelier Exit formula consists of three parts: a period high or period low, the Average True Rang
FREE

Forex17 Clock 는 MetaTrader 5를 위한 가볍고 미니멀한 유틸리티로, 브로커 서버 시간 및/또는 사용자가 조정한 시간을 차트에 직접 표시하도록 설계되었습니다. 이 제품의 목적은 차트 분석을 방해하지 않으면서 명확하고 정확한 시간 정보를 제공하여 차트를 깔끔하고 기능적으로 유지하는 것입니다. 이 시계는 패널, 배경, 테두리 또는 방해가 되는 시각적 요소 없이 텍스트만을 사용하여 차트에 표시됩니다. 이러한 설계는 낮은 리소스 사용량, 밝은 테마와 어두운 테마 모두에 대한 뛰어난 호환성, 그리고 가격 스케일과 캔들에 대한 완전한 존중을 보장합니다. 본 유틸리티는 단순함, 시각적 정돈, 안정성을 중시하는 트레이더를 위해 설계되었습니다. Forex17 Clock을 사용하면 텍스트가 표시될 차트의 모서리를 선택하고, 글꼴 크기와 색상을 조정하며, 서버 시간에 대한 시간 오프셋을 설정할 수 있습니다. 이를 통해 로컬 시간이나 시간대 차이와 같은 중요한 시간 기준을 차트에서 직접
FREE
MetaTrader 플랫폼 어플리케이션 스토어에서 MetaTrader 마켓에서 트레이딩 로봇을 구매하는 방법에 대해 알아 보십시오.
MQL5.community 결제 시스템은 페이팔, 은행 카드 및 인기 결제 시스템을 통한 거래를 지원합니다. 더 나은 고객 경험을 위해 구입하시기 전에 거래 로봇을 테스트하시는 것을 권장합니다.
트레이딩 기회를 놓치고 있어요:
- 무료 트레이딩 앱
- 복사용 8,000 이상의 시그널
- 금융 시장 개척을 위한 경제 뉴스
등록
로그인
계정이 없으시면, 가입하십시오
MQL5.com 웹사이트에 로그인을 하기 위해 쿠키를 허용하십시오.
브라우저에서 필요한 설정을 활성화하시지 않으면, 로그인할 수 없습니다.