 MetaTrader 5
 Эксперты
 Индикаторы
 Библиотеки
 Утилиты
 Виджеты
 Правила
Смотри обучающее видео по маркету на YouTube
Как купить торгового робота или индикатор
Запусти робота на
виртуальном хостинге
виртуальном хостинге
Протестируй индикатор/робота перед покупкой
Хочешь зарабатывать в Маркете?
Как подать продукт, чтобы его покупали
Бесплатные технические индикаторы для MetaTrader 5 - 50
 На основании сигналов технических индикаторов принимаются решения относительно открытия или закрытия сделки на фондовом и форекс-рынках. Суть индикаторов заключается в математическом преобразовании цены и/или объемов финансового инструмента для прогнозирования изменений цен в будущем.
Протестируйте технические индикаторы, чтобы лучше предсказывать поведение рынка и зарабатывать на этом.

True Move A/D
Чтение на уровне потока. Одна линия. Три объединённых сигнала. Стандартная линия накопления/распределения Чайкина использует один фактор — где находится закрытие внутри диапазона бара. True Move A/D использует три, взвешивая их по фактической надёжности. Композитная формула: K = 0,30 × Midpoint Bias + 0,70 × Close-to-Close Direction Вес 70% на импульс close-to-close является осознанным выбором. Где закрылась свеча относительно её открытия — это наиболее последовательный сигнал п
FREE
Professional Gold Trading Levels Indicator
Features: - Daily & Weekly Pivot Points - Fibonacci Retracement Levels - Round Number Levels - Customizable Colors & Fonts - Auto-Update Daily - Clean & Simple Interface
Perfect for Gold (XAUUSD) traders Reliable Support/Resistance levels Lightweight & Fast Performance Easy to install and use
Compatible with all MT5 accounts. No complex settings required! SimpleGoldLevels v1.0 - User Manual Professional Support & Resistance Levels
FREE

Вот перевод на русский язык: Также доступно в MetaTrader 4:
https://www.mql5.com/en/market/product/174746 Представляем: индикатор ZERO HOUR RUNNER БЕЗ ПЕРЕРИСОВКИ
Система, разработанная на основе одного принципа: Ясность + Тайминг + Дисциплина = Стабильность Чем ZERO HOUR RUNNER отличается? Без перерисовки. Без уловок.
Сигналы НЕ перерисовываются, не изменяются и не пересчитываются
То, что вы видите — это именно то, что вы получаете, даже после обновления графика Мгновенные сигналы дл
FREE
Динамический индикатор поддержки и сопротивления - универсальный инструмент, объединяющий уровни поддержки и сопротивления с динамикой рынка в реальном времени. Путем учета предыдущих дневных максимумов и минимумов он предоставляет ценную информацию о психологии рынка и выявляет потенциальные уровни разворота цены или прорыва. Благодаря способности адаптироваться к изменяющимся рыночным условиям и настраиваемым параметрам, трейдеры могут опережать тренды и принимать обоснованные решения. Этот ин
FREE
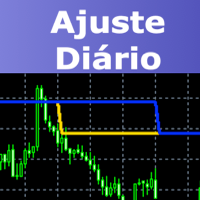
This indicator will draw two lines to represent the adjustment value, which can be used in both the Dollar and the Index.
The main advantage of this indicator is that it has two lines, one representing the adjustment calculated from the previous day and the other representing the adjustment calculated on the current day. The calculation of the adjustment on the current day is a great differential, since it will be possible to make operations in order to sleep bought or sold according to the ad
FREE
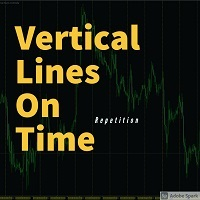
This indicator draws a vertical line repeatedly at the set time. The number of lines that can be set can be set arbitrarily. In addition, it is possible to set 4 types of lines. It is possible to change different times, colors, line types, etc. The time can be set to any time in minutes.
In the next version, we plan to display the high and low prices within the setting range.
FREE

ArgosWatch Drawdown Meter MT5 — Daily Loss & Maximum Drawdown Live Monitor
Most trading accounts and prop challenge attempts are not lost to a bad strategy. They are lost to arithmetic performed under pressure: trying to calculate mid-trade how much of today's loss allowance is already gone and whether the next position still fits inside it.
ArgosWatch Drawdown Meter answers that question continuously in real time, and adds something a simple readout cannot give you: an on-chart daily history
FREE
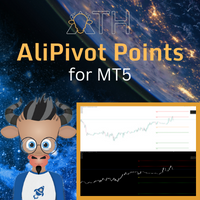
AliPivot Points is a Meta Trader 5 Indicator that draws you the latest pivot points. You can choose from timeframes ranging from 1 Minute to 1 Month. Calculation methods for pivot points includes: Classic Pivot Points Camarilla Pivot Points Fibonacci Pivot Points Woodie Pivot Points You can personalize the line colors, style, and width to suit your preference. The indicator displays values on the right side of the chart. AliPivot Points values can also be utilized by developers for creating Expe
FREE

The seven currencies mentioned are: GBP (British Pound): This is the currency of the United Kingdom. AUD (Australian Dollar): This is the currency of Australia. NZD (New Zealand Dollar): This is the currency of New Zealand. USD (United States Dollar): This is the currency of the United States. CAD (Canadian Dollar): This is the currency of Canada. CHF (Swiss Franc): This is the currency of Switzerland. JPY (Japanese Yen): This is the currency of Japan. Currency strength indexes provide a way to
FREE

Pause Manager Indicator (for EA Pause Manager)
What It Is: This is a lightweight chart indicator that works together with the EA Pause Manager utility. It displays the current status of your EAs and sends that information to the EA Pause Manager so it can pause/resume them correctly. Required for proper functioning of EA Pause Manager .
Features: Shows real-time status (ACTIVE / PAUSED) of the EA on the chart Displays EA ID (EA1–EA4), customizable via settings Minimal resource usage No input s
FREE

UZFX Modern Candle Timer Digital Clock v1.0
Профессиональный таймер обратного отсчета с современным цифровым интерфейсом для MetaTrader 5
Повысьте эффективность своей торговли с помощью UZFX Modern Candle Timer Digital Clock — лаконичного, точного и высокофункционального индикатора, разработанного для серьезных трейдеров, которые ценят ясность и профессионализм на своих графиках.
Ключевые особенности: Точный обратный отсчет по свечам: отображение в реальном времени оставшегося времени до закр
FREE

Name: BREAK MATRIX MTF Tagline: Trade Only The Breaks. Description: A main-chart replacement system that deletes noise. It doesn't draw on top of candles, it becomes the chart. 1. The Core - TLB Break Engine
Instead of time-based candles, each brick is a real Three Line Break. A new brick is created only when price breaks the High of the last LB bricks or the Low of the last LB bricks. No break = no new brick. 2. The Fusion - HTF / LTF Architecture LTF Engine (M15 default): Buil
FREE
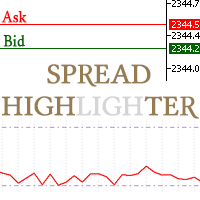
This spread indicator displays the actual spread of each candle. It highlights the maximum spread and the minimum spread of the chosen symbol. This indicator is very helpful to see in real time the spread evolution helping to avoid taking a trade when the spread is too high.
Inputs:
Print value in Points: if true displays the spread as a whole number
D isplay minimum and maximum spread of the past N days: select the number of days to consider the maximum and minimum spread
Automatically adj
FREE

Lazyyy Hotkeys & Period Separators Lazyyy Hotkeys & Period Separators is a lightweight productivity tool designed to speed up your chart navigation and improve market structure visualization in MetaTrader 5. It combines custom keyboard shortcuts with automatic period separators , helping traders stay focused, organized, and efficient during analysis. Key Features ️ Custom Hotkeys for Timeframes Instantly switch between timeframes using your keyboard: M1 → MN (fully customizable keys) No mo
FREE
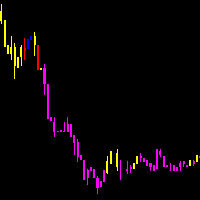
As médias coiote automatizam a leitura de analise de médias rápidas e lentas no saldo do volume e preço. Quando as médias estão em modo compra, a coloração do candle fica azul.
Quando as médias estão em modo venda, a coloração do candle fica magenta. Quando a coloração fica verde ou vermelho, temos a tomada das médias no volume mas não no preço, quando isso ocorre é um sinal de atenção.
A concepção do indicador é ser utilizado para operações em saída de consolidações na direção da tendencia do
FREE

Zigzag Indicator For RSI, To easily identify the highs and lows of the rsi signal. It is easier to observe divergent and convergent signals. Default setting: InpRsi =14 //Rsi Period InpDepth =12; // Depth InpDeviation =5; // Deviation InpBackstep =3; // Back Step
If you want open Exness account try this link : https://one.exness-track.com/a/teg5teg5 Dev buy taphu: Ha Van Tan - hatatrata - Trader's profile - MQL5 community Email: tan.ha@outlook.com
FREE

品种多空统计(Symbol Stats Board)是 MetaTrader 5 的纯图形面板指标:在图表上按【品种】分别统计「持仓订单」与「已关闭订单」的多空手数、多空盈亏,每个品种一行,末行汇总。 【两张表格】 · 持仓订单表:遍历当前持仓,按品种汇总 多单手数 / 多单盈亏 / 空单手数 / 空单盈亏(浮动盈亏,可选计入库存费)。 · 已关闭订单表:同样四列;统计区间可切换 今日 / 本周 / 本月 / 全部(按服务器时间计算,周以周一起始;盈亏默认含手续费与库存费,可分别关闭)。 · 汇总行:每张表末行为该表全部品种的合计;即使品种数超过显示上限,汇总仍统计全部品种。 · 多空归属:卖出平仓计入多单、买入平仓计入空单(与持仓方向相反),部分平仓按成交手数累加。 【交互】 · 底部按钮:今日 / 本周 / 本月 / 全部 切换统计区间;按品种 / 按盈亏 切换排序(A→Z 或盈亏从大到小);刷新 立即重算。 · 按住标题栏可拖动面板,拖动后不再自动跟随停靠角。 · 面板高度随品种数自动变化;超出图表高度时按缩放系数自动等比收缩,不会被裁切。 · 盈利绿色、亏损红色,便于快速区分。
FREE

Position and Deal Stats Board is a MetaTrader 5 panel indicator that builds two tables directly on the chart: per-symbol long/short lots and P/L for your open positions and for your closed deals, one row per symbol plus a totals row. TWO TABLES - Open Positions: walks the current positions and aggregates Buy Lots / Buy P/L / Sell Lots / Sell P/L per symbol (floating P/L; swap optional). - Closed Deals: the same four columns for closed deals; the period switches between Today / This week / This m
FREE
For Nasdaq trading, the most important principle is to know the trend of the fund.
This indicator with 6 green and red lights provides you with the daily path of this important indicator.
This indicator has been tested for 6 months and has a win rate of over 85%.
Be sure to contact me before purchasing to get the necessary instructions on how to use and set up this indicator.
You should use a broker that has dollar index, vix, and commodities. MT4 Version
You can contact us via Instagram, Teleg
FREE

The DFG Chart Indicator displays the historical DFG levels used in the DFG dashboard. These levels are generated dynamically using moving averages and Fibonacci ratios. The Fibonacci Bands automatically adjust to reflect changes in the price range and trend direction. The indicator also features buttons for selecting chart symbol and timeframe, along with a wide range of customization options. Key Features Dynamic DFG Levels
Automatically calculated using moving averages and Fibonacci ratios. H
FREE

WANT TO AUTOMATE THESE ZONES? Stop waiting for setups! The Smart SR Levels Sniper EA is now live. It reads these exact indicator zones, filters for high-probability "thin" zones , auto-calculates your risk , and targets the next SR levels for Take Profit . It can even scan all your open charts at once! Stop guessing where the market will turn. Let the volatility tell you. Smart SR Levels Sniper EA https://www.mql5.com/en/market/product/165191
LogicLadder SR Zones
------------------------
FREE

The Elsna ATR is a custom MetaTrader 5 indicator that combines two key features into one clean chart overlay: Average True Range (ATR) Display Calculates the current ATR value for the selected period (default = 14). Can show the value in pips or price units . Candle Countdown Timer Displays a live countdown showing how much time remains until the current candle closes. Updates every second, even when the market is quiet. This indicator helps traders quickly gauge market volatility (via ATR) and
FREE
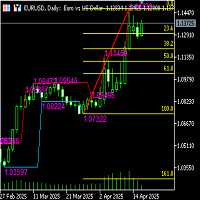
Functional description of automatic Fibonacci line indicator (including high and low channel lines) Indicator name Automatic Fibonacci retracement line + high and low channel auxiliary
Functional introduction This indicator combines the automatically identified high and low points of the band, automatically draws the Fibonacci retracement/extension line, and draws the highest and lowest price channel lines of the current analysis interval to provide traders with clearer support/resistance refe
FREE

Fusion Range MTF The Ultimate Multi-Timeframe Confluence Cockpit. Introduction The biggest challenge for any trader is not finding a signal, but confirming its validity across multiple timeframes. Fusion Range MTF is an advanced structural analysis dashboard that merges the power of the ZigZag (Classic & PSAR modes) with a high-end Visual Gauge System for 10 simultaneous timeframes (from Monthly down to 15M). How Does It Work? The indicator calculates an "Institutional Range" in real
FREE

The indicator is based on the relationship between two sets of Stochastic lines. The first set consists of 6 Stochastic with periods: 5, 8, 10, 12, 14, 16. The second set consists of 6 Stochastic with periods: 34, 39, 44, 50, 55, 60. These periods are customizable. Input parameters Stochastic MA Method Method of calculation ===== Short-term ===== Stochastic #1 %K Period Stochastic #2 %K Period Stochastic #3 %K Period Stochastic #4 %K Period Stochastic #5 %K Period Stochastic #6 %K Period Short
FREE

Neon Candle Timer is a sleek, modern digital countdown timer for MetaTrader 5, specifically designed to help traders monitor the exact remaining time of the current candle. It is an essential utility for Price Action, candlestick patterns, and Scalping strategies, where every second matters before executing a trade. Key Features: Native Multi-Language Support: Easily switch the indicator display language between English ("Left: 00:00") and Spanish ("Faltan: 00:00") directly from the input settin
FREE

Индикатор тренда (флета) с ценовым каналом.
Торговля Покупка - цена пересекла центральную линию снизу вверх (свеча закрылась выше линии), канал ориентирован горизонтально (желтая линия) или вверх (зеленая линия). Перевод в безубыток после достижения ценой противоположной границы канала. Закрытие позиции после формирования условий для продажи. Продажа - цена пересекла центральную линию сверху вниз (свеча закрылась ниже линии), канал ориентирован горизонтально (желтая линия) или вниз (красная лин
FREE

DONCHIAN CHANNEL DC Это индикатор тренда, разработанный “ Richard Donchian”, состоящий из 3 слоев: верхнего канала, нижнего канала и среднего канала. Он создается на канале Donchian путем нанесения на ценовой график самой высокой и самой низкой цены, достигнутой за прошедший период. Он также используется для измерения волатильности рынка, поскольку это расширяющийся/сокращающийся канал в зависимости от увеличения/уменьшения волатильности цен. Method 0; Чертеж индикатора канала Donchian. BUY/SELL
FREE

BarionQuant MACD Color Lite displays a custom four-color MACD histogram that makes momentum shifts easy to read at a glance. DIF and DEF lines are included; divergence detection is reserved for the paid Divergence Pro edition. HOW IT WORKS DIF = Fast EMA(12) minus Slow EMA(26) DEF = Smoothed signal line of DIF Energy = (DIF − DEF) × 2, split into four histogram colors: Above zero, lengthening → red (momentum building) Above zero, shortening → aqua (momentum fading) Below zero, lengthening → gree
FREE

KS Double Line Scalp
Это комбинированный индикатор на основе двух скользящих средних, разработанный преимущественно для скальпинга на младших таймфреймах. Он сочетает в себе две техники сглаживания:
KS TEMA (Тройная экспоненциальная скользящая средняя)
KSMA
Цель индикатора — обеспечить четкое отображение направления тренда и его импульса с минимальным запаздыванием (лагом). Одновременное отображение обеих линий позволяет трейдерам выявлять высоковероятные сетапы для скальпинга в моменты взаи
FREE

UZFX FTMO Guardian PRO — это профессиональный индикатор для мониторинга счетов в MetaTrader 5, разработанный для того, чтобы помочь трейдерам безопасно проходить FTMO-челленджи и уверенно управлять финансируемыми счетами.
В отличие от советников, этот инструмент не открывает, не изменяет и не закрывает сделки. Он работает как торговый помощник в режиме реального времени, который постоянно отслеживает ваш счет и рассчитывает все важные показатели FTMO, пока вы торгуете вручную.
На панели инстру
FREE

Shadow System Candles - AI Trend Visualization
Concept "Stop trading in the dark. Equip your chart with Night Vision."
Shadow System Candles is the visual core of the "Shadow Operation" project. It eliminates market noise and visualizes the true direction of the trend using AI-based logic (ADX + MA integration).
Note: This tool does not generate buy/sell arrows. It is designed to train your eyes to recognize "Active Trends" and "Dangerous Ranges.
Key Features ・AI Logic Coloring[/b]: Automat
FREE

You may find this indicator helpfull if you are following a session based strategy. The bars are colored according to the sessions. Everything is customisable.
Settings: + Asia Session: zime, color, high, low + London Session: zime, color, high, low + US Session: zime, color, high, low
Please feel free to comment if you wish a feature and/or give a review. Thanks.
FREE

"Driver Road Bands" indicator that is designed to be used in the 1H, 4H and 1D timeframes in the most ideal way. If we compare timeframes to roads and streets; main streets and highways with high traffic volume are similar to high-time timeframes in technical analysis. If you can interpret the curvilinear and linear lines drawn by this indicator on the graphic screen with your geometric perspective and develop your own buy and sell strategies; you may have the key to being a successful trader.
FREE

The Pivot Indicator is a vital tool for technical analysis used by traders in the financial markets. Designed to assist in identifying potential reversal points or trend changes, this indicator provides valuable insights into key levels in the market. Key features of the Pivot Indicator include: Automatic Calculations: The Pivot Indicator automatically calculates Pivot Point, Support, and Resistance levels based on the previous period's high, low, and close prices. This eliminates the complexity
FREE

This is my ea Gold Structure Hunter EA
https://www.mql5.com/en/market/product/174076?utm SMART MARKET DASHBOARD Everything You Need. One Clear View. Make your market analysis faster, cleaner, and more organized with a dashboard that brings important price, VWAP, opening-price, and trend information together in one place. Instead of checking multiple indicators separately, the dashboard gives you a quick market overview so you can understand where price is trading and what the current t
FREE

Индикатор делает расчеты по данным, получаемым из из одной из семи(7) скользящих средних и окрашивает график. Простые скользящие средние - это те, у которых всего один важный параметр расчета - период. Сдвиг в индикаторе не используется. Есть настройка shift trick она используется для сглаживания результата расчетов. Можно увидеть изменения, если уменьшить этот параметр до 1(минимальное значение). shift trick должен быть всегда меньше значения периода.
Доступные средние: MA Simple
FREE
Tick imbalance bars (TIB), described in the book Advances in Financial Machine Learning (2018) by Marcos López de Prado. Indicator that show candlestick bars with an different sampling method than time fixed. Real time data is sourced to the indicator and it may be used as substitute of the default graph. Each bar is formed when a predefined tick balance is exceeded, showing in the graph the OHLC of this cluster of ticks. The input variable is the amount of ticks of each bar. The indicator may
FREE
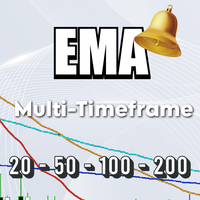
The EMA Navigator Pro is an advanced version of the popular EMA indicator, designed to provide superior flexibility and multi-timeframe analysis capabilities. This indicator not only displays EMA lines but also offers a powerful alert system to ensure you never miss a crucial signal. Key Features: Multi-Timeframe Support: You can assign a separate timeframe to each individual EMA line, allowing you to analyze long-term (e.g., D1) and short-term (e.g., H1) trends on the same chart. Automatic Cro
FREE

Reversal Oscillator — Advanced Momentum Shift Detector
Reversal Oscillator is a free indicator designed to highlight price zones that are statistically outside their normal movement patterns, helping traders anticipate potential turning points before they occur. Unlike traditional oscillators that react mainly to overbought/oversold conditions, this indicator applies third derivative analysis (the "acceleration of the acceleration" of price) calculated using two independent methods within a n
FREE

ARC VELOCITY PULSE Parabolic SAR Direction + ROC Recovery for XAUUSD
Arc Velocity Pulse is a professional Gold trading indicator designed to identify trend-aligned recovery opportunities supported by directional movement, momentum acceleration, and volatility-based trade levels.
The indicator combines Parabolic SAR direction analysis with Rate of Change recovery confirmation, an internal Gann and Fibonacci price-alignment engine, confi
FREE

ADR, AWR & AMR Indicator: Comprehensive Trading Guide Try "Average Daily Range Scalper":
https://www.mql5.com/en/market/product/154469 Core Concepts ADR (Average Daily Range) Definition : The average distance between daily high and low prices over a specified lookback period (typically 14-20 days) Purpose : Measures daily volatility expectations, identifies range-bound versus trending days, sets realistic intraday profit targets Key Insight : Markets tend to respect their average volatility - d
FREE

RSI Condition:
The Relative Strength Index (RSI) for the current period is below a specified low threshold (RsiLow). This indicates oversold conditions. Candlestick Pattern:
It checks for a specific candlestick pattern across three consecutive candles: The current candle (1) closes higher than it opens (bullish) The previous candle (2) closes lower than it opens (bearish) The current candle's close is below the high of the previous candle Price Action:
The alert also checks that the current
FREE

Индикатор временных рамок Wormhole для MetaTrader 5 (MT5) — это не просто еще один инструмент для торговли, это ваше конкурентное преимущество на финансовых рынках. Разработанный как для начинающих, так и для профессиональных трейдеров, Wormhole изменяет подход к анализу данных и принятию решений, помогая вам всегда быть на шаг впереди. Почему вам нужен (бесплатный) индикатор Wormhole Перехитрите конкурентов: Возможность отображать две временные рамки на одном графике одновременно означает, что
FREE

Помощник для торговой системы SystZ . Чертит трендовые линии по соседним экстремумам зигзага. Условие для линии сопротивления - правый должен быть ниже левого. Для линии поддержки - правый выше левого. Не допускается, чтобы между экстремумами, по которым проводится трендовая линии были другие. Экстремумы, удовлетворяющие этим условиям, отмечены символом фрактала. Закрытие свечи за линией - сигнал для открытия позиции.
FREE

WHY ECONOMIC CALENDAR PRO?
Trading without knowing when high-impact news is scheduled is like driving blindfolded. Sudden price spikes, spread widening, and stop-loss hunts are almost always tied to economic releases. Economic Calendar Pro puts the entire week's news schedule right on your chart — always visible, always up to date — so you are never caught off guard again.
Unlike web-based calendars that require switching windows or relying on a browser, this indicator is embedded directly in
FREE

Spread Info and Candle Timer Panel FREE - Essential Info Tool
Small, lightweight and fast information panel for scalpers and intraday traders. Displays real-time Spread in points and pips, current Ask/Bid prices and countdown timer to candle close.
Never miss a candle close again and always see your real spread.
FREE, No DLL, Lightweight & Fast - will not slow down your terminal.
FEATURES: Real-time Spread in points and pips Real-time Ask and Bid prices Candle Timer with countdown mm:
FREE
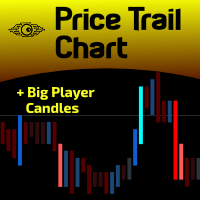
For those who hate candlesticks in lower timeframes (M1 through M15) we "invented" a clean new way to follow Price movement and displacement (volatility) called Price Trail Chart . The big "secret" is to get rid of those annoying candle wicks and draw the whole complete candle without them, this way we get a cleaner chart and a new view of the Price Path. No Open or Close markings, just LOW's and HIGH's, full body candle.
Additionaly we inserted a Volume monitor from our Best Downloaded indicato
FREE

If you like this product, please give it a 5 star rating as a token of appreciation.
This indicator plots horizontal trend lines at the opening price of each quarter (Q1–Q4) on the chart. These lines visually represent quarterly open levels of the current year, which traders often use as support/resistance or reference points. Automatically plots Q1–Q4 opening levels as trend lines on the chart. Lines are dashed, colored, and labeled. Handles both current and historical quarters. Cleans up line
FREE

VWAP Pro by Angel’s is an advanced Volume Weighted Average Price (VWAP) indicator designed for traders seeking precision and clarity in their trading decisions. With this indicator, you can instantly identify market direction and key support and resistance zones based on volume. Key Features: Simple or Double Mode: Choose between a classic VWAP or a double VWAP for greater sensitivity and trend filtering. Configurable Periods: Adjust the calculation periods according to your trading strategy and
FREE

The CSI Currency Strength indicator ranks all ten G10 currencies by momentum strength using a multi-lookback Z-score model, displayed as a live on-chart panel. Attached to any chart, it runs independently of the chart's symbol or timeframe. The methodology follows the multi-horizon momentum framework from Asness, Moskowitz & Pedersen (2013), applied cross-sectionally to G10 currencies. Rather than comparing a single bar against the previous close — which introduces a cliff-edge artifact at each
FREE

DiverX - это мощный многофункциональный индикатор дивергенций, разработанный для платформы MetaTrader 5 . Он позволяет выявлять как регулярные, так и скрытые дивергенции на основе пяти популярных технических индикаторов: RSI (Relative Strength Index) , RVI (Relative Vigor Index) , Stochastic Oscillator , CCI (Commodity Channel Index) и MACD (Moving Average Convergence Divergence) . Индикатор отображает результаты непосредственно на основном графике, предоставляя визуальные линии, стрелки и метк
FREE
ToolBot Probabilistic Analysis - FREE An effective indicator for your negotiations
The toolbot indicator brings the calculation of candles and a probabilistic analysis so that you have more security on your own.
Also test our FREE tops and bottoms indicator: : https://www.mql5.com/pt/market/product/52385#description Also test our FREE (RSI, ATR, ADX, OBV) indicator: https://www.mql5.com/pt/market/product/53448#description
Try our EA ToolBot for free: https://www.mql5.com/market/prod
FREE

Stochastic + RSI Multi-Timeframe Dashboard with Momentum Strength Need Trade Assistant? Trade Panel Pro MT 5
Please leave a review, if you like this.
OVERVIEW A professional multi-timeframe dashboard indicator that displays Stochastic Oscillator and RSI (Relative Strength Index) values from 7 different timeframes simultaneously on a single compact panel. Perfect for scalpers and day traders who need quick m
FREE

DaySpread MinMax — индикатор спреда с Min/Max за день
Что показывает: Текущий спред (Cur) Минимальный спред за текущий день (Min.day) Максимальный спред за текущий день (Max.day) Принцип работы: Раз в 1 секунду индикатор считывает цены Bid/Ask по текущему символу. Текущий спред считается как (Ask − Bid) / Point (в пунктах). Min.day и Max.day обновляются в течение дня и сбрасываются при смене торгового дня (по D1). Данные выводятся на график в виде компактной текстовой панели. Панель можно перета
FREE

GomerAI KAGI – Структура рынка и подтверждение тренда Цена: $0 Платформа: MetaTrader 5 Тип: Индикатор рыночных условий (неавтоматический) Обзор Этот индикатор является частью GomerAI Market Research Framework — набора аналитических инструментов, предназначенных для изучения структуры рынка и торговых условий. Каждый индикатор анализирует отдельный аспект рыночного поведения, помогая трейдерам и автоматическим торговым системам лучше понимать текущую рыночную ситуацию. GomerAI KAGI оценивает напр
FREE

Индикатор PipTick Fibo позволяет отображать уровни коррекции Фибоначчи, которые представляют собой значительные уровни поддержки и сопротивления. Диапазон для расчета индикатора может быть выбран из предыдущего дня, недели, месяца, года или заданной пользователем сессии.
Уровни 100 % (High) диапазона предыдущей сессии. 0 % (Low) диапазона предыдущей сессии. 76,4 % диапазона предыдущей сессии. 61,8 % диапазона предыдущей сессии. 50 % диапазона предыдущей сессии. 38,2 % диапазона предыдущей сесси
FREE

True Days is a tool designed specifically for the trader who wants to catch intraday volatility in price charts. True day makes it easier for the trader to avoid trading in the dead zone - a period in time where markets are considered dead or non volatile. The trader can concentrate on finding opportunities only during periods of profound market movements. By default the indicator gives you a true day starting at 02:00 to 19:00 hours GMT+2. You can adjust according to your Time Zone. By deafult
FREE

RBM ATR PRO v1.10 Quem opera mercado volátil sabe como é ruim tomar stop por causa de uma violinada de pavio e ver o preço andar forte a favor logo depois. O RBM ATR PRO foi desenvolvido exatamente para resolver isso. Ele evolui o indicador clássico de volatilidade combinando a leitura do ATR com dois níveis independentes de suavização. A linha no gráfico fica limpa e objetiva: verde para estrutura de alta e vermelha quando o mercado vira para a baixa. Funciona perfeitamente para rastrear a ten
FREE

The CV Ribbon Indicator dynamically visualizes market trends using modern ribbon-based technology. By combining multiple moving averages, the indicator helps traders identify trend direction, momentum and market phases with clarity and speed. Features: Dynamic ribbon visualization Trend & momentum detection Modern and clean design Suitable for Forex, Gold, Indices, Crypto and Stocks Supports multiple trading styles Disclaimer: This product is intended for analytical purposes only and does not co
FREE

Indicador TriYep v1.02 – Más del 70% de señales precisas Indicador TriYep v1.02 – Más del 70% de señales precisas Presentación El indicador TriYep v1.02 se creó con un único propósito: ofrecer señales totalmente fiables. Esta versión gratuita está calibrada y optimizada específicamente para el par USD/JPY en el marco temporal M15 , donde su lógica alcanza su máximo rendimiento. Mientras que otros indicadores inundan tu gráfico con señales falsas y te hacen perder operación tras operación, hemos
FREE

Новое предупреждение о свечах, предупреждение появляется в соответствии с временным периодом, на котором оно размещено. Индикатор работает на любом активе, предупреждение может быть отключено в любое время, без необходимости удаления индикатора с графика. Это отлично подходит для тех, кто не может постоянно следить за графиком. Крепкие объятия !! Novoye preduprezhdeniye o svechakh, preduprezhdeniye poyavlyayetsya v sootvetstvii s vremennym periodom, na kotorom ono razmeshcheno. Indikator rabot
FREE

Market Sessions Clock - это небольшая панель, которая сразу показывает, какие рынки открыты сейчас и когда откроется или закроется следующий.
Как это работает - Четыре сессии: Сидней, Токио, Лондон и Нью-Йорк. У каждой свой переключатель и часы. - Часы задаются по местному времени каждого рынка (например, Лондон 08:00-17:00), летнее время для Сиднея, Лондона и Нью-Йорка учитывается автоматически. - Для каждой сессии панель показывает состояние (открыта или закрыта), время до закрытия или следую
FREE

Account Info Panel выводит цифры, которые вы проверяете чаще всего, в одну небольшую панель на графике, чтобы не переключаться на вкладку «Торговля».
Что показывает - Баланс и средства. - Плавающая прибыль/убыток открытых позиций. - Закрыто сегодня: прибыль, своп, комиссия и сборы по сделкам, закрытым с начала серверного дня. Пополнения и выводы не учитываются. - Использованная маржа и свободная маржа. - Уровень маржи, выделяется, когда опускается ниже 200%. - Просадка за сегодня: насколько сре
FREE

Spread and Swap Info показывает торговые издержки и временные параметры текущего символа в небольшой панели, чтобы новички могли проверить их, не открывая спецификацию символа.
Что показывает - Спред в пунктах, с пометкой "(fixed)", если брокер даёт фиксированный спред. - Своп long / short с правильной единицей для режима свопа символа: пункты, валюта (базовая, маржинальная или валюта счёта), проценты годовых или "reopen". Если свопы отключены или оба равны нулю, отображается "Swap: none". - Де
FREE

Chart Navigator MT5 Light — мини-карта для быстрого перемещения по графику цены и оперативного перехода к вашим меткам на нём. Данный индикатор добавляет на график компактную мини-карту всего ценового графика. Эта карта помогает быстро перемещаться по истории и возвращаться к важным местам, отмеченным вертикальными линиями. Главная польза такого простого навигатора — не прокрутка графика, а быстрый переход к нужной области без мучительного скроллинга при ручном поиске. Если на графике поставить
FREE

Общее описание Candle Countdown - это визуальный индикатор для MetaTrader 5, который отображает время до закрытия текущей свечи в реальном времени. Индикатор представляет собой информационные панели, привязанные к линиям Bid и Ask, показывающие обратный отсчет времени, тип текущей свечи и другую полезную информацию. Основные возможности 1. Отображение времени свечи Обратный отсчет : Время до закрытия свечи в формате MM:SS Прошедшее время : Время с момента открытия свечи Процентное завершение
FREE

Stochastic Signal Pro MTF – L'Indicateur Ultime pour des Signaux Précis et Multi-Timeframes ! Pourquoi Choisir Stochastic Signal Pro MTF ? Stochastic Signal Pro MTF est un indicateur professionnel et innovant conçu pour les traders qui recherchent des signaux fiables basés sur l'indicateur Stochastique, validés sur plusieurs timeframes . Que vous soyez un scalper, day trader ou swing trader , cet outil vous offre une analyse complète et visuelle pour prendre des décisions éclairées.
FREE

# MiniBull Board
**Version 1.14 — MetaTrader 5 indicator (separate window)**
**11 languages: English, Turkish, Russian, Chinese, Spanish, Portuguese, Japanese, German, French, Italian, Korean** — automatically in the language of your MetaTrader terminal, or chosen with a single input.
MiniBull Board is a compact watch-list dashboard for MetaTrader 5. For every symbol you choose it shows where the price stands today, this week and this month: the current price, the day / week / month opening
FREE

Normal Parabolic SAR with label of long or short state. Tells also "Parabolic long" and "short". Can be used in multitimeframe layouts together with Swiss HolyGrail indicator or in different timeframes. So, if all the indicators show "long" or "short" you can be sure that the risk of a wrong direction is small. The standard values for Parabolic SAR are 0.02 for step and 0.2 for maximum. You may experiment with changing the maximum to get smother curves. Note that changes in parabolic SAR are la
FREE
А знаете ли вы, почему MetaTrader Market - лучшее место для продажи торговых стратегий и технических индикаторов? Разработчику у нас не нужно тратить время и силы на рекламу, защиту программ и расчеты с покупателями. Всё это уже сделано.

Вы упускаете торговые возможности:
- Бесплатные приложения для трейдинга
- 8 000+ сигналов для копирования
- Экономические новости для анализа финансовых рынков
Регистрация
Вход
Вы принимаете политику сайта и условия использования
Если у вас нет учетной записи, зарегистрируйтесь