 MetaTrader 5
 エキスパート
 インディケータ
 ライブラリ
 ユーティリティ
 ウィジェット
 ルール
YouTubeにあるマーケットチュートリアルビデオをご覧ください
ロボットや指標を購入する
仮想ホスティングで
EAを実行
EAを実行
ロボットや指標を購入前にテストする
マーケットで収入を得る
販売のためにプロダクトをプレゼンテーションする方法
MetaTrader 5のための無料のテクニカル指標 - 50
 テクニカル指標からのシグナルは、株式および外国為替市場での取引の開始と終了に重要な役割を果たします。指標の本質は、将来の価格変動を予測することを目的とした金融銘柄価格の数学的変換です。
テクニカル指標をテストして、市場の動きとそれからの利益をより正確に予測します。
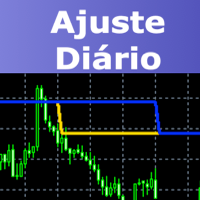
This indicator will draw two lines to represent the adjustment value, which can be used in both the Dollar and the Index.
The main advantage of this indicator is that it has two lines, one representing the adjustment calculated from the previous day and the other representing the adjustment calculated on the current day. The calculation of the adjustment on the current day is a great differential, since it will be possible to make operations in order to sleep bought or sold according to the ad
FREE
This indicator draws a vertical line repeatedly at the set time. The number of lines that can be set can be set arbitrarily. In addition, it is possible to set 4 types of lines. It is possible to change different times, colors, line types, etc. The time can be set to any time in minutes.
In the next version, we plan to display the high and low prices within the setting range.
FREE

ArgosWatch Drawdown Meter MT5 — Daily Loss & Maximum Drawdown Live Monitor
Most trading accounts and prop challenge attempts are not lost to a bad strategy. They are lost to arithmetic performed under pressure: trying to calculate mid-trade how much of today's loss allowance is already gone and whether the next position still fits inside it.
ArgosWatch Drawdown Meter answers that question continuously in real time, and adds something a simple readout cannot give you: an on-chart daily history
FREE
AliPivot Points is a Meta Trader 5 Indicator that draws you the latest pivot points. You can choose from timeframes ranging from 1 Minute to 1 Month. Calculation methods for pivot points includes: Classic Pivot Points Camarilla Pivot Points Fibonacci Pivot Points Woodie Pivot Points You can personalize the line colors, style, and width to suit your preference. The indicator displays values on the right side of the chart. AliPivot Points values can also be utilized by developers for creating Expe
FREE

The seven currencies mentioned are: GBP (British Pound): This is the currency of the United Kingdom. AUD (Australian Dollar): This is the currency of Australia. NZD (New Zealand Dollar): This is the currency of New Zealand. USD (United States Dollar): This is the currency of the United States. CAD (Canadian Dollar): This is the currency of Canada. CHF (Swiss Franc): This is the currency of Switzerland. JPY (Japanese Yen): This is the currency of Japan. Currency strength indexes provide a way to
FREE

Pause Manager Indicator (for EA Pause Manager)
What It Is: This is a lightweight chart indicator that works together with the EA Pause Manager utility. It displays the current status of your EAs and sends that information to the EA Pause Manager so it can pause/resume them correctly. Required for proper functioning of EA Pause Manager .
Features: Shows real-time status (ACTIVE / PAUSED) of the EA on the chart Displays EA ID (EA1–EA4), customizable via settings Minimal resource usage No input s
FREE

UZFX モダン・キャンドル・タイマー デジタルクロック v1.0
MetaTrader 5 向け、モダンなデジタルインターフェースを備えたプロフェッショナルなカウントダウンタイマー
チャート上の明快さとプロフェッショナリズムを重視する真剣なトレーダーのために設計された、洗練された、正確で、高機能なインジケーター「UZFX モダン・キャンドル・タイマー デジタルクロック」で、あなたのトレード体験を向上させましょう。
主な機能: 正確なローソク足カウントダウン:現在のローソク足が閉じるまでの残り時間を、大きく見やすいデジタル形式(MM:SS)でリアルタイムに表示します。 ダイナミックな進行バー:ローソク足の進行状況を視覚的に表示し、ローソク足が終了に近づくにつれて、緑からオレンジ、赤へと色が変わるアラート機能付き。 包括的な市場情報:現在の銘柄、時間足、ライブスプレッドを一目で確認できます。 フローティング損益パネル:オープンポジションの合計浮動損益を、プラス/マイナスの色分けで明確に監視・表示します。 プロフェッショナルな日付表示:チャート上の状況把握を強化するため、曜日と日付の
FREE

Name: BREAK MATRIX MTF Tagline: Trade Only The Breaks. Description: A main-chart replacement system that deletes noise. It doesn't draw on top of candles, it becomes the chart. 1. The Core - TLB Break Engine
Instead of time-based candles, each brick is a real Three Line Break. A new brick is created only when price breaks the High of the last LB bricks or the Low of the last LB bricks. No break = no new brick. 2. The Fusion - HTF / LTF Architecture LTF Engine (M15 default): Buil
FREE
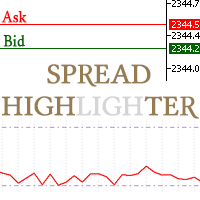
This spread indicator displays the actual spread of each candle. It highlights the maximum spread and the minimum spread of the chosen symbol. This indicator is very helpful to see in real time the spread evolution helping to avoid taking a trade when the spread is too high.
Inputs:
Print value in Points: if true displays the spread as a whole number
D isplay minimum and maximum spread of the past N days: select the number of days to consider the maximum and minimum spread
Automatically adj
FREE

Lazyyy Hotkeys & Period Separators Lazyyy Hotkeys & Period Separators is a lightweight productivity tool designed to speed up your chart navigation and improve market structure visualization in MetaTrader 5. It combines custom keyboard shortcuts with automatic period separators , helping traders stay focused, organized, and efficient during analysis. Key Features ️ Custom Hotkeys for Timeframes Instantly switch between timeframes using your keyboard: M1 → MN (fully customizable keys) No mo
FREE
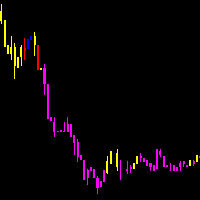
As médias coiote automatizam a leitura de analise de médias rápidas e lentas no saldo do volume e preço. Quando as médias estão em modo compra, a coloração do candle fica azul.
Quando as médias estão em modo venda, a coloração do candle fica magenta. Quando a coloração fica verde ou vermelho, temos a tomada das médias no volume mas não no preço, quando isso ocorre é um sinal de atenção.
A concepção do indicador é ser utilizado para operações em saída de consolidações na direção da tendencia do
FREE

Zigzag Indicator For RSI, To easily identify the highs and lows of the rsi signal. It is easier to observe divergent and convergent signals. Default setting: InpRsi =14 //Rsi Period InpDepth =12; // Depth InpDeviation =5; // Deviation InpBackstep =3; // Back Step
If you want open Exness account try this link : https://one.exness-track.com/a/teg5teg5 Dev buy taphu: Ha Van Tan - hatatrata - Trader's profile - MQL5 community Email: tan.ha@outlook.com
FREE

品种多空统计(Symbol Stats Board)是 MetaTrader 5 的纯图形面板指标:在图表上按【品种】分别统计「持仓订单」与「已关闭订单」的多空手数、多空盈亏,每个品种一行,末行汇总。 【两张表格】 · 持仓订单表:遍历当前持仓,按品种汇总 多单手数 / 多单盈亏 / 空单手数 / 空单盈亏(浮动盈亏,可选计入库存费)。 · 已关闭订单表:同样四列;统计区间可切换 今日 / 本周 / 本月 / 全部(按服务器时间计算,周以周一起始;盈亏默认含手续费与库存费,可分别关闭)。 · 汇总行:每张表末行为该表全部品种的合计;即使品种数超过显示上限,汇总仍统计全部品种。 · 多空归属:卖出平仓计入多单、买入平仓计入空单(与持仓方向相反),部分平仓按成交手数累加。 【交互】 · 底部按钮:今日 / 本周 / 本月 / 全部 切换统计区间;按品种 / 按盈亏 切换排序(A→Z 或盈亏从大到小);刷新 立即重算。 · 按住标题栏可拖动面板,拖动后不再自动跟随停靠角。 · 面板高度随品种数自动变化;超出图表高度时按缩放系数自动等比收缩,不会被裁切。 · 盈利绿色、亏损红色,便于快速区分。
FREE

Position and Deal Stats Board is a MetaTrader 5 panel indicator that builds two tables directly on the chart: per-symbol long/short lots and P/L for your open positions and for your closed deals, one row per symbol plus a totals row. TWO TABLES - Open Positions: walks the current positions and aggregates Buy Lots / Buy P/L / Sell Lots / Sell P/L per symbol (floating P/L; swap optional). - Closed Deals: the same four columns for closed deals; the period switches between Today / This week / This m
FREE

For Nasdaq trading, the most important principle is to know the trend of the fund.
This indicator with 6 green and red lights provides you with the daily path of this important indicator.
This indicator has been tested for 6 months and has a win rate of over 85%.
Be sure to contact me before purchasing to get the necessary instructions on how to use and set up this indicator.
You should use a broker that has dollar index, vix, and commodities. MT4 Version
You can contact us via Instagram, Teleg
FREE

The DFG Chart Indicator displays the historical DFG levels used in the DFG dashboard. These levels are generated dynamically using moving averages and Fibonacci ratios. The Fibonacci Bands automatically adjust to reflect changes in the price range and trend direction. The indicator also features buttons for selecting chart symbol and timeframe, along with a wide range of customization options. Key Features Dynamic DFG Levels
Automatically calculated using moving averages and Fibonacci ratios. H
FREE

WANT TO AUTOMATE THESE ZONES? Stop waiting for setups! The Smart SR Levels Sniper EA is now live. It reads these exact indicator zones, filters for high-probability "thin" zones , auto-calculates your risk , and targets the next SR levels for Take Profit . It can even scan all your open charts at once! Stop guessing where the market will turn. Let the volatility tell you. Smart SR Levels Sniper EA https://www.mql5.com/en/market/product/165191
LogicLadder SR Zones
------------------------
FREE

The Elsna ATR is a custom MetaTrader 5 indicator that combines two key features into one clean chart overlay: Average True Range (ATR) Display Calculates the current ATR value for the selected period (default = 14). Can show the value in pips or price units . Candle Countdown Timer Displays a live countdown showing how much time remains until the current candle closes. Updates every second, even when the market is quiet. This indicator helps traders quickly gauge market volatility (via ATR) and
FREE
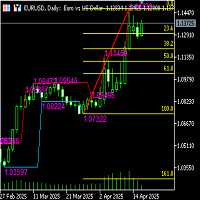
Functional description of automatic Fibonacci line indicator (including high and low channel lines) Indicator name Automatic Fibonacci retracement line + high and low channel auxiliary
Functional introduction This indicator combines the automatically identified high and low points of the band, automatically draws the Fibonacci retracement/extension line, and draws the highest and lowest price channel lines of the current analysis interval to provide traders with clearer support/resistance refe
FREE

Fusion Range MTF The Ultimate Multi-Timeframe Confluence Cockpit. Introduction The biggest challenge for any trader is not finding a signal, but confirming its validity across multiple timeframes. Fusion Range MTF is an advanced structural analysis dashboard that merges the power of the ZigZag (Classic & PSAR modes) with a high-end Visual Gauge System for 10 simultaneous timeframes (from Monthly down to 15M). How Does It Work? The indicator calculates an "Institutional Range" in real
FREE

The indicator is based on the relationship between two sets of Stochastic lines. The first set consists of 6 Stochastic with periods: 5, 8, 10, 12, 14, 16. The second set consists of 6 Stochastic with periods: 34, 39, 44, 50, 55, 60. These periods are customizable. Input parameters Stochastic MA Method Method of calculation ===== Short-term ===== Stochastic #1 %K Period Stochastic #2 %K Period Stochastic #3 %K Period Stochastic #4 %K Period Stochastic #5 %K Period Stochastic #6 %K Period Short
FREE

Neon Candle Timer is a sleek, modern digital countdown timer for MetaTrader 5, specifically designed to help traders monitor the exact remaining time of the current candle. It is an essential utility for Price Action, candlestick patterns, and Scalping strategies, where every second matters before executing a trade. Key Features: Native Multi-Language Support: Easily switch the indicator display language between English ("Left: 00:00") and Spanish ("Faltan: 00:00") directly from the input settin
FREE

The indicator of trend (flat) with a price channel.
Trading Buy - the price have crossed the central line upwards (the candlestick has closed above the line) and the channel is oriented horizontally (yellow line) or directed upwards(green line). Move to breakeven when reaching the opposite border of the channel. Close positions when conditions for selling are formed. Sell - the price have crossed the central line downwards (the candlestick has closed below the line) and the channel is oriented
FREE

DONCHIAN CHANNEL DC It is a trend indicator developed by “Richard Donchian”, consisting of 3 layers, the upper channel, the lower channel and the middle channel. It is created on the Donchian Channel by plotting the highest and lowest prices reached in the past period on the price chart. It is also used to measure the volatility of the market, as it is an expanding/contracting channel according to the increase/decrease of price volatility. Method 0; Donchian channel indicator drawing. BUY/SELL S
FREE

BarionQuant MACD Color Lite displays a custom four-color MACD histogram that makes momentum shifts easy to read at a glance. DIF and DEF lines are included; divergence detection is reserved for the paid Divergence Pro edition. HOW IT WORKS DIF = Fast EMA(12) minus Slow EMA(26) DEF = Smoothed signal line of DIF Energy = (DIF − DEF) × 2, split into four histogram colors: Above zero, lengthening → red (momentum building) Above zero, shortening → aqua (momentum fading) Below zero, lengthening → gree
FREE

KS Double Line Scalp
これは、主に下位時間足でのスキャルピングを目的として設計された、2つの移動平均線を統合したインジケーターです。以下の2つの平滑化手法を組み合わせています。
KS TEMA(三重指数移動平均)
KSMA
その目的は、両方のラインを同時に表示することで、トレンドの方向性とモメンタムを、ノイズが少なく遅延(ラグ)の少ないクリアな視点で提供することにあります。これにより、トレーダーは2つのラインが交差・反応する場面において、勝率の高いスキャルピングのエントリー機会を見極めることが可能になります。
主要構成要素
要素 | タイプ | デフォルト値 | 目的
TEMA Length | Triple EMA | 9 | 遅延を抑えつつ、高速かつ反応性の高いトレンドラインを表示
KSMA Length | ALMAベース | 9 | 滑らかでシャープなトレンドラインを表示
Offset | ALMAパラメータ | 0.85 | 滑らかさ(1に近いほど滑らか)と反応性(0に近いほど反応が速い)のバランスを調整
Sigma | ALMAパラメータ |
FREE

UZFX FTMO Guardian PROは、トレーダーがFTMOチャレンジを安全に完遂し、資金提供を受けた口座を自信を持って管理できるよう設計された、MetaTrader 5用のプロフェッショナルな口座監視インジケーターです。
エキスパートアドバイザーとは異なり、このツールは取引の執行、変更、決済を行いません。手動で取引を行っている間、口座を継続的に監視し、FTMOの重要なルールをすべて計算するリアルタイムの取引アシスタントとして機能します。
ダッシュボードには、残高、エクイティ、未確定損益、確定利益、日次利益、総利益、現在のドローダウン、残りの許容ドローダウン、利益目標の進捗状況、取引日数、およびチャレンジ全体の健全性ステータスなど、すべての重要な口座統計情報が一箇所に表示されます。
このインジケーターは、以下のFTMOチャレンジを自動的にサポートしています:
FTMO 2-Step Standard FTMO 2-Step Swing FTMO 1-Step Challenge また、以下の項目を継続的に計算します:
日次ドローダウン 最大ドローダウン スタティック・
FREE

Shadow System Candles - トレンド可視化システム
コンセプト 「暗闇での乱射はやめろ。相場にナイトビジョンを装備せよ」
Shadow System Candlesは、FXトレードプロジェクト「Shadow Operation」の視覚コアシステムです。 AIロジック(ADXと移動平均の統合判断)に基づき、ノイズを排除し、相場の「真のトレンド方向」をローソク足の色で可視化します。
※本ツールは矢印シグナルは出ません。トレンドの「発生」と「消滅」を視覚的に認識するための訓練用、および裁量トレードのフィルターとして機能します。
機能: ・AIロジックによる色分け トレンドの強弱を5段階で表示します。 ・濃い青 (Deep Blue) 強力な上昇トレンド(加速フェーズ) ・薄い青 (Light Blue) 上昇トレンド ・グレー (Gray) レンジ / 膠着状態(待機推奨) ・薄い赤 (Light Red) 下降トレンド ・濃い赤 (Deep Red) 強力な下降トレンド(加速フェーズ) 規律の強制 グレーの期間は「手出し無用」。無駄な往復ビンタを防ぎます。完全
FREE

You may find this indicator helpfull if you are following a session based strategy. The bars are colored according to the sessions. Everything is customisable.
Settings: + Asia Session: zime, color, high, low + London Session: zime, color, high, low + US Session: zime, color, high, low
Please feel free to comment if you wish a feature and/or give a review. Thanks.
FREE

"Driver Road Bands" indicator that is designed to be used in the 1H, 4H and 1D timeframes in the most ideal way. If we compare timeframes to roads and streets; main streets and highways with high traffic volume are similar to high-time timeframes in technical analysis. If you can interpret the curvilinear and linear lines drawn by this indicator on the graphic screen with your geometric perspective and develop your own buy and sell strategies; you may have the key to being a successful trader.
FREE

The Pivot Indicator is a vital tool for technical analysis used by traders in the financial markets. Designed to assist in identifying potential reversal points or trend changes, this indicator provides valuable insights into key levels in the market. Key features of the Pivot Indicator include: Automatic Calculations: The Pivot Indicator automatically calculates Pivot Point, Support, and Resistance levels based on the previous period's high, low, and close prices. This eliminates the complexity
FREE

This is my ea Gold Structure Hunter EA
https://www.mql5.com/en/market/product/174076?utm SMART MARKET DASHBOARD Everything You Need. One Clear View. Make your market analysis faster, cleaner, and more organized with a dashboard that brings important price, VWAP, opening-price, and trend information together in one place. Instead of checking multiple indicators separately, the dashboard gives you a quick market overview so you can understand where price is trading and what the current t
FREE

The indicator makes calculations based on data obtained from one of seven (7) moving averages and colors the chart.
Simple moving averages are those that have only one important calculation parameter - the period.
The shift in the indicator is not used.
There is a shift trick setting, it is used to smooth the result of calculations. You can see the changes if you reduce this parameter to 1 (minimum value).
shift trick must always be less than the period value.
Available averages:
MA Simpl
FREE
Tick imbalance bars (TIB), described in the book Advances in Financial Machine Learning (2018) by Marcos López de Prado. Indicator that show candlestick bars with an different sampling method than time fixed. Real time data is sourced to the indicator and it may be used as substitute of the default graph. Each bar is formed when a predefined tick balance is exceeded, showing in the graph the OHLC of this cluster of ticks. The input variable is the amount of ticks of each bar. The indicator may
FREE
The EMA Navigator Pro is an advanced version of the popular EMA indicator, designed to provide superior flexibility and multi-timeframe analysis capabilities. This indicator not only displays EMA lines but also offers a powerful alert system to ensure you never miss a crucial signal. Key Features: Multi-Timeframe Support: You can assign a separate timeframe to each individual EMA line, allowing you to analyze long-term (e.g., D1) and short-term (e.g., H1) trends on the same chart. Automatic Cro
FREE

Reversal Oscillator — Advanced Momentum Shift Detector
Reversal Oscillator is a free indicator designed to highlight price zones that are statistically outside their normal movement patterns, helping traders anticipate potential turning points before they occur. Unlike traditional oscillators that react mainly to overbought/oversold conditions, this indicator applies third derivative analysis (the "acceleration of the acceleration" of price) calculated using two independent methods within a n
FREE

ARC VELOCITY PULSE Parabolic SAR Direction + ROC Recovery for XAUUSD
Arc Velocity Pulse is a professional Gold trading indicator designed to identify trend-aligned recovery opportunities supported by directional movement, momentum acceleration, and volatility-based trade levels.
The indicator combines Parabolic SAR direction analysis with Rate of Change recovery confirmation, an internal Gann and Fibonacci price-alignment engine, confi
FREE

ADR, AWR & AMR Indicator: Comprehensive Trading Guide Try "Average Daily Range Scalper":
https://www.mql5.com/en/market/product/154469 Core Concepts ADR (Average Daily Range) Definition : The average distance between daily high and low prices over a specified lookback period (typically 14-20 days) Purpose : Measures daily volatility expectations, identifies range-bound versus trending days, sets realistic intraday profit targets Key Insight : Markets tend to respect their average volatility - d
FREE

RSI Condition:
The Relative Strength Index (RSI) for the current period is below a specified low threshold (RsiLow). This indicates oversold conditions. Candlestick Pattern:
It checks for a specific candlestick pattern across three consecutive candles: The current candle (1) closes higher than it opens (bullish) The previous candle (2) closes lower than it opens (bearish) The current candle's close is below the high of the previous candle Price Action:
The alert also checks that the current
FREE

MetaTrader 5 (MT5) 用の Wormhole 時間枠インジケーターは、ただの取引ツールではありません。それは、金融市場での競争優位性です。初心者とプロのトレーダーの両方を念頭に設計された Wormhole は、データの分析方法と意思決定を変革し、常に一歩先を行くことを保証します。 なぜ Wormhole インジケーター(無料)が必要なのか 競争に勝つ: 同じチャート上で 2 つの時間枠を同時に表示できるということは、常に一歩先を行けることを意味します。チャートを切り替える必要はなく、必要な情報はすべて目の前にあります。 隠れたチャンスを発見する: 従来の時間枠を変更し、他のトレーダーが見逃すパターンを発見します。5 分間のチャートの範囲を 00:01 から 00:06 に変更して、標準の 00:00 から 00:05 の代わりに分析することができます。これらの微細な変更は、市場の独特なダイナミクスを明らかにする可能性があります。 実行可能な洞察を得る: トレンド、反転、サポート/レジスタンスレベルを検出するための精密なツールを使用することで、Wormhole は自信を持
FREE

Помощник для торговой системы SystZ . Чертит трендовые линии по соседним экстремумам зигзага. Условие для линии сопротивления - правый должен быть ниже левого. Для линии поддержки - правый выше левого. Не допускается, чтобы между экстремумами, по которым проводится трендовая линии были другие. Экстремумы, удовлетворяющие этим условиям, отмечены символом фрактала. Закрытие свечи за линией - сигнал для открытия позиции.
FREE

WHY ECONOMIC CALENDAR PRO?
Trading without knowing when high-impact news is scheduled is like driving blindfolded. Sudden price spikes, spread widening, and stop-loss hunts are almost always tied to economic releases. Economic Calendar Pro puts the entire week's news schedule right on your chart — always visible, always up to date — so you are never caught off guard again.
Unlike web-based calendars that require switching windows or relying on a browser, this indicator is embedded directly in
FREE

Spread Info and Candle Timer Panel FREE - Essential Info Tool
Small, lightweight and fast information panel for scalpers and intraday traders. Displays real-time Spread in points and pips, current Ask/Bid prices and countdown timer to candle close.
Never miss a candle close again and always see your real spread.
FREE, No DLL, Lightweight & Fast - will not slow down your terminal.
FEATURES: Real-time Spread in points and pips Real-time Ask and Bid prices Candle Timer with countdown mm:
FREE
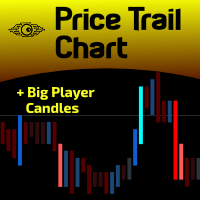
For those who hate candlesticks in lower timeframes (M1 through M15) we "invented" a clean new way to follow Price movement and displacement (volatility) called Price Trail Chart . The big "secret" is to get rid of those annoying candle wicks and draw the whole complete candle without them, this way we get a cleaner chart and a new view of the Price Path. No Open or Close markings, just LOW's and HIGH's, full body candle.
Additionaly we inserted a Volume monitor from our Best Downloaded indicato
FREE

If you like this product, please give it a 5 star rating as a token of appreciation.
This indicator plots horizontal trend lines at the opening price of each quarter (Q1–Q4) on the chart. These lines visually represent quarterly open levels of the current year, which traders often use as support/resistance or reference points. Automatically plots Q1–Q4 opening levels as trend lines on the chart. Lines are dashed, colored, and labeled. Handles both current and historical quarters. Cleans up line
FREE

VWAP Pro by Angel’s is an advanced Volume Weighted Average Price (VWAP) indicator designed for traders seeking precision and clarity in their trading decisions. With this indicator, you can instantly identify market direction and key support and resistance zones based on volume. Key Features: Simple or Double Mode: Choose between a classic VWAP or a double VWAP for greater sensitivity and trend filtering. Configurable Periods: Adjust the calculation periods according to your trading strategy and
FREE

The CSI Currency Strength indicator ranks all ten G10 currencies by momentum strength using a multi-lookback Z-score model, displayed as a live on-chart panel. Attached to any chart, it runs independently of the chart's symbol or timeframe. The methodology follows the multi-horizon momentum framework from Asness, Moskowitz & Pedersen (2013), applied cross-sectionally to G10 currencies. Rather than comparing a single bar against the previous close — which introduces a cliff-edge artifact at each
FREE

>> Announcements Channel << DiverX is a powerful and versatile divergence indicator developed for the MetaTrader 5 platform. It detects both Regular and Hidden Divergences based on five popular technical indicators: RSI (Relative Strength Index) , RVI (Relative Vigor Index) , Stochastic Oscillator, CCI (Commodity Channel Index) , and MACD (Moving Average Convergence Divergence) and ATR Plus (author’s proprietary indicator, product page >> ) . The indicator plots results directly on the main c
FREE
ToolBot Probabilistic Analysis - FREE An effective indicator for your negotiations
The toolbot indicator brings the calculation of candles and a probabilistic analysis so that you have more security on your own.
Also test our FREE tops and bottoms indicator: : https://www.mql5.com/pt/market/product/52385#description Also test our FREE (RSI, ATR, ADX, OBV) indicator: https://www.mql5.com/pt/market/product/53448#description
Try our EA ToolBot for free: https://www.mql5.com/market/prod
FREE

Stochastic + RSI Multi-Timeframe Dashboard with Momentum Strength Need Trade Assistant? Trade Panel Pro MT 5
Please leave a review, if you like this.
OVERVIEW A professional multi-timeframe dashboard indicator that displays Stochastic Oscillator and RSI (Relative Strength Index) values from 7 different timeframes simultaneously on a single compact panel. Perfect for scalpers and day traders who need quick m
FREE

DaySpread MinMax — spread indicator with daily Min/Max What it shows: Current spread (Cur) Minimum spread for the current day (Min.day) Maximum spread for the current day (Max.day) How it works: Every 1 second the indicator reads Bid/Ask for the current symbol. Current spread is calculated as (Ask − Bid) / Point (in points). Min.day/Max.day are tracked during the day and reset when a new trading day starts (D1). The values are displayed on the chart as a compact text panel. You can drag the pan
FREE

GomerAI KAGI – 市場構造とトレンド確認 価格 : $0 プラットフォーム : MetaTrader 5 タイプ : 市場環境インジケーター(非自動売買) 概要 このインジケーターは、 GomerAI Market Research Framework の一部であり、市場構造と取引環境を分析するために設計された分析ツール群に属しています。 各インジケーターは市場行動の特定の側面に焦点を当て、トレーダーや自動売買システムが現在の市場状況をより深く理解できるよう支援します。 GomerAI KAGI は、時間ベースのチャート構成ではなく、価格反転に基づくロジックを使って方向性のある価格構造を評価します。このインジケーターは売買シグナルを生成したり取引を実行したりするものではなく、価格変動が意味のある方向性構造を形成しているのか、それとも短期的なノイズや不安定な移行に依然として支配されているのかを分析します。 その目的は、現在の価格行動が強気構造、弱気構造、あるいはより中立的な移行状態を維持しているかどうかを判断することにあります。反転行動によって表れる構造変化に注目することで、
FREE

The Fibonacci indicator automatically displays the Fibonacci retracement levels, representing significant support and resistance. The range for calculating the indicator can be taken from the previous day, week, month, year or user-specified session.
Levels 100 % (High) of the range from the previous session. 0 % (Low) of the range from the previous session. 76,4 % of the range from the previous session. 61,8 % of the range from the previous session. 50 % of the range from the previou
FREE

True Days is a tool designed specifically for the trader who wants to catch intraday volatility in price charts. True day makes it easier for the trader to avoid trading in the dead zone - a period in time where markets are considered dead or non volatile. The trader can concentrate on finding opportunities only during periods of profound market movements. By default the indicator gives you a true day starting at 02:00 to 19:00 hours GMT+2. You can adjust according to your Time Zone. By deafult
FREE

RBM ATR PRO v1.10 Quem opera mercado volátil sabe como é ruim tomar stop por causa de uma violinada de pavio e ver o preço andar forte a favor logo depois. O RBM ATR PRO foi desenvolvido exatamente para resolver isso. Ele evolui o indicador clássico de volatilidade combinando a leitura do ATR com dois níveis independentes de suavização. A linha no gráfico fica limpa e objetiva: verde para estrutura de alta e vermelha quando o mercado vira para a baixa. Funciona perfeitamente para rastrear a ten
FREE

The CV Ribbon Indicator dynamically visualizes market trends using modern ribbon-based technology. By combining multiple moving averages, the indicator helps traders identify trend direction, momentum and market phases with clarity and speed. Features: Dynamic ribbon visualization Trend & momentum detection Modern and clean design Suitable for Forex, Gold, Indices, Crypto and Stocks Supports multiple trading styles Disclaimer: This product is intended for analytical purposes only and does not co
FREE

Indicador TriYep v1.02 – Más del 70% de señales precisas Indicador TriYep v1.02 – Más del 70% de señales precisas Presentación El indicador TriYep v1.02 se creó con un único propósito: ofrecer señales totalmente fiables. Esta versión gratuita está calibrada y optimizada específicamente para el par USD/JPY en el marco temporal M15 , donde su lógica alcanza su máximo rendimiento. Mientras que otros indicadores inundan tu gráfico con señales falsas y te hacen perder operación tras operación, hemos
FREE

New candlestick alert, the alert appears according to the timeframe it is placed on. The indicator works on any asset, the alert can be silenced at any time, without the need to remove the indicator from the graph. It's great for those who can't keep an eye on the chart all the time. You can use this tool at work, college or anywhere else. It is also possible to receive signals directly on your cell phone by connecting to the metatrader. Aurélio Machado.
FREE

Market Sessions Clockは、今どの市場が開いていて、次の市場がいつ開場・閉場するかを一目で確認できる小さなパネルです。
仕組み - 4つのセッション:シドニー、東京、ロンドン、ニューヨーク。それぞれオン/オフと時間を設定できます。 - 時間は各市場の現地時間で入力し(例:ロンドン 08:00-17:00)、シドニー、ロンドン、ニューヨークの夏時間は自動で反映されます。 - 各セッションについて、開場中か閉場中か、閉場または次の開場までの残り時間、その市場の現在の現地時刻を表示します。 - オプションの行で取引サーバー時間とUTCを表示します。ブローカーの時計が自分の時計と異なる場合に役立ちます。 - パネルはパソコンのUTC時計で毎秒更新されるため、新しいティックがなくてもカウントが続きます。 - 深夜0時をまたぐセッションにも対応します。初期設定では土曜日と日曜日はセッションを数えません(FXとCFD向け)。毎日取引される市場ではオフにしてください。
パラメーター - セッション:各市場のオン/オフと開始/終了時刻(HHMM)、週末のスイッチ。 - 表示:現地時
FREE

Account Info Panel は、よく確認する数値をチャート上の小さなパネル 1 つにまとめます。「取引」タブに切り替える必要はありません。
表示内容 - 残高と有効証拠金。 - 保有ポジションの含み損益。 - 本日の決済分:サーバー日の開始以降に決済された取引の損益、スワップ、手数料、その他費用。入金と出金は含みません。 - 使用中の証拠金と余剰証拠金。 - 証拠金維持率。200% を下回るとハイライトされます。 - 本日のドローダウン:有効証拠金がその日の開始時の水準からどれだけ下がっているか(現在値と最大値)。最大値は 3% からハイライトされます。 - 保有ポジション数と合計ロット数。チャート銘柄だけの行もオプションで表示できます。 - 取引サーバーの時刻。 - デモ口座には "demo" タグ。スクリーンショットを安全に共有できるよう、口座番号はデフォルトで非表示です。入力パラメータ 1 つで表示できます。
仕組み パネルはターミナルの口座データから毎秒更新されます。本日のドローダウンは、サーバー日の最初の更新時の有効証拠金を起点にします。日中にインジケーターを適
FREE

Spread and Swap Info は、現在の銘柄の取引コストと時間に関する情報を小さなパネルに表示します。初心者でも銘柄仕様を開かずに確認できます。
表示内容 - ポイント単位のスプレッド。ブローカーが固定スプレッドを提示している場合は "(fixed)" を表示します。 - ロング / ショートのスワップを、銘柄のスワップ方式に合った単位で表示します:ポイント、通貨(基軸通貨、証拠金通貨、口座通貨)、年率パーセント、または "reopen"。スワップが無効、または両方がゼロの場合は "Swap: none" と表示します。 - トリプルスワップの曜日(3日分のスワップが付く曜日)。スワップがない場合は非表示になります。 - サーバー時間とローカル時間。ブローカーの時計と自分の時計の関係が分かります。 - セッション:設定したサーバー時間に基づき、アジア、ヨーロッパ、米国、または複数同時、あるいは "Closed / between sessions" を表示します。週末や、その銘柄に今日の取引セッションがない場合は "Market closed" と表示します。 - 現在の
FREE

Chart Navigator MT5 Base は、価格チャート上を素早く移動し、チャート上の自分のマークへすぐにジャンプするためのミニマップです。 このインジケーターは、価格チャート全体のコンパクトなミニマップをチャートに追加します。このマップにより、履歴内を素早く移動し、垂直線でマークした重要な場所へ戻ることができます。 このシンプルなナビゲーターの主な利点は、単なるチャートのスクロールではなく、手動で長くスクロールすることなく必要なエリアへ素早く移動できることです。重要なイベントのマークとしてチャートに垂直線を置くと、その線はミニマップにも表示されます。その後、履歴のかなり先または過去へ移動しても、ミニマップ上でそのマークを見つけ、ワンクリックで必要な場所へすぐに戻ることができます。重要な日付、シグナル、取引、ニュース、分析ゾーン、または素早く戻りたい任意のポイントをマークする場合に便利です。
仕組み ミニマップは、選択された履歴範囲をコンパクトな価格ラインとして表示します。メインチャートの現在表示されている範囲は枠で強調表示されます。ミニマップをクリックするとチャートが選択
FREE

General Description Candle Countdown is a visual indicator for MetaTrader 5 that displays the time remaining until the current candle closes in real-time. The indicator presents information panels attached to Bid and Ask lines, showing countdown timers, current candle type, and other useful information. Key Features 1. Candle Time Display Countdown Timer : Time until candle close in MM:SS format Elapsed Time : Time since candle opening Percentage Completion : Real-time percentage of candle c
FREE

Stochastic Signal Pro MTF – L'Indicateur Ultime pour des Signaux Précis et Multi-Timeframes ! Pourquoi Choisir Stochastic Signal Pro MTF ? Stochastic Signal Pro MTF est un indicateur professionnel et innovant conçu pour les traders qui recherchent des signaux fiables basés sur l'indicateur Stochastique, validés sur plusieurs timeframes . Que vous soyez un scalper, day trader ou swing trader , cet outil vous offre une analyse complète et visuelle pour prendre des décisions éclairées.
FREE

# MiniBull Board
**Version 1.14 — MetaTrader 5 indicator (separate window)**
**11 languages: English, Turkish, Russian, Chinese, Spanish, Portuguese, Japanese, German, French, Italian, Korean** — automatically in the language of your MetaTrader terminal, or chosen with a single input.
MiniBull Board is a compact watch-list dashboard for MetaTrader 5. For every symbol you choose it shows where the price stands today, this week and this month: the current price, the day / week / month opening
FREE

Normal Parabolic SAR with label of long or short state. Tells also "Parabolic long" and "short". Can be used in multitimeframe layouts together with Swiss HolyGrail indicator or in different timeframes. So, if all the indicators show "long" or "short" you can be sure that the risk of a wrong direction is small. The standard values for Parabolic SAR are 0.02 for step and 0.2 for maximum. You may experiment with changing the maximum to get smother curves. Note that changes in parabolic SAR are la
FREE

This indicator, the Phoenix Pulse Scalper v1.0, is a high-velocity momentum engine specifically engineered for the 2026 Gold (XAUUSD) and Major Forex markets. It is designed to filter out market noise and identify "Pulse" points—moments where trend, momentum, and volatility align for a high-probability scalp. The "Phoenix Pulse" Core Strategy The indicator identifies entries using a 3-layer institutional filter: Directional Bias (21 EMA): Only allows Buy signals when price is above the 21 Expon
FREE

Multitimeframe Ma Atr is a MetaTrader 5 indicator that displays ATR and a moving average of ATR in a separate indicator window.
The indicator can calculate ATR from the current chart timeframe or from a selected higher or lower timeframe. This allows traders to monitor ATR context from one chart. For example, a trader can view an M5 chart while displaying H1 ATR and H1 ATR moving average.
Main features: - Multitimeframe ATR source - Adjustable ATR timeframe - Adjustable ATR period - Adjustabl
FREE

Zakir Market Structure (Free)
Professional trader utilities. Minimal design. Maximum clarity.
Short Description: Lightweight MT5 market structure indicator that automatically displays daily, weekly, and monthly separators with intelligent timeframe filtering, automatic cleanup, and optimized performance.
Details Zakir Market Structure is a lightweight MetaTrader 5 utility indicator designed to improve chart readability by automatically displaying daily, weekly, and monthly market structure se
FREE

This is a multi frame stochastic indicator, you can attach any time frame of stoch indicator on one chart. It is very useful if you like to check multi time frame stoch data. If you are interested in EA,click below links to take a look: https://www.mql5.com/en/market/product/80170 https://www.mql5.com/en/market/product/81136
How to use: > Atach the first time frame you want on to the currency pair's chart > Atach the second time frame you want on to the currency pair's chart > Atach the third
FREE
MetaTraderマーケットはトレーダーのための自動売買ロボットやテクニカル指標を備えており、 ターミナルから直接利用することができます。
MQL5.community支払いシステムはMetaTraderサービス上のトランザクションのためにMQL5.comサイトに登録したすべてのユーザーに利用可能です。WebMoney、PayPal または銀行カードを使っての入金や出金が可能です。

取引の機会を逃しています。
- 無料取引アプリ
- 8千を超えるシグナルをコピー
- 金融ニュースで金融マーケットを探索