 MetaTrader 5
 Эксперты
 Индикаторы
 Библиотеки
 Утилиты
 Виджеты
 Правила
Смотри обучающее видео по маркету на YouTube
Как купить торгового робота или индикатор
Запусти робота на
виртуальном хостинге
виртуальном хостинге
Протестируй индикатор/робота перед покупкой
Хочешь зарабатывать в Маркете?
Как подать продукт, чтобы его покупали
Бесплатные технические индикаторы для MetaTrader 5 - 64
 На основании сигналов технических индикаторов принимаются решения относительно открытия или закрытия сделки на фондовом и форекс-рынках. Суть индикаторов заключается в математическом преобразовании цены и/или объемов финансового инструмента для прогнозирования изменений цен в будущем.
Протестируйте технические индикаторы, чтобы лучше предсказывать поведение рынка и зарабатывать на этом.

BodyCandleBreakout – Smart Body Breakout Signal Indicator for MT5 BodyCandleBreakout is a clean, price-action-based indicator that instantly identifies when the current candle's close price breaks beyond the body (high or low) of the previous candle . No repainting. No lag. Just pure, objective breakout signals directly on your chart. Overview Breakouts are among the most reliable price-action signals in trading. But not all breakouts are created equal. BodyCandleBreakout focuses
FREE

Индикатор IRush использует модифицированную версию популярного индикатора RSI (Relative Strength Index, "Индекс относительной силы") для определения входов в рынок на дневном графике или меньше. Индикатор настроен и проверен для работы на основных символах: AUDUSD, EURUSD, GBPUSD, USDCAD, USDCHF и USDJPY. Автоматическая торговля по этому индикатору реализована в советнике Intraday Rush . Советник умеет открывать, вести и закрывать свои сделки. Обязательно посмотрите, возможно, это то, что вы иск
FREE
NewTest https://backoffice.aurum.foundation/u/DHXP1U
Добрый день. Сегодня мы предлагаем индикатор MaxlotTomson для определения максимального объема, который вы можете выставить на покупку или продажу, если смотреть на ваш уровень депозита. Данный индикатор удобно использовать для Новостной торговли, когда нужно определить точку входа на скоростном движении и рассчитать уровень риска в процентах от депозита, Индикатор MaxlotTomson показывает максимальное значение объема ЛОТА для вашего де
FREE

Account and Trading Dashboard Indicator
The **Account and Trading Dashboard** is a custom MetaTrader 5 (MT5) indicator designed to provide traders with a comprehensive, real-time overview of their account metrics, trading statistics, and technical indicators directly on the chart. It displays essential financial and performance data in a draggable, minimizable, and closable panel, enhancing usability without cluttering the workspace. The indicator supports optional features like ADX and RSI for
FREE
Time to Trade Trading timing indicator is based on market volatility through 2 ATR indicators to determine the timing of a transaction. The indicator determines the times when the market has strong volatility in trend. When histogram is greater than 0 (blue) is a strong market, when histogram is less than 0 (yellow) is a weak market. Should only trade within histograms greater than 0. Based on the histogram chart, the first histogram value is greater than 0 and the second histogram appears, this
FREE
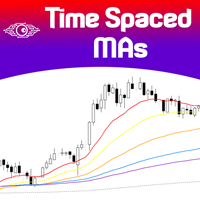
The concept is simple: Plotting Price behavior within several periods of time. Some Symbols behave very well during the trading day - with this I mean Intraday trading - and this behavior ends up plotting effectively well with the proposed Exponential Moving Averages in this indicator... Obviously that this behavior could not be seen in all Symbols, but you can give it a try... Just drop this indicator in a chart and you will see for yourself...
This indicator is intended for "Feeling the Trend"
FREE

Ищет сильные движения цены и по их завершении рисует уровни. Силу движения вы определяете самостоятельно, указав в настройках количество пунктов и количество свечей одинакового цвета подряд в одном направлении. В настройках есть 2 типа построения: extrenum - high/low close - цена закрытия Так же можно регулировать количество отображаемых уровней и число свечей для расчетов. По умолчанию в настройках указано 5 уровней для 360 свечей. То есть будет вычислено 5 уровней для сильных движений вверх
FREE

Индикатор отображает количество и соотношение тиков роста и падения цены для каждой свечи графика. Верхняя часть гистограммы в виде тонких линий показывает количество тиков роста цены (сила быков), а нижняя - количество тиков падения цены (сила медведей). Более жирные столбцы гистограммы - это разность между силами быков и медведей. Положительная разность отображается зеленым цветом, а отрицательная - красным. Прирост силы быков происходит в тот момент, когда цена Ask текущего тика стала больше,
FREE
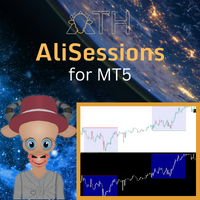
AliSession Highlight is an indicator that highlights a specific period of time according to your preferences. It can help you gain a clear vision of price movements into a specific session, the range of a session, and also to easily identify the high and low of the session. You can use it on any currency pairs, indices, and any timeframes. Settings: Start Hour: Set the hour to initiate the session highlight. Start Min: Set the minute for the start of the session highlight. End Hour: Specify the
FREE

Indicator Description: Market Session Overlay The Market Session Overlay indicator for MT5 visually highlights the key global trading sessions — Asian, European, and American — directly on your chart.
It allows traders to clearly identify the time ranges of each session and their respective highs, lows, and opening levels, improving session-based analysis and strategy execution. Features: Draws colored rectangles for each session (Asian, European, American) on the chart.
Configurable se
FREE

Представляем индикатор “Информация о Стоимости Символа” – ваш незаменимый инструмент для поддержания лидерства на рынке форекс! Этот инновационный индикатор создан для того, чтобы обеспечить трейдеров информацией о реальной стоимости в режиме реального времени, непосредственно на их графиках. Вот почему каждому трейдеру необходим индикатор “Информация о Стоимости Символа” в его арсенале: Мониторинг Спреда в Реальном Времени: Внимательно следите за спредом любой валютной пары, чтобы входить на р
FREE

Projection of Phi технический индикатор, рассчитывающий динамические уровни поддержки и сопротивления. Использует угловые геометрические проекции и математические соотношения для идентификации диапазонов расширения рынка. Особенности: Динамическое расширение Фибоначчи: Проекция уровней расширения Геометрические расчеты: Угловой анализ и математические соотношения Визуализация: Графические объекты с информативными метками Совместимость: Таймфреймы от M1 до H4 Применение: Идентификация зон для
FREE
Indicator alerts for Dual Relative strength index rsi. Large rsi preset at 14 is below 30 small rsi preset at 4 is below 10 for buy bullish signals .
Large rsi preset are 14 is above 70 small rsi preset at 4 is above 90 for sell bearish signals . Includes mobile and terminal alerts. draws lines when alerts.
This indicator can help identify extremes and then the tops or bottoms of those extremes .
FREE
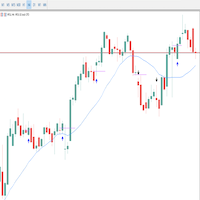
Multset This is inte_plays indicator, which helps the trader to enter the trades appropriately it plots an arrow when there is appropriate environment which permits trading
Features 1. Sends push notification on mobile devices 2. Plots arrow on chart when the setting is found
TimeFrame Is suggested to be used on higher time frames only, especially starting 15min and above for proper moves
For more informations please Visit: https://t.me/Tz_Fx_Lab Subscribe to our Youtube channel: https:
FREE
Range Pullback Limits – Smart Buy/Sell Zone Indicator for MT5 Range Pullback Limits is a professional MT5 indicator that automatically marks potential Buy Limit and Sell Limit levels during ranging markets. It helps traders identify high-probability pullback zones and avoid trading when the market is trending strongly. *Note: Combine this indicator to filter entry points - https://www.mql5.com/en/market/product/149443 Key Features Works on Forex, Gold (XAUUSD), Crypto, Indices, Stocks Detects r
FREE

Volatility and Financial Volume Indicator This indicator was developed to assist in analyzing price volatility , identifying periods of band contraction and expansion , together with color changes associated with financial volume behavior. The system highlights regions where a significant increase in volume occurs, allowing traders to observe potential areas of interest for trend continuation or trend reversal studies. The analysis is primarily focused on the M15 and M5 timeframes , allowing use
FREE

MultiTimeframe Trend Pro shows you the market direction across 7 timeframes at a glance. Clear colors, no repainting, fully customizable. Perfect as a quick filter for any intraday or swing strategy.
Key Features Supports M1, M5, M15, H1, H4, D1 and W1
Colors MediumSeaGreen when the close is above the MA, and Red when below
No repainting → always based on the last closed candle for each timeframe
Fully customizable: MA period (200 by default) font, size and colors X/Y offsets, spacing
FREE

Chart Status Bar MT5 — информационный индикатор, работающий строго в режиме только для чтения. Он отображает основные данные о рынке, соединении и текущем символе непосредственно на графике.
Компактная панель показывает: • торговое расписание брокера и следующую смену сессии; • состояние соединения терминала; • возраст последнего тика; • текущий спред в пунктах и пипсах; • оставшееся время текущей свечи; • серверное время.
Панель DETAILS дополнительно показывает: • торговый режим символа; • м
FREE
Simple alternate MACD version like the one used in tradingview. Two lines (MACD & signal line) and a histogram. This MACD version can be used in many different ways. Potential trades are the crossing of the MACD & signal line, the crossing of the MACD through the 0-line of the histogram, the MACD being under the 0-line of the histogram or the movement of the histogram itself. A combination of these potential signals on different timeframes can be very precise, but always needs additional confirm
FREE
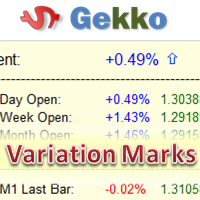
This is Gekko's indicator of quotations and variations. It summarizes quotations and variations of the current symbol in different timeframes as well as other correlated symbols. Keep track of all this information on your chart while you are negotiating for decision making support. Input Parameters General Settings: configure which quotations and variations you want to keep track for current day, week, month or year as well as M1, M5, M15, M30, H1 and H4 charts; Symbols Configuration: add up to
FREE

Оригинальный трендовый индикатор. Индикатор рисует в отдельном окне три линии, характеризующие текущую динамику цены. Может принимать значения от -1 до +1. Чем ближе значение индикатора к +1, тем сильнее восходящий тренд. Чем ближе к -1, тем сильнее нисходящий. Также может применяться в качестве осциллятора для определения перекупленности/перепроданности. Индикатор имеет один входной параметр Period, в котором указывается количество баров, используемых для расчета.
FREE

Индикатор использует значения разворота скользящей средней на всех выбранных таймфреймах для отрисовки уровней, где произошел разворот скользящей, которые можно рассматривать как уровни поддержки или сопротивления, так же как сигналы к изменению тренда на таймфрейме вновь нарисованной линии.
При этом берется скользящая средняя, пропущенная через индикатор RSI. Цвета линий настраиваются и по умолчанию означают следующее:
1. фиолетовый - скользящая средняя изменила направление вниз.
2. золотой - с
FREE

Normal Parabolic SAR with label of long or short state. Tells also "Parabolic long" and "short". Can be used in multitimeframe layouts together with Swiss HolyGrail indicator or in different timeframes. So, if all the indicators show "long" or "short" you can be sure that the risk of a wrong direction is small. The standard values for Parabolic SAR are 0.02 for step and 0.2 for maximum. You may experiment with changing the maximum to get smother curves. Note that changes in parabolic SAR are la
FREE

The Volunacci indicator is a custom technical analysis tool designed for MetaTrader 5. It combines volume analysis with Fibonacci retracement principles. In essence, it displays the current volume as a colored histogram within its own window. The unique feature is that it calculates a recent volume range (high and low over a user-defined period) and then projects key Fibonacci retracement levels (23.6%, 38.2%, 50%, 61.8%, 100%) onto this range. The color of the volume histogram changes dynam
FREE

Indicador Regressão Linear – Par de Ativos Indicador é um oscilador que faz o plot do Resíduo resultado da regressão linear entre os dois ativos inseridos como input do indicador, representado pela fórmula: Y = aX + b + R Onde Y é o valor do ativo dependente, X é o valor do ativo independente, a é a inclinação da reta entre os dois ativos, b é a intersecção da reta e R é o resíduo. O resíduo representa a quantidade da variabilidade que Y que o modelo ajustado não consegue explicar. E os resíduos
FREE

Trader’s Cockpit is a simple non directional dashboard for MetaTrader 5 designed to give traders a quick, clear view of their trading environment directly on the chart. Creator: https://www.quant-atlas.com/ The indicator does not generate buy or sell signals, does not predict market direction, and does not perform any trading action. Its purpose is to make the trader’s daily workflow easier by centralizing useful account, symbol, spread, session, and broker condition information in one compact
FREE

Sniper Spread Monitor v1.0 ¿Qué es el Spread y por qué es vital monitorearlo? En el trading, el Spread es la diferencia entre el precio de compra ( Ask ) y el precio de venta ( Bid ). Es, en esencia, el costo inmediato que pagas al bróker por abrir una operación. Para un trader de precisión, el spread no es solo un número; es un factor crítico por tres razones: Costo de Ejecución: Un spread alto significa que empiezas la operación con una pérdida mayor. En estrategias de scalping o entradas prec
FREE

Indicator Description This indicator monitors overbought and oversold levels , combining technical indicator signals with financial volume analysis in the regions marked on the chart. The system was primarily developed to support Swing Trading and Position Trading , using the H1 timeframe as its main reference. It is designed to help traders analyze areas where price may show changes in behavior, continuation, or loss of momentum. The marked regions should be used as areas for study and monitori
FREE

This indicator shows the strength of each currency compared to the US dollar by calculating the rate of change in price over a specified time period. When you open the indicator, you'll see a list of different currencies on the price chart. Each currency will have a numerical value indicating its strength level compared to the US dollar, where: If the value is higher than the US dollar, it will be displayed in green, meaning that currency is stronger than the dollar. If the value is lower than t
FREE

Price Edge – Видьте цену раньше, чем рынок двинется В трейдинге одна секунда может стать решающей разницей между прибыльной сделкой и упущенной возможностью .
С Price Edge на MetaTrader 5 (MT5) вы больше никогда не пропустите ни один тик. Price Edge — это не просто индикатор, это ваше преимущество в торговле.
Он обеспечивает обновления цены в реальном времени , чтобы ваши решения были всегда точными, быстрыми и уверенными. Почему выбирают Price Edge Live Price Indicator MT5 – мгновенно отоб
FREE

Kito Market Structure Counter is a clean MT5 indicator that automatically identifies confirmed swing structure and tracks consecutive Higher Highs (HH), Higher Lows (HL), Lower Highs (LH), and Lower Lows (LL) . It displays the current market bias — Bullish, Bearish, Bullish Lean, Bearish Lean, or Mixed — in a compact on-chart panel, together with the latest swing relationships and structure sequence counts. The indicator uses confirmed closed-bar swings , helping prevent published swing points f
FREE

Automate Your Strategy! Use the Daily Drop Analyzer Expert Advisor to automatically execute the strategy, with configurable filters, parameters, and order management.
Check it out here: Daily Drop Analyzer EA
The Step Analysis Indicator performs an automated backtest of a simple daily strategy: buy when the price drops a certain percentage from the previous close and sell at the same day's close (or vice versa for short strategy). It tests multiple entry percentages ("steps") and displays the
FREE

The Volume Heatmap indicator visually shows the INTENSITY of the volume taking into account the concept of standard deviation. Purpose of the Indicator: High volumes are common where there is a strong consensus that prices will increase. An increase in volume often occurs at the beginning of a new upward trend in the price of an asset. Some technical analysts do not rely on trend confirmations without a significant increase in volume. Low volumes usually occur when an asset is heading for a down
FREE

# MASignalPanel — Multi-MA Signal Panel with Trend Filter ## Overview MASignalPanel is an all-in-one moving-average signal indicator designed for MetaTrader 5. It combines up to three moving averages (SMA, EMA, SMMA, LWMA) with four trade signal modes — Cross, Breakout, Pullback and Channel — and adds a higher-timeframe trend filter line (default EMA240) to keep you on the right side of the market. A fully interactive control panel lets you change MA type, MA count, periods, s MA indicator, movi
FREE

Wilder Trend Indicator (MT5) The Wilder Trend Indicator is a clean and lightweight trend-following tool based on Wilder’s Moving Average smoothing method .
It visually highlights market direction by separating uptrend and downtrend movements directly on the price chart. The indicator is designed to be simple, flexible, and non-intrusive , making it ideal for discretionary traders who want clear trend confirmation without cluttering the chart. Key Features Uses Wilder-style smoothing for st
FREE
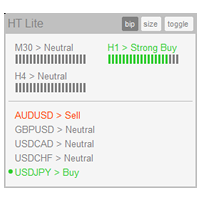
Индикатор High Trend Lite (высокий тренд, простая версия) мониторит 5 символов на 3 таймфреймах одновременно и определяет силу сигнала. Индикатор сообщает, когда происходит совпадение сигналов на разных таймфреймах. При этом индикатор может быть запущен на одном графике. Таким образом, High Trend Lite - это мильтивалютный и мультитаймфреймовый индикатор. С индикатором High Trend Pro , доступным по этой ссылке , у вас будет неограниченное количество символов, 4 таймфрейма, раскрашенный график осн
FREE

LogVar — это индикатор, который вычисляет и отображает логарифмическое изменение цены , более точный способ измерения процентных изменений между периодами. Он сравнивает текущую цену закрытия с ценой закрытия n периодов назад (параметр iPeriod ) и отображает результат на увеличенной логарифмической шкале, что упрощает визуализацию силы и направления движения. Цвет линии меняется автоматически в зависимости от знака изменения: Зелёный: цена выше логарифмического эталона (восходящий тренд). Красны
FREE

ViewTrend The ViewTrend indicator provides a visual interpretation of market conditions by coloring the candles and the moving average line based on defined technical criteria. ️ How does it work? The agorithm analyzes the relationship between the current closing price, the previous closing price, and the behavior of a simple moving average (SMA). Based on this analysis, the indicator colors the candles and the moving average line according to the technical scenario observed: Blue — Suggesti
FREE

Trading Session Activity Dashboard
TAGLINE
Trade the session, not just the candle.
PRODUCT OVERVIEW
SessionEdge Navigator MT5 is a session-analysis indicator for MetaTrader 5. It tracks the major trading sessions and provides a practical dashboard showing whether a session is active, how much range it has produced, how that range compares with its recent average, and whether current session behavior is bullish, bearish, or range-like.
Covered sessions: - Sydney - Tokyo / Asian - London - N
FREE

If you like this product, please give it a 5 star rating as a token of appreciation.
This indicator plots horizontal trend lines at the opening price of each quarter (Q1–Q4) on the chart. These lines visually represent quarterly open levels of the current year, which traders often use as support/resistance or reference points. Automatically plots Q1–Q4 opening levels as trend lines on the chart. Lines are dashed, colored, and labeled. Handles both current and historical quarters. Cleans up line
FREE

Этот продукт предназначен для отображения торговых сессий 15 стран на основе часового пояса вашего брокерского сервера и различных режимов отображения на основе желаемых вами настроек для предотвращения перегрузки графиков и возможности установки сессии в желаемое пользователем время.
На рынке Форекс никогда не заходит солнце, но его ритм танцует в такт отдельным торговым сессиям. Понимание этих сессий, их совпадений и их уникальной атмосферы имеет решающее значение для любого трейдера форекс,
FREE

Prop Guardian — Daily Loss & Drawdown Monitor (Free) Согласно собственным опубликованным данным OneFunded, 78,7% неудачных попыток прохождения челленджей в проп-фирмах заканчиваются нарушением лимита дневного убытка, а не общей просадки. Большинство трейдеров терпят неудачу не потому, что их стратегия не работает, а потому, что единственная цифра, которая действительно имела значение, не оказалась на экране в нужный момент. Prop Guardian отображает её перед глазами. ЧТО ОН ДЕЛАЕТ Отслеживание ли
FREE
MultiFrame MA: A Multi-Timeframe Trend Indicator MultiFrame MA is a trend analysis indicator designed to provide a comprehensive market overview across various timeframes. Instead of relying on a single timeframe, this tool synthesizes information from multiple charts, giving users a holistic and reliable perspective. KEY FEATURES: Multi-Timeframe Analysis: The indicator analyzes data from various timeframes, from M1 up to Monthly, to help users identify trend confluence at different levels. MA
FREE
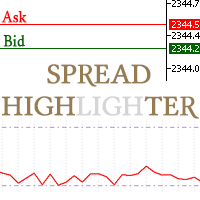
This spread indicator displays the actual spread of each candle. It highlights the maximum spread and the minimum spread of the chosen symbol. This indicator is very helpful to see in real time the spread evolution helping to avoid taking a trade when the spread is too high.
Inputs:
Print value in Points: if true displays the spread as a whole number
D isplay minimum and maximum spread of the past N days: select the number of days to consider the maximum and minimum spread
Automatically adj
FREE

Индикатор делает расчеты по данным, получаемым из из одной из семи(7) скользящих средних и окрашивает график. Простые скользящие средние - это те, у которых всего один важный параметр расчета - период. Сдвиг в индикаторе не используется. Есть настройка shift trick она используется для сглаживания результата расчетов. Можно увидеть изменения, если уменьшить этот параметр до 1(минимальное значение). shift trick должен быть всегда меньше значения периода.
Доступные средние: MA Simple
FREE
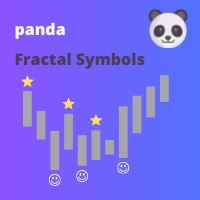
This indicator displays fractal symbols and bars Use this indicator to show different symbols for bearish and bullish fractals: Choose from 144 symbols (refer to table below) Colors, size and offset of fractals can be modified Fractal price bar or candle color can be changed Hide fractals and show fractal price bar only Frequency in fractal calculation can be changed
How to use 1. Select which symbols to use for bearish and bullish fractals; 2. Select which colors to use for bearish and bullis
FREE

Are you a scalper? This indicator reviews all 15 minute time frame and lets you set you range with an alert for when locked range is broken. This indicator, engineered for the Phoenix Trading 2026 suite, is a professional-grade Multi-Timeframe (MTF) Liquidity & Trend Dashboard. It is designed for high-precision scalping on Gold (XAUUSD) and Major Forex pairs, specifically targeting traders who operate on the 1-minute and 5-minute charts but need higher-level institutional context. Core Features
FREE
NewTest https://backoffice.aurum.foundation/u/DHXP1U
Индикатор 2indtompson - это индикатор сравнения двух инструментов для определения объемов, для уравновешивания в сделках парного трейдинга или при арбитражной торговли, приготовлен из аналога версии для терминала мт4. Таким образом если вам надо сравнить сколько будут весить два инструмента и вы не знаете каким образом это сделать, то поставьте на график индикатор и он автоматически рассчитает объемы необходимые для уравновешивания. Дополн
FREE

TrendView — Clear Trend Visualization for Confident Trading
TrendView is a free trend indicator designed to give traders a clean and reliable view of market direction. It displays clear trendlines in three colors, making it easy to identify bullish, bearish, and neutral phases without cluttering the chart with unnecessary elements. Whether you are monitoring long-term market structure or short-term price action, TrendView helps you keep your focus on the bigger picture. For traders who also w
FREE

DYNAMIC BALANCE MATRIX (SK Edition) — The Ultimate Multi-Timeframe Analytical Engine DYNAMIC BALANCE MATRIX is a professional-grade decision-making tool. This indicator acts as your "Control Tower," scanning up to 21 timeframes simultaneously and condensing market dynamics into a single, actionable numerical value — the Total Score . Interface & Control Buttons Timeframe Buttons (M1-MN1): Click to "Pin" a timeframe. Only active (selected) timeframes contribute to the Total Score . MENU / H
FREE

The X-21 TrendSync Elite is an advanced indicator designed for traders seeking precise trading decisions based on multiple technical indicators. Operating in a separate window, it integrates Stochastic, RSI, and CCI indicators (in two variants: Trigger CCI for entries and Trend CCI for trends) to provide clear visual signals for buying, selling, or waiting. With support for nine timeframes (M1, M5, M15, M30, H1, H4, D
FREE

Risk Manager — информационный индикатор для MetaTrader 5, который в реальном времени показывает бюджет дневного риска и помогает рассчитать рекомендуемый лот с учётом: риска на одну сделку (% от баланса); дневного риска (% от баланса); уже реализованных за день убытков и прибыли; риска открытых позиций (по их Stop Loss); расстояния до Stop Loss (пользовательского или стартового). Главная идея: убыток съедает дневной лимит, прибыль возвращает его обратно , а риск открытых сделок резер
FREE

The Average Directional Index (ADX) is a technical analysis indicator developed by J. Welles Wilder in 1978. Its primary function is to measure the strength of a trend, regardless of its direction, and to determine whether the price has entered a sideways trend. It is also mentioned by John Murphy in *The Visual Investor* (2005) as an indicator that helps determine whether a market is ranging or is about to start a new trend. As for Exponential Moving Averages (EMAs), some authors believe that
FREE

パラボリックのデータをもとにトレンドの方向性を1分足から月足まで表示します。 1分足から 月足 まで表示されているので今どの方向に価格が動いているのかがすぐに分かります。
更新はティク毎ではなくディフォルトでは1秒毎、もちろん変更も可能なのでチャートの表示が遅くなるようなことはありません。
機能:
どの通貨でも表示可能になります。
アイコンの色を指定することが可能になります。
表示位置(X軸、Y軸)が変更可能 になります。
表示位置 (左上 、 右上 、 左下 、 右下) が 指定 が可能 になります。
フォント を指定することが可能になります。
フォントサイズ が 変更可能 になります。
アイコンのサイズ が 変更可能 になります。
週足、 月足 の非表示 が 可能 になります。
FREE
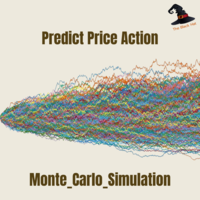
Monte Carlo simulation is an Indicator that uses a Monte Carlo model to calculate the probability of the price going up or down. If the price has a probability of going up or down more than 90%, the system will enter a trade by doing a back test of gold assets. It was found that it was able to generate a return of more than 20% in a period of 5 months while having a MAX DD of less than 7%.
What is a Monte Carlo simulation?
A Monte Carlo simulation is a model used to predict the probability of
FREE

Drawdown Guard is a free MetaTrader 5 dashboard that tracks your daily and weekly equity drawdown against your own limits — and warns you before you breach them. Works alongside any trading style, manual or automated, and any strategy: it doesn't care how you trade, only how much you've lost so far.
What it does: - Daily loss limit tracking — set a % of balance or a fixed $ amount; the dashboard shows your current day's P&L against it in real time. - Weekly loss limit tracking — same idea, tra
FREE

AI Multi Timeframe Oscillator Heatmap combines RSI and Stochastic readings across six timeframes at once - M15, M30, H1, H4, D1, and W1 - into a single, instantly-readable, color-coded panel. Instead of switching charts to check whether momentum agrees across timeframes, you see the full picture in one glance. KEY FEATURES
- Calculates live RSI and Stochastic values on six timeframes simultaneously (M15 through W1) for the current chart's symbol.
- Color-codes every row by combined momentum read
FREE
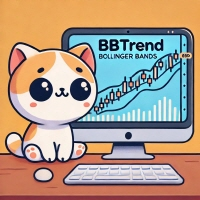
BBTrend is a powerful trend analysis tool designed to provide a clear overview of market volatility and trends at a glance.
This indicator calculates the difference between two Bollinger Bands of different periods,
visually indicating the strength of upward or downward trends to traders. Clear Trend Visualization: The upward trend is represented in green, and the downward trend in red,
allowing traders to intuitively grasp the direction and strength of the trend. Standardized Percentage Disp
FREE

EMA 200 Entry Strategy The 200 Exponential Moving Average (EMA) is a powerful indicator used to identify the overall market trend and high-probability trade entries. It acts as a dynamic support and resistance level, helping traders align with institutional market direction. When price is trading above the EMA 300 , the market is considered to be in a strong uptrend . In this condition, traders should focus only on buy opportunities . A valid entry occurs when price pulls back toward the EMA 200
FREE

ATR Short Box Anchor MT5 ATR Short Box Anchor MT5 is a visual risk-reward indicator for MetaTrader 5, specifically designed for planning short setups. The indicator creates an ATR-based short box directly on the chart, including entry, stop-loss zone, take-profit zone, and optional risk-reward information. The indicator works with a freely movable anchor point. This anchor defines the desired entry price and the candle whose ATR value is used for the calculation. This allows a short setup to be
FREE

Three Anchors On One Chart Most volume weighted average lines restart once a day. This one draws three at the same time: one anchored to the current trading session, one to the day, one to the week. Their spread tells you something a single line cannot. When the session line sits far under the weekly one, the week has been trading higher than today is; when all three sit together, the market has spent the week in one place. Why The Session Anchor Is Not Midnight The session line starts where the
FREE

Características Principales 1. Medía Móvil Multi-Timeframe (MTF) con Estabilidad Temporal EMA Macro ( InpMATimeframe ): Permite proyectar y visualizar en el gráfico actual una Media Móvil Exponencial (EMA) calculada desde una temporalidad superior (por defecto en gráfico diario PERIOD_D1 ). Independencia de Temporalidad: Mantiene los cálculos exactos y fijos del periodo que se requiera (la temporalidad macro seleccionada) sin que estos se modifiquen, distorsionen o recalibren indebidamente al
FREE

Institutional Price Discovery & Automated Structure Mapping
The Adaptive Auction Range Engine MT5 is a professional-grade structural mapping tool engineered for traders who specialize in Auction Market Theory , Liquidity Sweeps , and Market Structure Shift (MSS) . Unlike standard fixed-period box drawing indicators that clutter your screen with dead data, this engine tracks the physical footprint of institutional volume footprint in real time. It uses a Price-Adaptive Algorithm that d
FREE

The Moving Averages On-Off let you control the indicator using the keyboard or a button . You can choose if you want the indicator always shown or always hided while switching among different time frames or financial instruments . ---> This indicator is part of Combo Indicator OnOff
It's possible to setup three Moving Averages : Short , Medium , Long
Input You can customize the price type used for calculation : close, open, high, low, median price, typical price, weighted It's
FREE
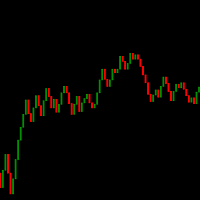
Candle de Volume Coiote O Candle de Volume Coiote é um indicador que mede a variação do volume no tempo, seu corpo é pela variação do volume anterior pelo volume atual, sua direção pelo fechamento do preço.
1. identificado um topo no indicador Candle de Volume Coiote (marcado o fechamento do preço).
2. identificado um fundo no indicador Candle de Volume Coiote (marcado o fechamento do preço).
3. fundo 3 igual fundo 2 no indicador Candle de Volume Coiote, preço no 3 é diferente de fundo 2.
P
FREE

"We have developed a highly accurate trading signal system applicable to all assets on the 15-minute (M15) timeframe. Calibrated against actual Gold price behavior, this system allows users to trade every candlestick effectively, regardless of market conditions—whether the market is trending, moving sideways, or reversing. The system features real-time arrows and color-coded indicators that signal immediate Buy or Sell entry points. This allows traders to use it as a reliable confirmation tool t
FREE
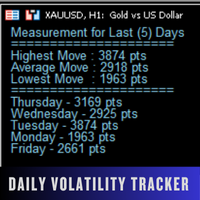
Daily Volatility Tracker is a practical and lightweight indicator designed to help traders monitor and analyze market volatility based on historical daily price movements. Whether you're a day trader, swing trader, or scalper, understanding how much a market moves per day is critical for: Choosing the right pairs to trade Setting accurate stop-loss and take-profit levels Adapting to changing market conditions MT4 Version - https://www.mql5.com/en/market/product/134958/ Join To Learn Market De
FREE

Это Бета версия моего трендового индикатора. Он построен на принципе схожем с нейросетями, и это расчет многомерного полинома. При установке его на график или при изменениях в параметрах индикатора, а также при переключении периода графика, происходит первоначальная инициализация индикатора. При инициализации не только пересчитывается весь период графика, но и происходит самообучение индикатора. Параметры индикатора: Sensitivity (100 max) - чувствительность к глобальным трендам, определяться ус
FREE

Trend Filter Line is a trend-following tool designed to help traders identify the market's core direction with surgical precision. Based on the popular Two-Pole Filter logic, this indicator eliminates market "noise" and provides a clear, color-coded visualization of the prevailing trend.
Whether you are a scalper, day trader, or swing trader, the Trend Filter Line Pro acts as your primary decision-making filter—ensuring you never trade against the momentum.
How It Works The indicator uses a s
FREE
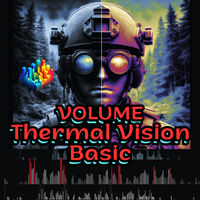
Volume Thermal Vision Basic — это упрощённая версия знаменитого индикатора Volume Thermal Vision, разработанная для трейдеров, стремящихся анализировать интенсивность объёма с практичностью и эффективностью. С 6 уровнями ярких цветов выберите один из режимов StealthMode, NightVision или FrostVision для чёткого и стратегического отображения объёмных данных. Идеально подходит для новичков или в дополнение к вашему анализу, этот индикатор лёгкий, интуитивно понятный и идеально подходит для оптимиза
FREE
MetaTrader Маркет предлагает каждому разработчику торговых программ простую и удобную площадку для их продажи.
Мы поможем вам с оформлением и подскажем, как подготовить описание продукта для Маркета. Все продаваемые через Маркет программы защищаются дополнительным шифрованием и могут запускаться только на компьютере покупателя. Незаконное копирование исключено.

Вы упускаете торговые возможности:
- Бесплатные приложения для трейдинга
- 8 000+ сигналов для копирования
- Экономические новости для анализа финансовых рынков
Регистрация
Вход
Вы принимаете политику сайта и условия использования
Если у вас нет учетной записи, зарегистрируйтесь