Greetings, trader! The Trading Chaos Panel trading utility is a trading panel designed to implement the unique principles of the Trading Chaos strategy, which combines elements of market trend analysis, risk management, and a psychological approach to trading. It consists of 5 blocks, each of which has its own functionality. The panel is also partially integrated into Telegram.
1st block. "Morning pages" - This block is one of the most important in this trading system. Its role is to help the trader determine whether it makes sense to use this trading signal.
This unit is semi-automatic.
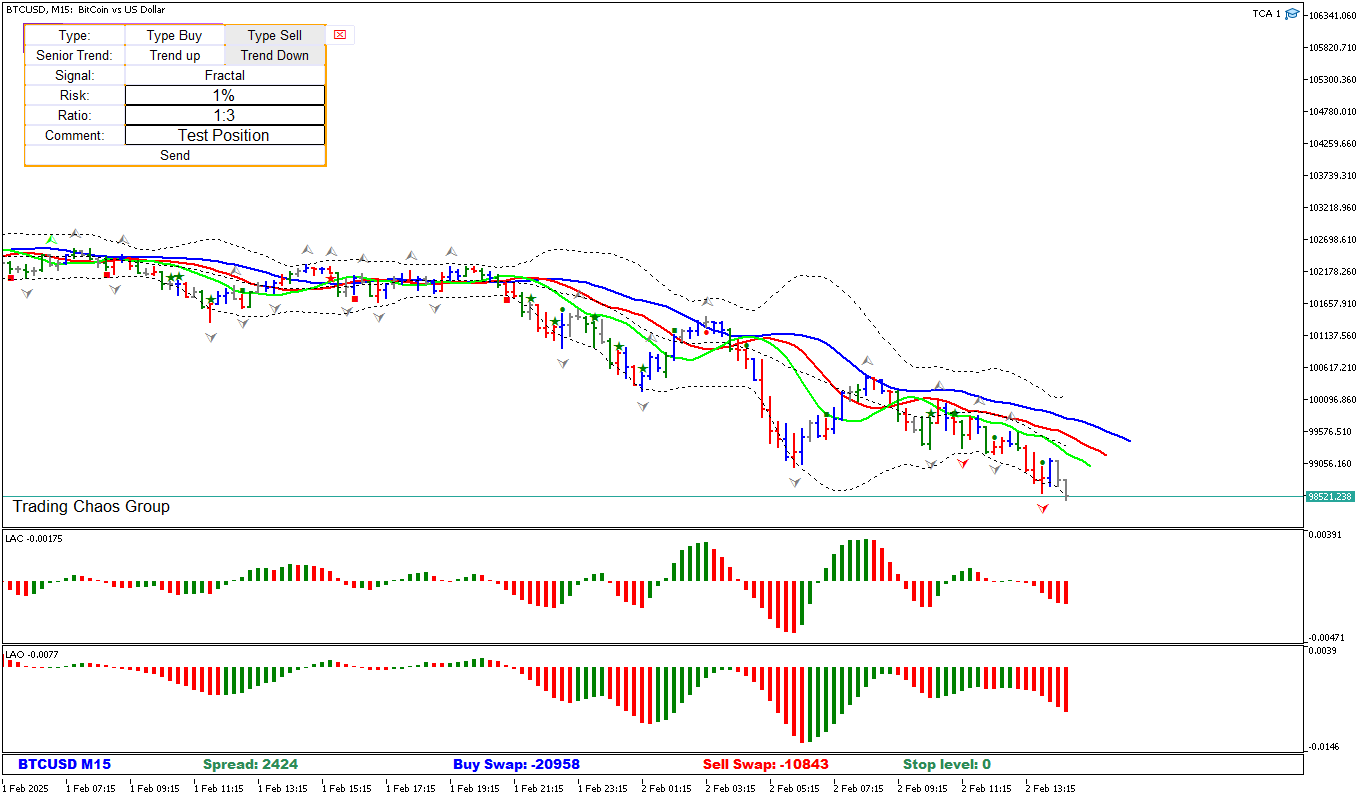
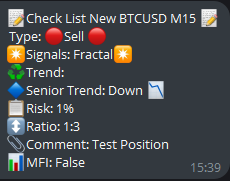
The type of position, the trading signal to be taken into account, the trend of the senior time interval, the risk per trade, the ratio of risk to profit - the user sets himself. In the comment to the deal, the user can indicate what emotions he felt when he searched for this deal. Later, you can collect statistics for your trading diary from this. After clicking on the "Send" button, the panel will send you all the necessary statistics in telegram. It will look something like this:
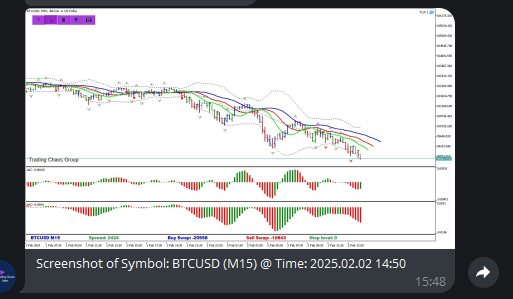
The 2nd block is the "Screenshot Block". After you have completed the wave marking or you want to share trading signals with someone, when you click on this button, the panel will take a screenshot of the chart and send it to you in telegram. It looks something like this:

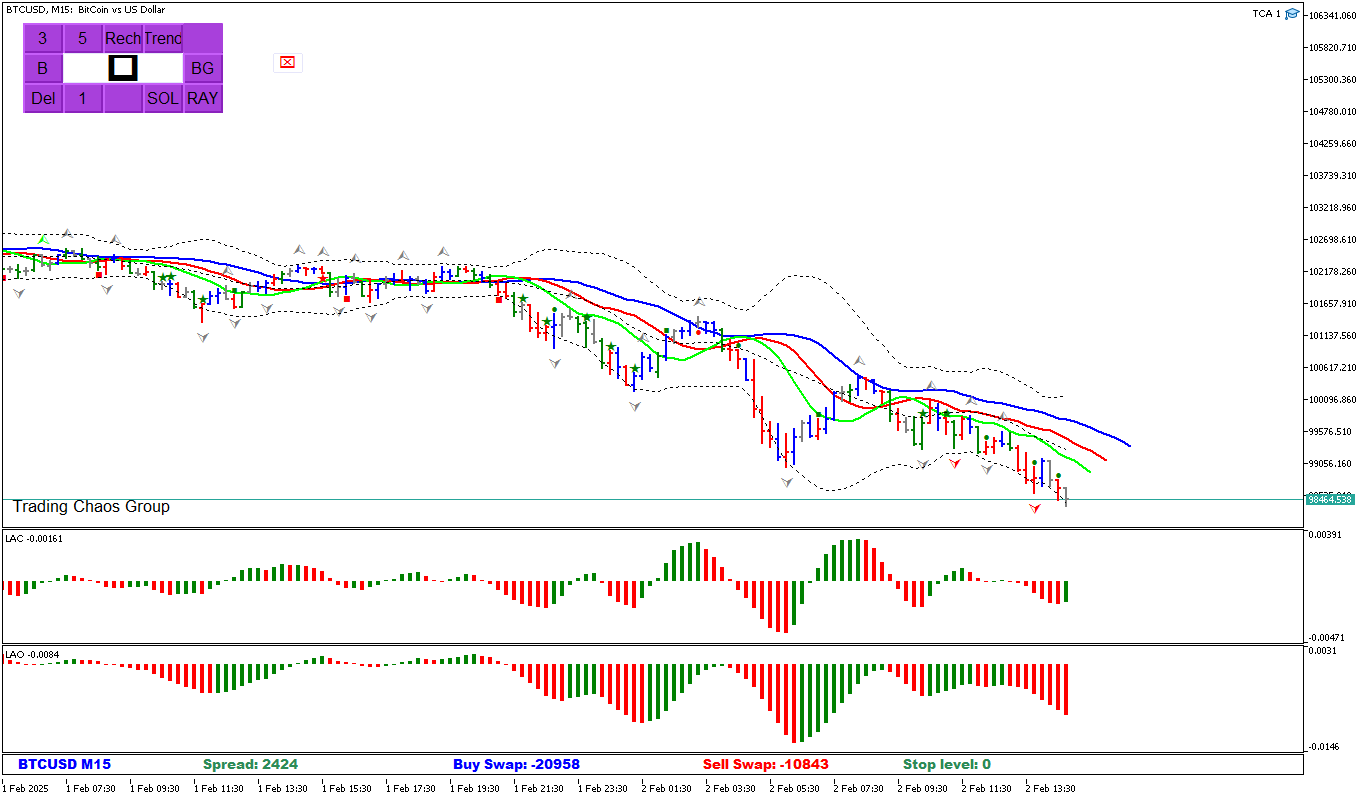
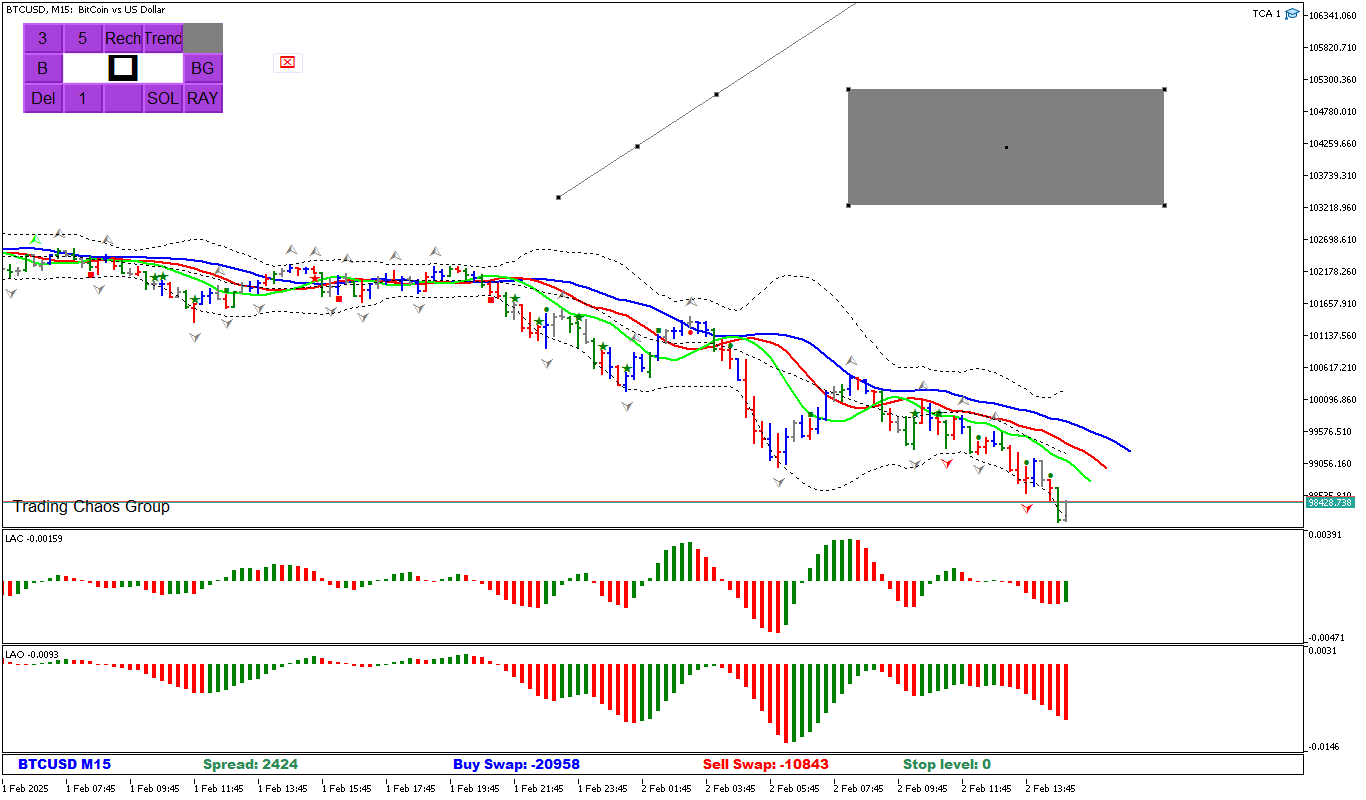
This is followed by the 3rd block "Waves".
This block was created for. to greatly simplify the implementation of wave markup for traders. In MT5, it is far from easy to perform wave marking, but with this panel it becomes much easier to do it!
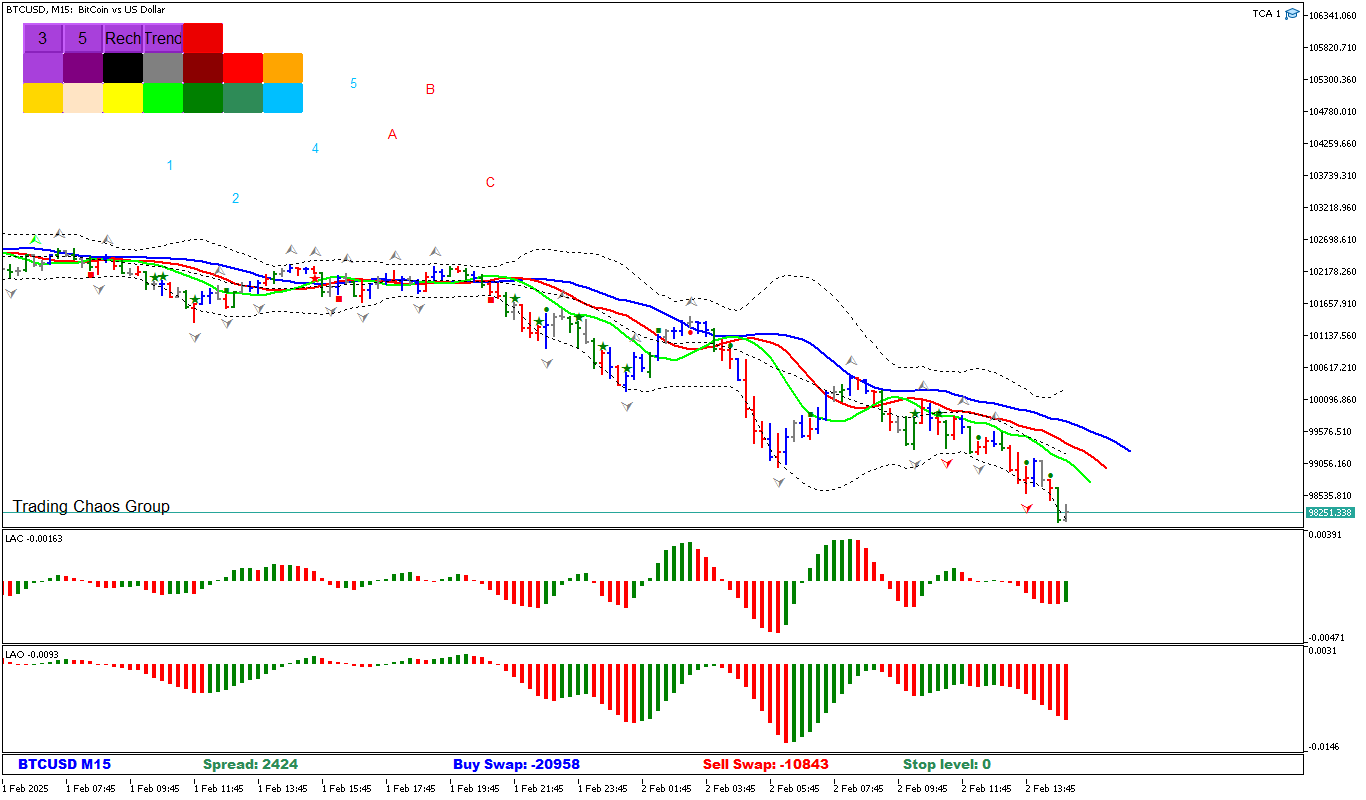
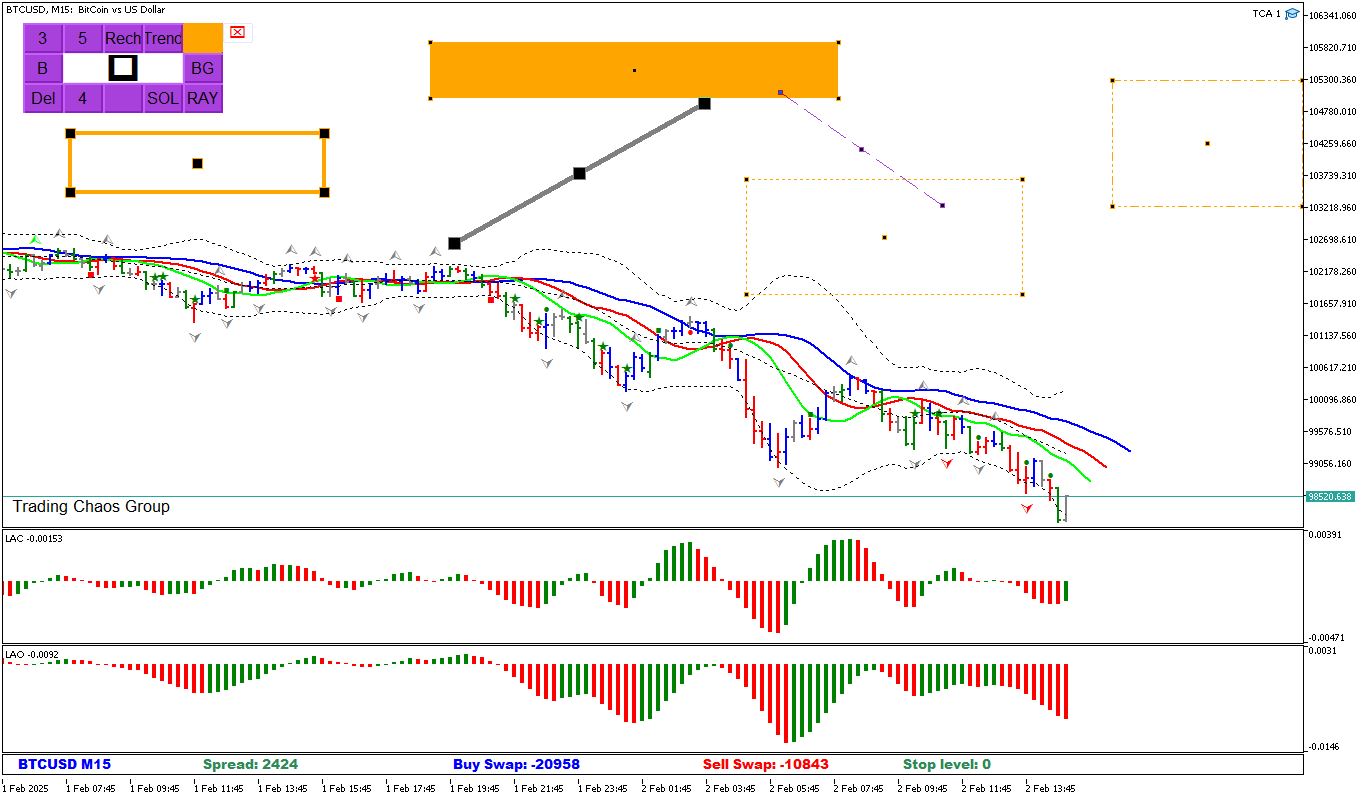
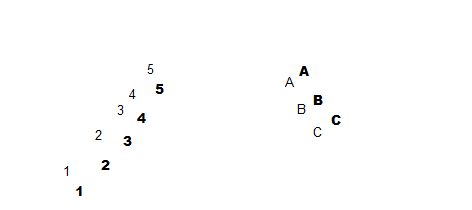
The first two buttons "3" and "5" are used to build zigzags "A,B, C" and pulse waves "1,2,3,4,5". They are followed by a button that allows traders to build a rectangle. The next button builds a trendline Panel waves + objects
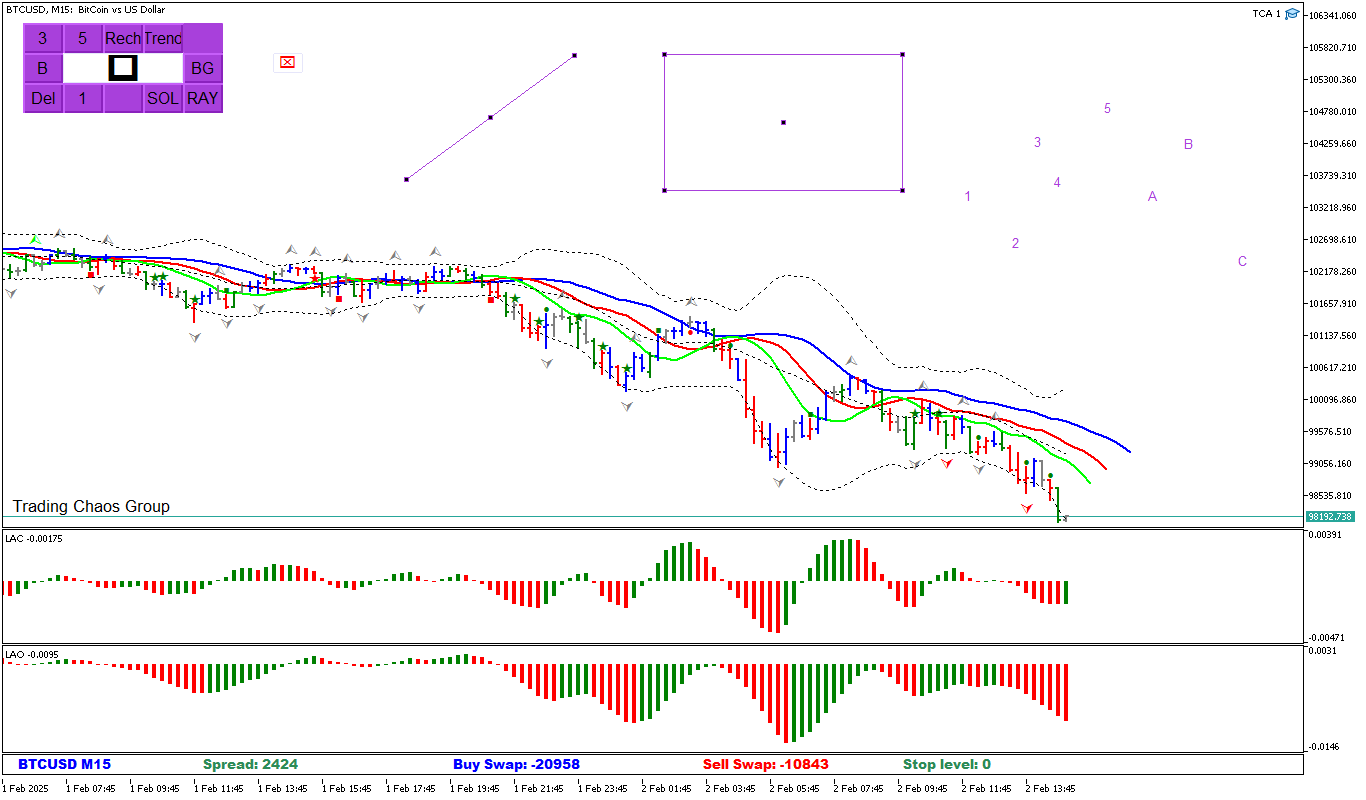
After the build buttons, there are color buttons. There are 14 variations of object coloring in total. To select a color, first select the desired color for coloring the graphic object, and only then select the coloring object itself.
After the color button, there are fill buttons (For the rectangle) and the ray button (For the trend line). To fill a rectangle, first create a rectangle and then click the color button "BG", thereby creating a shaded object. It's the same with the trend line. First we created a line, then we clicked on the "Ray" button and made it a ray.
To the left of the ray button, there is a line and rectangle style button. And there is an object thickness button next to it. (You selected the style or thickness of the object, and then created the object) thickness and style
To the left is the button for deleting all objects from the graph. Above it is an Elliott wave thickness button (In order to apply a thickened font for the wave. Press the button to build the Elliott wave ("3" or "5")Then press the "B" button. This will make the font bolder.
And also one of the most important buttons in this panel (the White button that is located in the middle of the graph). It allows you to open any movement on the scale (from 140 bars) that Bill Williams talked about in the 1st trading chaos.
Scale

This is followed by the 4th "Hand Open" block. In this panel, the trader is given the opportunity to select the type of transaction, select a lot, or a percentage of the deposit, as well as set a stop loss, take profit and trailing stop.
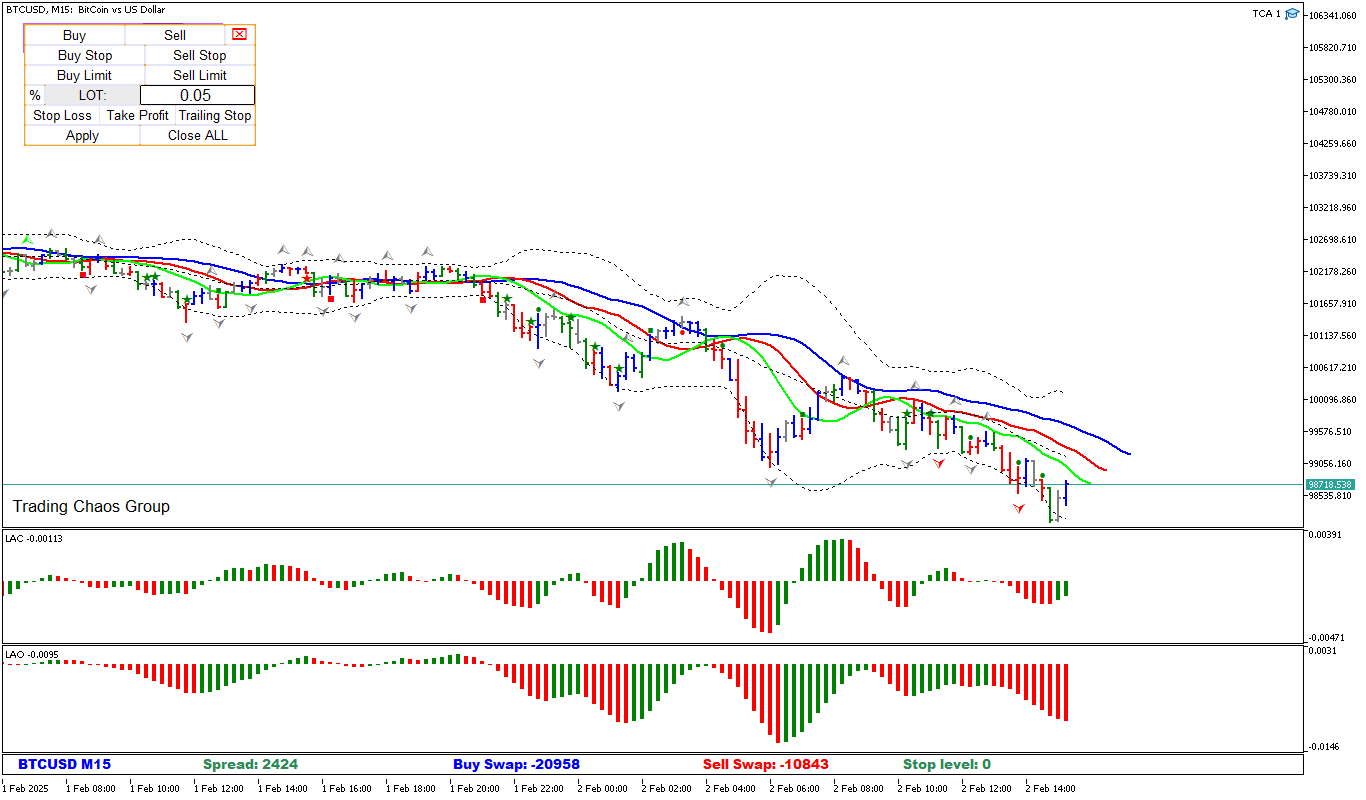
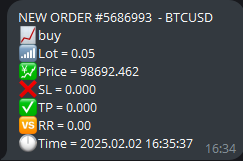
If a trader has a desire to enter the market with an immediate order, then by clicking on the "Buy" or "Sell" button, the trader will enter the market, and will also receive a signal to open a deal in telegram.
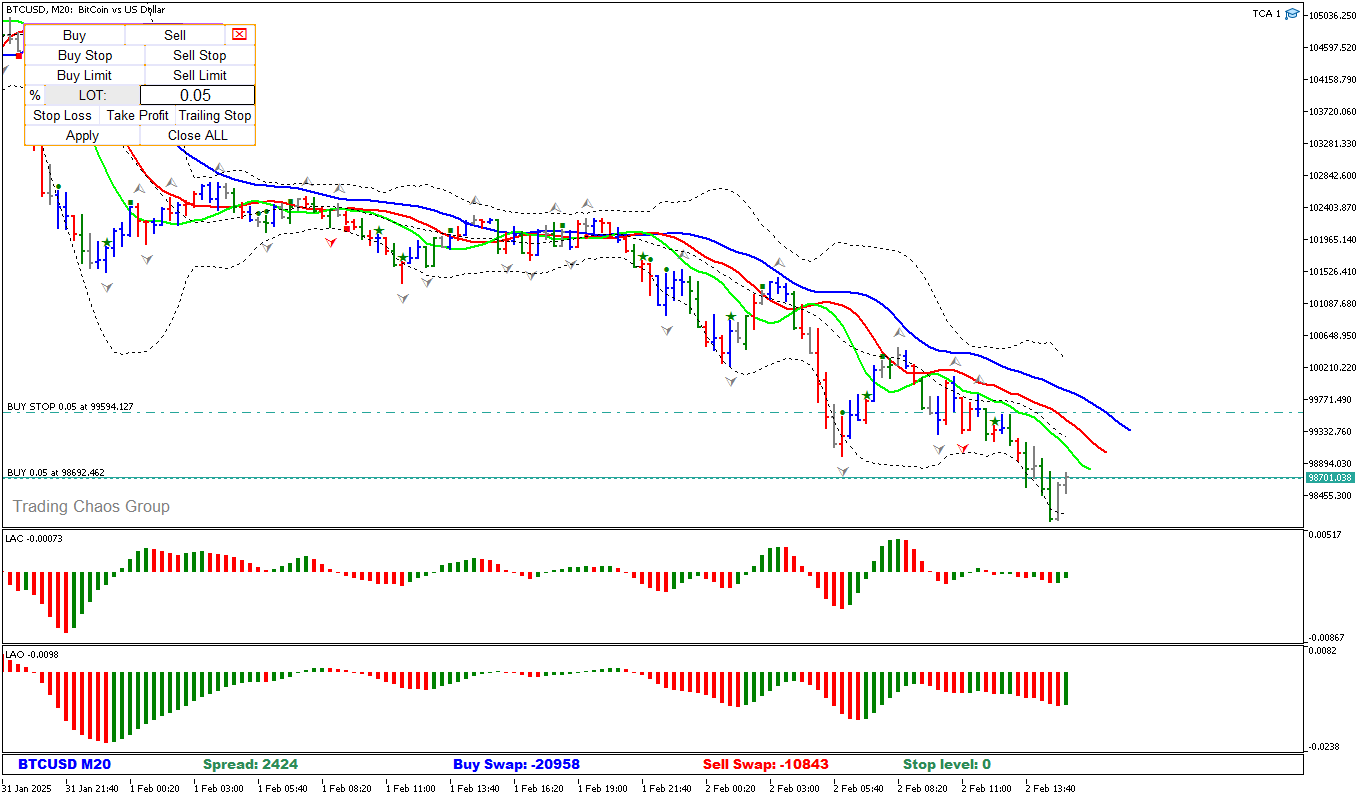
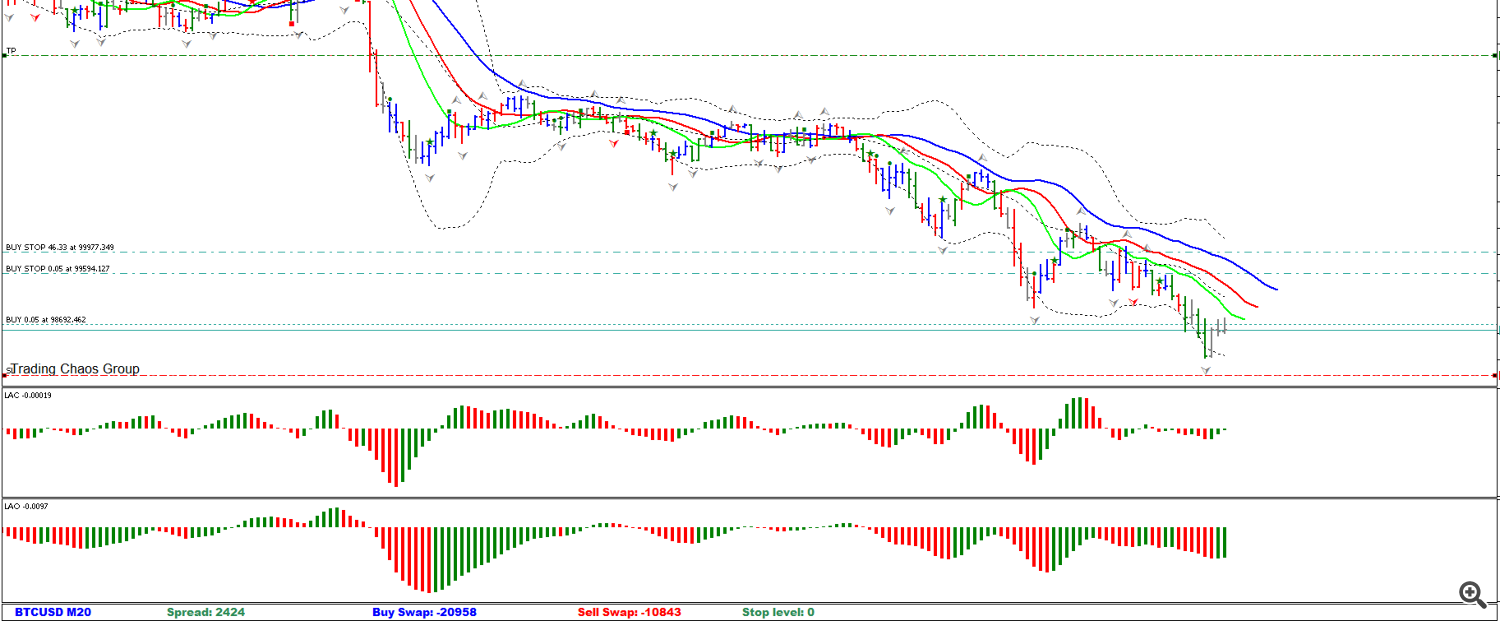
With pending orders, everything is a bit more complicated. First, you select the type of pending order, then move the blue line to the price you need, after which you click on the "Apply" button and the panel displays the pending order. Entering into a transaction
The trader can also select a lot for the transaction. At the same time, in the input parameters of the panel, there are two items- "Fuses", which will not allow the trader to enter the market with a large volume or percentage of the deposit. By default, this is 10% of the deposit and 10% of the volume.
To select the calculation of % of the deposit, click the button with the "%" icon and specify the desired percentage for entry in the field.
Also, when you click on the Stop Loss and Take Profit buttons, lines are created along which Take Profit and Stop Loss will be set.
There is also a "TS" button, which is needed for the trader to select a trailing stop. At the moment, there are only 3 possible variations of trailing.
1) By fractals
2) Along the red line of the alligator
3) Standard trailing stop
Also, if desired, you can disable the trailing stop by clicking the "No TS" button in the drop-down list.
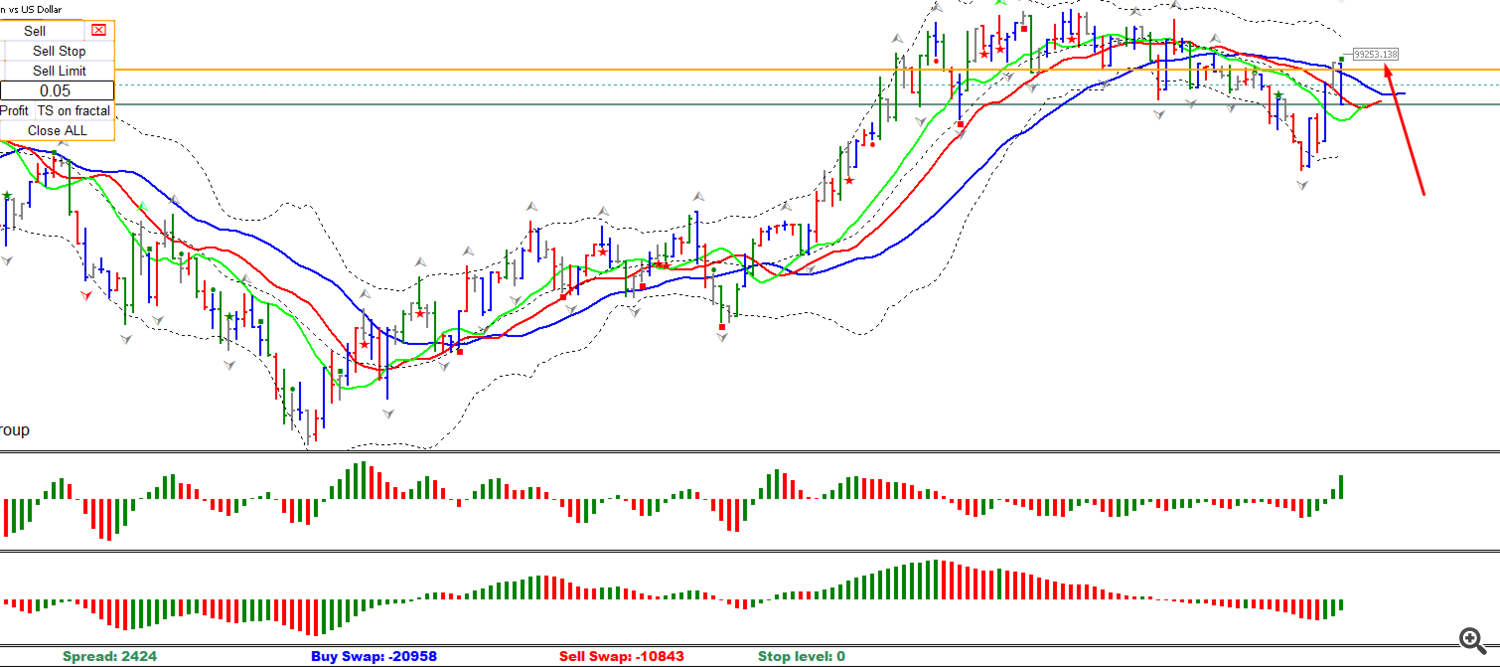
The gray placemark (To which the arrow goes) This is the value where the stop level will be placed.
THE TRAILING STOP WILL START MOVING ONLY IF THE POSITION IS IN PROFIT.
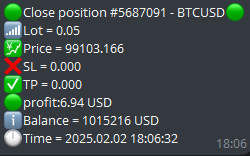
Upon closing the transaction, the panel will send an alert in telegram.
The "Close All" button. Closes open positions of the same type.
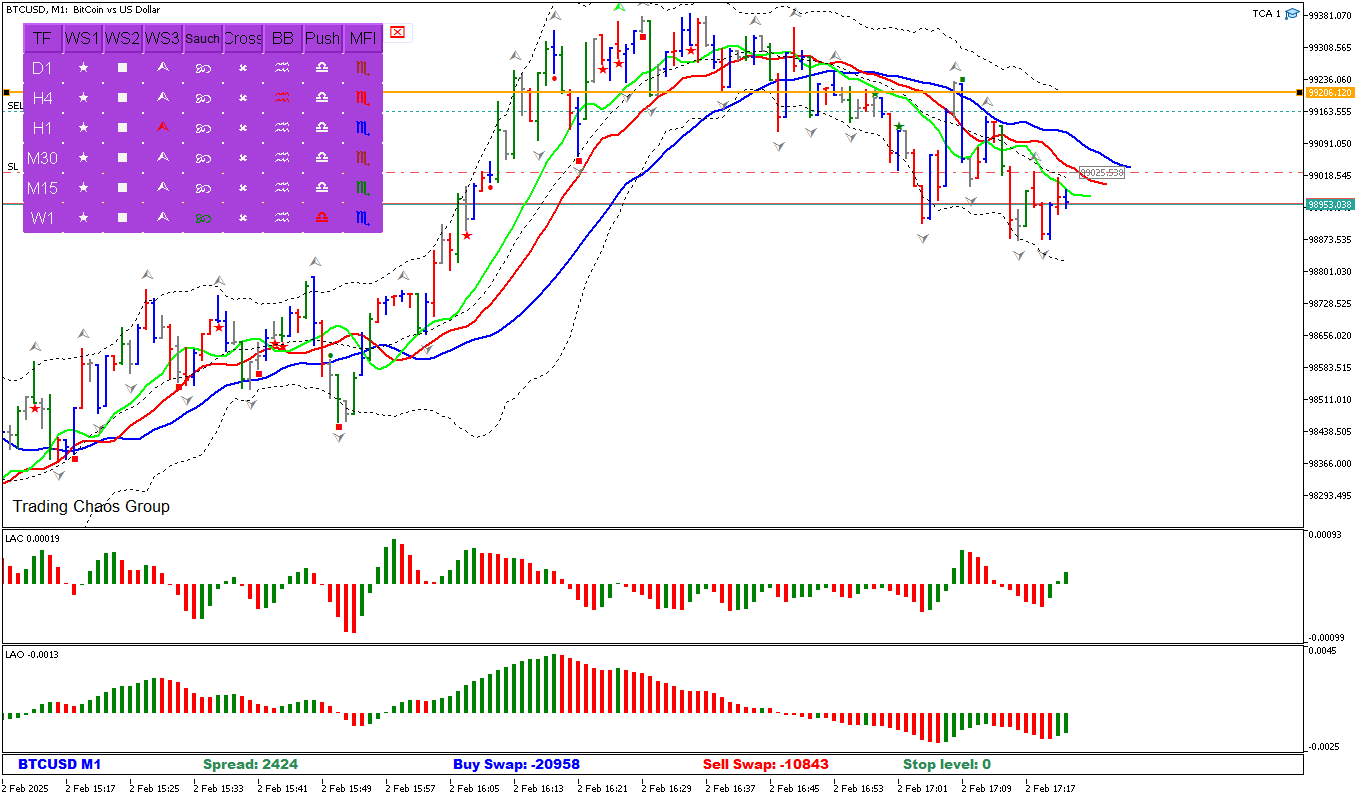
5th block. "Signals"
This block searches for signals from the specified list of timeframes in the input parameters.
1) The Star is a bullish/bearish reversal bar with a close in the upper/lower third.
2) The square signal of the 3rd column of the histogram of the AO indicator
3) Fractal - a signal for a fractal breakdown below/above the red forehead
4) Infinity is a saucer signal described in Bill Williams' book "New Dimensions in Stock Trading"
5)The cross is the intersection of line 0 of the histogram of the AO indicator. The signal is described in Bill Williams' book "New Dimensions in Stock Trading"
6) Waves are a signal for the breakdown of Bollinger bands
7) Pyramid is a push signal described by Larry Williams in the book "Long-term secrets of Short-term Trading"
8) The letter M is the color of the MFI indicator
The timeframe is highlighted in Green, and the trend is upward. Red is a bearish trend. The trend is determined by the breakdown of Bollinger bands, fractals, the opening of the alligator's mouth, as well as AO in the positive zone.
When the TF button is pressed, the schedule changes to the selected time interval.
Version 3.30
- The following innovations have been added Added more options for customizing the panel.
- Added a function to protect the MinMarginLevel deposit(Specified in the input parameters)
- Two buttons have been added: A button showing the time and a button showing the profit/loss from all open trades. The icons have been changed (The change only affected the outer part)

Version 3.50 1) Fixed bugs
2) Added the ability to use the panel from different types of monitors
3) Improved Risk Management System
4) A custom font has been added (The font can be downloaded from the user manual)
5) The system of sending a message about the opening of a position in a telegram has been changed

A special font is attached to the bottom of the page.
If you have any questions, write to me in private messages. I also recommend subscribing to my updates. To do this, follow the link to my profile and click "Add to friends".


")
")
 на 28-07-2026")