
MQL5 Wizard Techniques you should know (Part 83): Using Patterns of Stochastic Oscillator and the FrAMA — Behavioral Archetypes
Introduction
Our platform, MetaTrader 4/5, over the 2 decades it has been available, has been widely accepted mostly for its flexibility, which in essence is allowing both manual trading and automated trading. For instance, both manual and auto modes are not only available to cater for a variety of trading approaches, but they are furnished with suitable toolkits. There is an events-news-calendar for manual trading and a strategy-tester-console for automated trading, amongst a host of other tools, for each.
The MQL5 Wizard though, which benefits trading automation, and not manual trading, is the unsung hero that allows the prototyping of multi-signal systems with customizable trailing stops as well as money management. Within every wizard-assembled Expert Advisor, there is an orchestration of the building blocks: one, or many signal-classes; some trailing stop logic; and money management rules. The signal class, our primary focus for many of the articles in these series, is where patterns get spotted, probabilities become inferred, and trade decisions originate.
For this article, we are once again doing a deep plunge into a created custom Signal Class that brings together the Stochastic Oscillator and the Fractal Adaptive Moving Average. This infusion of two well known indicators is meant to give us a powerful hybrid system whose indicator-end-goal is to provide a ‘pipelined’ binary representation of these indicators’ logic. This primarily serves as a digital noise filter for market patterns. As usual, we are going to consider 10 indicator patterns that cater to different sorts of markets, with the market types under consideration being trending/mean-reverting, correlated/decoupled, and low-volatility/high-volatility. Each of these ten patterns that we’ll define in the custom signal class stands for a particular setup of either FrAMA slope or Stochastic positioning or price-pattern.
Our custom signal class design, therefore, does align well with the MQL5 Wizard’s modular nature and the attached code at the end of the article is meant to be placed in the ‘MQL5\Include\Expert\Signal\Custom’ folder, or as indicated in the header of the attached ‘.mq5’ file. Guidance on doing this, as well as assembling an Expert Advisor with the wizard, can be found here for new readers. Each of the custom signal class’s ten patterns is ‘self-contained’, in that they all get to use the same compute framework, yet users can toggle them on or off, assign different weights to each, or optimize each’s conditions separately in Strategy Tester. Our entire Expert Advisor setup, is therefore not a black-box but as transparent as possible. By being highly customizable, it is in essence adaptive, and better geared to tackle the different market types, at a hyper-tuning level, of trending/mean-reverting markets or correlated/decoupled markets or those with low/high volatility.
The framework for testing presented here, therefore, examines how our ten signal patterns shape up under each of these market regimes. We perform the usual training or optimization over a year and then do a forward test over the subsequent year. In considering these different regimes, we are also introducing testing on different asset classes - commodities, equities, and forex. More specifically, we are going to be testing XAU USD, S&P 500 Index, and the USD JPY pair. All testing is done on the 4-hour timeframe with training spanning from July 2023 to July 2024 while the forward testing is from July 2024 to July 2025.
At the end of this piece, we hope to show how the simple complimentary pairing of these two indicators can be transformed into a decision-making system with potential to spot context-dependent patterns. We hope to exhibit not just a framework for experimentation, but also one that can sieve for ideas that could be integrated into their own trade setups or systems.
Fusion of the Stochastic-Oscillator and FrAMA
In order to get a better sense of how the Stochastic Oscillator and Fractal Adaptive Moving Average (FrAMA) could compliment each other, it is vital to get a grasp of what each indicator measures. However, more than that, there could be a case for appreciating the use of vectorized binary patterns as an extra check or filter on our indicator signals.
If we start by considering the FrAMA though, it is a Moving Average that adjusts its sensitivity depending on the fractal dimension of price movements. Its objective is arguably to become smoother when markets are trending and more responsive in markets that are choppy or ‘fractal-like’ price situations. Its formula is given by:
![]()
When:
![]()
And:
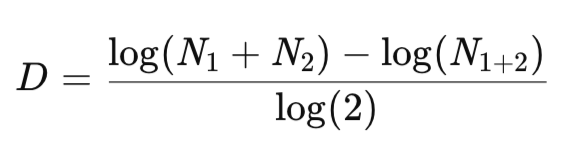
Where:
- P(t) is the current price (typically close price),
- D is the fractal dimension, a measure of market roughness,
- N1,N2 are the price ranges over consecutive segments within the FrAMA look back window.
In instances when the markets become smoother and more directional, the D value would tend towards one. This in turn makes alpha larger - with another positively correlated feature being that the FrAMA closely tracks price like a fast moving average. However, when the market is more chaotic or range-bound, then D tends to approach 2. This the FrAMA smoother or flattish, since it is then serving to filter out this noise. In the custom signal class, we adopt below, therefore, the FrAMA behaves like a context-aware trend backbone. It is dynamically re-calibrating its slope depending on the volatility and price structure.
The Stochastic-Oscillator, which was the brain-child of George Lane, is one of the oldest and perhaps most used momentum indicators. It quantifies the position of the current closing price relative to the high-low range, across a fixed period. This indicator comprises two buffers, named K and D. Their formulae are as follows:

Where:
- Ct = current close,
- Hn = highest high over the past n periods,
- Ln = lowest low over the past n periods,
- SMAm = simple moving average of %K over m periods.
Within MQL5’s inbuilt indicator library, the pertinent class for this indicator is CiStochastic as one would expect. The mapping to these two buffers, K and D can be got from the Main-function and the Signal-Function, off an instance of this class. As it is well-known, the K moves between 0 and 100 such that marking an asset as oversold would have it below the 20 level, while when above the 80 level, that could indicate overbought regions. The crossovers of the K and D, as well as their patterns in and around these thresholds are important in spotting reversals, and continuations. For this article, these form the basis for our binary representations that serve as our signal.
Having defined our two indicators, we can now consider their ‘fusion’. The combination of FrAMA and the Stochastic constructs dual dimensioned logic where FrAMA spots trend direction and adapts its smoothness so that we can get a dynamic metric on market bias, whether up, down, or flat; and the stochastic identifies any exhaustions in momentum or suitable timed-entries relative to a prevalent price-range. The usage of both tends to cancel out each other's weaknesses. The FrAMA avoids trendless noise from premature signals, while the stochastic helps avoid late entries when experiencing reversals. Below is a listing of the extra custom functions introduced for this indicator pairing.
//+------------------------------------------------------------------+
//|                                                                  |
//+------------------------------------------------------------------+
bool CSignalFrAMA_Stochastic::FlatFrama(int ind)
{  const double tol = m_pips * m_symbol.Point();
   for(int i = ind; i < m_past+ind; i++)
      if(MathAbs(FrAMASlope(i)) > tol) return false;
   return true;
}

//+------------------------------------------------------------------+
//|                                                                  |
//+------------------------------------------------------------------+
bool CSignalFrAMA_Stochastic::FarAboveFrama(const int ind, double mult)
{  double dist = MathAbs(Close(ind) - FrAMA(ind));
   double atr  = High(ind + 1) - Low(ind + 1);
   if(atr <= 0.0) return false;
   //printf(__FUNCTION__ + " dist & atr are: %.5f, & %.5f ", dist, atr);
   return (Close(ind) > FrAMA(ind) && dist > mult * m_symbol.Point() * atr / 4.0);
}
//+------------------------------------------------------------------+
//|                                                                  |
//+------------------------------------------------------------------+
bool CSignalFrAMA_Stochastic::FarBelowFrama(const int ind, double mult)
{  const double dist = MathAbs(Close(ind) - FrAMA(ind));
   const double atr  = High(ind + 1) - Low(ind + 1);
   if(atr <= 0.0) return false;
   //printf(__FUNCTION__);
   return (Close(ind) < FrAMA(ind) && dist > mult * m_symbol.Point() * atr / 4.0);
}
//+------------------------------------------------------------------+
//|                                                                  |
//+------------------------------------------------------------------+
bool CSignalFrAMA_Stochastic::BullishDivergence()
{  int a = -1, b = -1;
   for(int i = 2; i <= m_past + 2; i++)
   {  if(Low(i) < Low(i - 1) && Low(i) < Low(i + 1))
      {  if(a == -1) a = i;
         else
         {  b = i;
            break;
         }
      }
   }
   if(a == -1 || b == -1) return false;
   bool priceLL = (Low(a) < Low(b));
   bool oscHL   = (K(a) > K(b));
   return (priceLL && oscHL);
}
//+------------------------------------------------------------------+
//|                                                                  |
//+------------------------------------------------------------------+
bool CSignalFrAMA_Stochastic::BearishDivergence()
{  int a = -1, b = -1;
   for(int i = 2; i <= m_past + 2; i++)
   {  if(High(i) > High(i - 1) && High(i) > High(i + 1))
      {  if(a == -1) a = i;
         else
         {  b = i;
            break;
         }
      }
   }
   if(a == -1 || b == -1) return false;
   bool priceHH = (High(a) > High(b));
   bool oscLH   = (K(a) < K(b));
   return (priceHH && oscLH);
}
//+------------------------------------------------------------------+
//|                                                                  |
//+------------------------------------------------------------------+
bool CSignalFrAMA_Stochastic::FramaTurningUp()
{  return (FrAMASlope(X() + 3) < 0 && FrAMASlope(X() + 2) < 0 && FrAMASlope(X() + 1) > 0 && FrAMASlope(X()) > 0);
}
//+------------------------------------------------------------------+
//|                                                                  |
//+------------------------------------------------------------------+
bool CSignalFrAMA_Stochastic::FramaTurningDown()
{  return (FrAMASlope(X() + 3) > 0 && FrAMASlope(X() + 2) > 0 && FrAMASlope(X() + 1) < 0 && FrAMASlope(X()) < 0);
}
For new readers, to get a binary representation, every indicator’s condition gets verified using a boolean true or false framework. So, for instance, checks are made on whether there is slope, or a range condition exists, etc. Every such result then becomes a 1-bit-signal, which on aggregation is a binary vector, whose 1s imply the presence of a pattern and the 0s mean the pattern is absent. In essence, this method digitizes analog price-action, thus enabling an Expert Advisor to read the market as a series of boolean vectors. These vectors are also computationally lightweight, which allows more than one pattern check per new-price-bar, minimizing CPU load.
The Testing Framework
Our goal in testing the signal patterns of the stochastic oscillator and FrAMA is not restricted to back testing a single strategy, but rather to better grasp how ten unique indicator patterns behave in distinct market settings. In order to have statistical consistency, all our tests are performed under the same input optimization settings, with the major caveat being specific asset types are tested with different market archetypes.
All ten signal-patterns are tested on the 4-hour timeframe as a compromise between balancing noise reduction by not being too small while having sufficient trade frequency from being small enough. As mentioned above, every pattern is trained/optimized from July 1st 2023 to July 1st 2024, while the forward-walk/validation is performed from July 1st 2024 to July 1st 2025. Our split format ensures a full year of in-sample training that gets followed by another year of out-of-sample validation.
In the optimization run, our tuned parameters were the typical open and close thresholds of the custom signal class, the limit price entry delta for any placed trades, as well as the take profit. We also always tune for each signal pattern’s open/trigger threshold, as we have been doing in past articles. What we introduce, in addition to these, is the adjustment of the look back period and pips threshold. The bit-mask parameter ‘PatternsUsed’ also gets manually adjusted for each signal pattern run, as already explained in previous articles.
In order to better contextualize all the binary patterns, the tests were grouped per security according to a particular market archetype. The chosen securities were meant to best demonstrate each of these market behaviors. This was tabulated as follows:
| Market Type | Patterns Tested | Security Used | Rationale |
|---|---|---|---|
| Trending | 0,6 | XAU USD | Gold’s ability to trend on macro-factor alignment |
| Mean-Reverting | 1,7 | XAU USD | Gold’s intraday consolidations, which could indicate momentum peaks |
| Correlated | 2 | SPX | Strong inter-stock correlations and momentum alignment signals |
| Decoupled | 3,9 | SPX | Divergence and decoupling logic can do well in some asymmetric sectors |
| High-Volatility | 4,8 | USD JPY | Yen volatility can point to overshoots and midline turning patterns |
| Low-Volatility | 5 | USD JPY | Ranging and flat FrAMA can be frequent in tight volatility cycles. |
Our tabulated mapping above is meant to allow every signal-pattern to be looked at in the ‘environment for which it is conceptually designed’.
Our optimization criteria was the inbuilt ‘complex-criterion’ that can be understood to emphasize robustness and better generalization as opposed to raw profit. Since, also, we are structuring every signal pattern as a self-contained binary logic block, the contextual-relevance of each pattern to the market-archetype of the tested security can be better affirmed or discredited. Developers therefore are in a position to then reuse this framework for independent hybrid strategies by making alterations with minimal code changes.
Pattern-0: Trending Market Breakout Alignment
Our premiere pattern is built to thrive in directional momentum driven markets. Its core logic aligns with adaptive slope of FrAMA and the crossover signalling of the stochastics. We implement it as follows in MQL5:
SELL - Price is below the FrAMA; FrAMA slope is negative, showing downward momentum; Stochastic %K line crosses below %D, signaling a bearish crossover, %K value is above 80, meaning the market was overbought.

//+------------------------------------------------------------------+
//| Check for Pattern 0.                                             |
//+------------------------------------------------------------------+
bool CSignalFrAMA_Stochastic::IsPattern_0(ENUM_POSITION_TYPE T)
{  if(T == POSITION_TYPE_BUY)
   {  return((Close(X()) > FrAMA(X()) && FrAMASlope(X()) > 0 && CrossUp(K(X()), D(X()), K(X() + 1), D(X() + 1)) && K(X()) < 20) ? true : false);
   }
   else if(T == POSITION_TYPE_SELL)
   {  return((Close(X()) < FrAMA(X()) && FrAMASlope(X()) < 0 && CrossDown(K(X()), D(X()), K(X() + 1), D(X() + 1)) && K(X()) > 80) ? true : false);
   }
   return(false);
}
The sell-signal which is a mirror of the bullish looks for price being below FrAMA, with FrAMA having a negative slope, and a downward crossover in the stochastic with the K above 80. Pattern-0 encapsulates the transition from compression to expansion, the hallmark of starting trends. We chose Gold, a commodity, because it often oscillates between extended directional runs and consolidation traps that usually get driven by narratives on the macro that include expectations on inflation as well as central-bank policy stances. Gold is chosen to exploit pattern-0’s trend sensitivity. The forward test results for pattern 0 are presented below as well:

We are able to just, forward-walk with some profit. This pattern’s ‘success’ could be underscoring two key observations. Firstly, the choice of security tested could have been suitable given XAU macro-driven dynamics as a high momentum instrument. Its daily range amplitude tends to allow the stochastic component to recover from oversold levels without premature reversals. Secondly, the pattern robustness could have been key here as well, given that we are considering a pair of perpendicular measures - trend direction and momentum re-acceleration. Each of the two indicators contributes unique data to the binary verdict, which goes on to play out successfully not just when training, but also in the forward walk.
Pattern-1 Mean-Reversion Hook Reversal
While with pattern-0 we were after breakouts in trending markets, for this signal-pattern we take a somewhat opposite stance by focusing on mean-reversion. We are after exhaustion points where price temporarily deviates from equilibrium prior to snapping back. This pattern engages stochastic sensitivity at short-term extremes, with the FrAMA serving as a dynamic reference line, helping identify over-extensions within its adaptive range.
Pattern-1 should work well for assets that oscillate a lot around a central tendency, with frequent momentum peaks and troughs being recorded with relatively ‘stable’ volatility. Gold can exhibit these traits, especially in its consolidations following strong rallies or declines. We implement this in MQL5 as follows:
SELL - Price is above the FrAMA (overvalued region); %K line is greater than 85, in a strong overbought condition; The %K line is falling, i.e., it’s lower than it was one bar ago

//+------------------------------------------------------------------+
//| Check for Pattern 1.                                             |
//+------------------------------------------------------------------+
bool CSignalFrAMA_Stochastic::IsPattern_1(ENUM_POSITION_TYPE T)
{  if(T == POSITION_TYPE_BUY)
   {  return((Close(X()) < FrAMA(X()) && K(X()) < 15 && K(X()) > K(X() + 1)) ? true : false);
   }
   else if(T == POSITION_TYPE_SELL)
   {  return((Close(X()) > FrAMA(X()) && K(X()) > 85 && K(X()) < K(X() + 1)) ? true : false);
   }
   return(false);
}
Every side of the trade, the buy and the sell signals, capture the first turn of the K when in extreme zones. This is done while positioning against short-term crowd behavior. The FrAMA, acting as a filter, ensures order entries that happen when price is stretched away from the mean that recall is constantly ‘adapting’. This is meant to reduce false reversals in trending runs.
Gold, though a trending stalwart, can in its consolidation phases also be suited for mean-reversion patterns. It can oscillate within tight, directionless corridors, especially when macroeconomic catalysts are on pause. In these times, the FrAMA slope tends to flatten, representing an adaptive equilibrium that points to ‘fair value’. When concurrently, the stochastic hooks inside extreme regions, below 15 or above 85, it does mirror the exhaustion of speculative positioning which presents entry reversal opportunities. The forward result tests were profitable, and they gave us the following report.

Pattern-2: Correlated Trend Continuation
Our third pattern is designed to grab sustained trend extensions in market settings with correlations, where assets show synchronized movements that are driven by common macro influences. This pattern exploits a robust FrAMA that would have either a strong positive slope for buys or an inversely negative one when selling. This then needs to be paired with consistent stochastic oscillator positioning. Particularly, the K and D need to remain north of the 50 when going long or below when positioning for short. This is meant to represent persistent momentum. We implement this as follows in MQL5.
SELL - FrAMA slope is strongly negative, confirming a downtrend; for the past lookback period, both Stochastic %K and %D stayed below 50, showing persistent bearish sentiment.

//+------------------------------------------------------------------+
//| Check for Pattern 2.                                             |
//+------------------------------------------------------------------+
bool CSignalFrAMA_Stochastic::IsPattern_2(ENUM_POSITION_TYPE T)
{  const double strong = m_pips * m_symbol.Point();
   bool up   = (FrAMASlope(X()) > strong);
   bool down = (FrAMASlope(X()) < -strong);
   bool over = true, under = true;
   for(int i = 0; i < m_past; i++)
   {  over  &= (K(X() + i) > 50 && D(X() + i) > 50);
      under &= (K(X() + i) < 50 && D(X() + i) < 50);
   }
   if(T == POSITION_TYPE_BUY)
   {  return((up   && over)  ? true : false);
   }
   else if(T == POSITION_TYPE_SELL)
   {  return((down && under) ? true : false);
   }
   return(false);
}
Strictly speaking, any asset can be used to at least test out this pattern, and our use of the SPY was in no ways a strict recommendation. However, the Index is arguably suitable for this pattern since among the 10-patterns that we are considering, this is the one of those that lean the most towards correlation, and this index tends to bear high correlations with its constituent stocks. Autocorrelation is therefore bound to high, in certain periods. Our forward walk test painted mildly promising results, as indicated below.

Pattern-3 Decoupled Divergence Recognition
Our 4th pattern, moves away from pure direction following rules and instead focuses on market decoupling. This is when price and momentum start to move out of sync. This pattern harnesses the structural contrast between FrAMA and the stochastic from the view point of a smooth trend representation versus a short term measure of internal energy, respectively. The goal is to spot divergences, bullish and bearish, moments before price hits a new extreme, for buys and sells respectively. This signalling then needs to be followed by the stochastic oscillator failing to confirm continuing momentum, a potential exhaustion. This is meant to mark a decoupling, especially in environments that are usually correlated and have a lot of synchronized behaviors. We implement this as follows in MQL5.
SELL - Price is above the FrAMA, but momentum disagrees; There’s a bearish divergence; Price makes a higher high, but Stochastic %K makes a lower high.

//+------------------------------------------------------------------+
//| Check for Pattern 3.                                             |
//+------------------------------------------------------------------+
bool CSignalFrAMA_Stochastic::IsPattern_3(ENUM_POSITION_TYPE T)
{  if(T == POSITION_TYPE_BUY)
   {  return((Close(X()) < FrAMA(X()) && BullishDivergence())  ? true : false);
   }
   else if(T == POSITION_TYPE_SELL)
   {  return((Close(X()) > FrAMA(X()) && BearishDivergence()) ? true : false);
   }
   return(false);
}
The SPY Index was suited for this pattern in the sense that it is often auto-correlated, given the sync between it and its underlying assets. This setup is thus primed for occasional temporary decoupling when some ‘inevitable’ sector divergences play out. For instance, tech may strengthen while energy weakens based on some short term themes, or surprise news headlines. These cross-sector divergences can show up during macro-inflection points and often portend indicator divergences at the index level. In this case, the FrAMA is the structural ‘base-line’ while the stochastic is a ‘near-term accelerometer’. When the two are at odds, this usually precedes trend fatigue or a rebalancing phase. Forward walk results for pattern 3 were as follows.

Pattern-3’s favorable result could be down to not chasing price but rather anticipating breaks in correlations, that usually precede broader market turning points.
Pattern-4: High Volatility Overshoot
Our fifth pattern, and final mention for this particular article, is built to pinpoint volatility driven extremes. These happen when price stretches way beyond its adaptive mean prior to either a correction or continuation occurring. This rule merges FrAMA’s adaptive baseline with a distance filter. Essentially, we are trying to spot statistically important deviations that are amplified by a volatility expansion.
This pattern is meant to operate in fast-moving markets where cases of overshoots are common place and trend bursts often stray beyond the equilibrium prior to normalizing. This is why we picked the USD JPY for this pattern. We implement it in MQL5 as follows.
//+------------------------------------------------------------------+
//| Check for Pattern 4.                                             |
//+------------------------------------------------------------------+
bool CSignalFrAMA_Stochastic::IsPattern_4(ENUM_POSITION_TYPE T)
{  if(T == POSITION_TYPE_BUY)
   {  return((FarAboveFrama(X()) && K(X()) > 60)  ? true : false);
   }
   else if(T == POSITION_TYPE_SELL)
   {  return((FarBelowFrama(X()) && K(X()) < 40) ? true : false);
   }
   return(false);
}
Our use of a dynamic distance as an extra hyperparameter, ‘dist’, sees the signal only triggering if the deviation is statistically significant. The input parameter ‘mult’ could have been tuned as well, however it is used almost as an epsilon or non-zero value. Readers can take a look at this code, which is attached below, and see if tuning this would be meaningfully sensitive to the signal pattern’s performance.
Back to the choice of USD JPY, this forex pair, and probably along with most yen pairs, tends to express its volatility asymmetrically. This is particularly evident when extended trending bursts occur, such as when there are monetary policy or interest rate differentials between the FED and the BOJ. These though tend to be followed by almost equal counter moves. Strong reactions are also apparent on intraday liquidity changes, or the release of major economic news. All these factors play into this pattern's high volatility ethos. Testing this pattern was profitable on its forward walk, as shown in the report below.

Pattern-4’ reliance on volatility scaling could be attributable to these favorable results.
Conclusion
For this indicator pairing we have the typical 10 patterns as has been the case with paired indicator signals, however we will consider only 5 for this article. Our next piece will resume where we are leaving off today. As we have seen, though, the merging of FrAMA and the Stochastic Oscillator in a custom signal class has exhibited some potential for usefulness outside our limited test windows. Each of the five patterns we have considered embodied a particular behavioral pattern that was best exhibited by a specific asset/security. We tested with XAU USD, SPX, and USD JPY, and we will continue with these securities on different but related market patterns in the next article.
Disclaimer
This is not financial advice. The goal with these articles is not to purport any understanding of the markets, but invite discussion of ideas. The aim is not to point to a grail, but rather to probe the trough of opportunities available and hopefully to exhibit how they could be tapped into. The finishing work and important diligence is always on the part of the reader, should he choose to incorporate some of the material presented here.
| name | description |
|---|---|
| WZ-83.mq5 | Wizard Assembled Expert Advisor whose header lists name and location of included files |
| SignalWZ_83.mqh | Custom Signal Class file for Wizard Assembly |
Warning: All rights to these materials are reserved by MetaQuotes Ltd. Copying or reprinting of these materials in whole or in part is prohibited.
This article was written by a user of the site and reflects their personal views. MetaQuotes Ltd is not responsible for the accuracy of the information presented, nor for any consequences resulting from the use of the solutions, strategies or recommendations described.
- Free trading apps
- Over 8,000 signals for copying
- Economic news for exploring financial markets
You agree to website policy and terms of use