Running along Lines

3
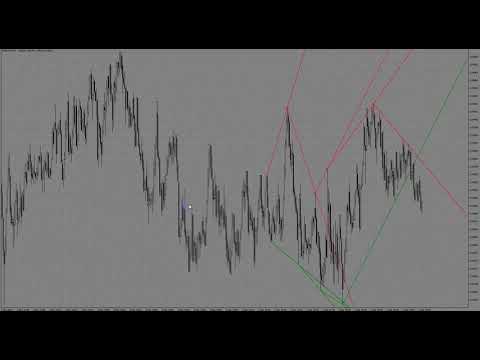
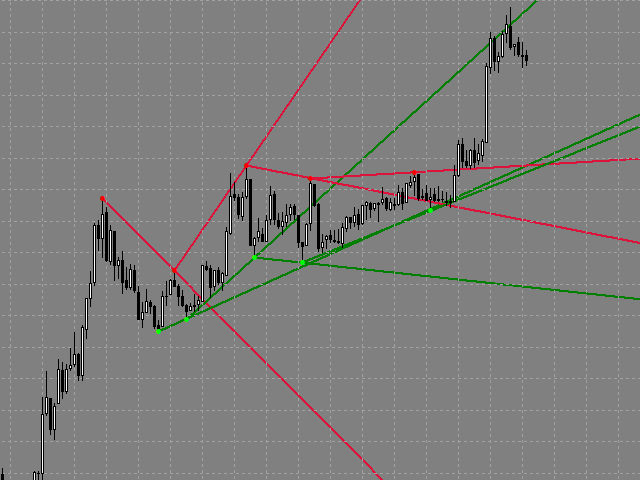
The indicator draws support and resistance lines on an important part of the chart for making decisions.
After the trend line appears, you can trade for a breakout or rebound from it, as well as place orders near it.
Outdated trend lines are deleted automatically. Thus, we always deal with the most up-to-date lines.
The indicator is not redrawn.

Settings:

  • Size_History - the size of the calculated history.
  • Num_Candles_extremum - the number of candles on each side of the extremum.
  • Type_Arrows_extremum - label style.
  • Color_Line_High - color of resistance lines.
  • Color_Line_Low - color of support lines.
  • Style_Line - line style.
  • Width_Line - line width.
  • Send_Sound - sound alert.
  • Send_Mail - send an email notification.
  • Send_Notification - send a mobile notification.
  • Send_Alert - standard terminal alert.
Comentários 3
krisnara123
2190
krisnara123 2022.02.03 12:55 
 

This indicator really simplifies trading .It helps traders to wait and pickup the sweet spot choice entries. Sometimes Trendlines turn out be more powerful than horizontal lines. Pavel is always open to receive some feature requests.

Produtos recomendados
O indicador SMC Venom Model BPR é uma ferramenta profissional para os traders que trabalham com o conceito Smart Money (SMC). Identifica automaticamente dois padrões principais no gráfico de preços: FVG   (Fair Value Gap) é uma combinação de três velas, em que existe um gap entre a primeira e a terceira velas. Forma uma zona entre níveis onde não há suporte de volume, o que geralmente leva a uma correção de preço. BPR   (Balanced Price Range) é uma combinação de dois padrões FVG que formam uma “
"Dynamic Scalping Oscillator" - um indicador avançado e personalizado para Crypto_Forex - uma ferramenta de negociação eficiente para MT4! - Nova geração de osciladores - veja as imagens para saber como usá-lo. - O Dynamic Scalping Oscillator possui zonas adaptáveis de sobrevenda/sobrecompra. - O oscilador é uma ferramenta auxiliar para encontrar pontos de entrada exatos em áreas dinâmicas de sobrevenda/sobrecompra. - Valores de sobrevenda: abaixo da linha verde, valores de sobrecompra: acima d
This is a new strategy for SUPPLY DEMAND areas It is based on a calculation using the tick volume to detect the big price action in market for both bear /bull actions this smart volume action candles are used to determine the supply and demand areas prices in between main supply and demand lines indicate sideway market  up arrows will be shown when prices moves above the main supply and the secondary supply lines Down arrows will be shown when prices moves below the main demand and the secondary
Daily Candle Predictor é um indicador que prevê o preço de fechamento de uma vela. O indicador destina-se principalmente ao uso em gráficos D1. Este indicador é adequado tanto para negociação forex tradicional quanto para negociação de opções binárias. O indicador pode ser usado como um sistema de negociação autônomo ou pode atuar como um complemento ao seu sistema de negociação existente. Este indicador analisa a vela atual, calculando certos fatores de força dentro do próprio corpo da vela, be
Quantum Balance
Adolfina Denysenko
Quantum Balance is a modern arrow indicator that identifies key price reversal points in the market with high accuracy. It is based on a combination of WPR (Williams %R) and RSI (Relative Strength Index), which allows you to identify overbought/oversold moments and enter trades at points of maximum potential. The indicator analyzes price dynamics and market conditions, generating signals only when several confirming factors coincide. This reduces the number of false signals and increases tradin
EARLY REMINDER: The Starting price is 65 price will rise soon up to 365$ and then 750$ after first 10 copies of sales. Grab this offer now! Introduction Hello, traders! Welcome to the demonstration of the Forex Beast Indicator , a comprehensive tool designed to assist aspiring traders in navigating the complexities of the forex market. This indicator incorporates seven essential components to provide a well-rounded trading experience: Moving Averages Colored Zones Support and Resistance Levels
Super Reversal Pattern
Parfait Mujinga Ndalika
Super Reversal Pattern Indicator Unlock the power of advanced pattern recognition with our Super Reversal Pattern Indicator. Designed for traders seeking precision and reliability, this indicator identifies one of the most effective reversal patterns in technical analysis, offering a significant edge in your trading strategy. Key Features: Non-Repainting Accuracy: Enjoy the confidence of non-repainting technology. Once a Super Reversal Pattern is detected, it remains static, providing consiste
Sniper Trend Fusion
Ilham Hijrah Saputra
Sniper Trend Fusion This indicator is a powerful all-in-one trading tool designed to simplify chart analysis and improve decision-making. It combines multiple proven techniques into a single system, helping traders identify trend direction, volatility, key price levels, and market structure without clutter. Instead of switching between multiple indicators, everything you need is integrated into one smooth and efficient interface. Key Advantages All-in-One System Combines trend, volatility, sup
FREE
Noize Absorption Index MT4
Ekaterina Saltykova
5 (1)
Noize Absorption Index - is the manual trading system that measures the difference of pressure between bears forces and bulls forces. Green line - is a noize free index that showing curent situation. Zero value of index shows totally choppy/flat market.Values above zero level shows how powerfull bullish wave is and values below zero measures bearish forces.Up arrow appears on bearish market when it's ready to reverse, dn arrow appears on weak bullish market, as a result of reverse expectation. S
Trend Bilio - an arrow indicator without redrawing shows potential market entry points in the form of arrows of the corresponding color: upward red arrows suggest opening a buy, green down arrows - selling. The entrance is supposed to be at the next bar after the pointer. The arrow indicator Trend Bilio visually "unloads" the price chart and saves time for analysis: no signal - no deal, if an opposite signal appears, then the current deal should be closed. It is Trend Bilio that is considered
The Super Arrow Indicator provides non-repainting buy and sell signals with exceptional accuracy. Key Features No repainting – confirmed signals remain fixed Clear visual arrows: green for buy, red for sell Real-time alerts via pop-up, sound, and optional email Clean chart view with no unnecessary clutter Works on all markets: Forex, gold, oil, indices, crypto Adjustable Parameters TimeFrame Default: "current time frame" Function: Sets the time frame for indicator calculation Options: Can be set
Indicador de gestão de risco e monitoramento de limites para traders profissionais e contas de avaliação (Prop) Esta ferramenta apenas exibe, no gráfico, informações precisas de gestão de risco e limites, ajudando você a decidir com mais foco. O indicador não abre/fecha/modifica ordens e não interfere com Expert Advisors (EAs). Recursos Monitoramento do drawdown diário e total Calcula e exibe o drawdown diário e total com base no Saldo (Balance) ou no Patrimônio (Equity) (configurável). Mostra
VR Cub
Vladimir Pastushak
VR Cub é um indicador para obter pontos de entrada de alta qualidade. O indicador foi desenvolvido para facilitar cálculos matemáticos e simplificar a busca por pontos de entrada em uma posição. A estratégia de negociação para a qual o indicador foi escrito tem provado a sua eficácia há muitos anos. A simplicidade da estratégia de negociação é a sua grande vantagem, o que permite que até mesmo os comerciantes novatos negociem com sucesso com ela. VR Cub calcula os pontos de abertura de posição e
Nosso indicador Basic Support and Resistance é a solução necessária para aumentar sua análise técnica.Este indicador permite que você forneça níveis de suporte e resistência no gráfico/ MT5 grátis Recursos Integração dos níveis de Fibonacci: Com a opção de exibir níveis de Fibonacci, juntamente com os níveis de suporte e resistência, nosso indicador fornece uma visão ainda mais profunda do comportamento do mercado e possíveis áreas de reversão. Otimização de desempenho: Com a opção de atualiz
Magical Arrow
Ranguni Abdulsamir Abdulmajid
Magical Arrow Indicator – Clear & Reliable Signals The Magical Arrow Indicator is a non-repainting, trend-following tool that gives you crystal-clear Buy and Sell signals . It  high-probability reversals and entries . No more guesswork – just follow the arrows on your chart! The Magical Arrow Indicator is a powerful, easy-to-use trading tool that helps you catch the most profitable Buy and Sell opportunities in the Forex market. It is designed for beginners and professional traders , giving y
Volume Profile Sniper v11. 1 - ferramenta abrangente de análise de mercado Abordagem profissional ao comércio O Volume Profile Sniper v11.1 combina mais de 15 filtros-chave em um único indicador, fornecendo sinais claros com base em uma avaliação abrangente da situação do mercado. Principais recursos Análise do desequilíbrio volumétrico-o algoritmo calcula a proporção de compradores e vendedores em cada vela, sinalizando a predominância de uma das partes (limite ajustável de 50% a 90%). Filtr
Indicador único que implementa uma abordagem profissional e quantitativa para significar negociação de reversão. Ele capitaliza o fato de que o preço desvia e retorna à média de maneira previsível e mensurável, o que permite regras claras de entrada e saída que superam amplamente as estratégias de negociação não quantitativas. [ Installation Guide | Update Guide | Troubleshooting | FAQ | All Products ] Sinais de negociação claros Incrivelmente fácil de negociar Cores e tamanhos personalizáveis
Arrow Signal System
Alex Amuyunzu Raymond
MV Arrow Signal System  Indicator Overview The MV Arrow Signal System is a comprehensive multi-indicator trading system for MetaTrader 4 that identifies potential buy and sell signals based on swing point detection combined with multiple technical confirmation filters. Core Concept The system scans price charts to identify swing highs and swing lows, then applies a scoring system based on multiple technical indicators to validate these potential reversal points. Only high-probability signals tha
Cosmic Diviner X Planet
Olena Kondratenko
4 (2)
This unique multi-currency strategy simultaneously determines the strength of trends and market entry points, visualizing this using histograms on the chart. The indicator is optimally adapted for trading on the timeframes М5, М15, М30, Н1. For the convenience of users, the indicator renders the entry point (in the form of an arrow), recommended take profit levels (TP1, TP2 with text labels) and the recommended Stop Loss level. The take profit levels (TP1, TP2) are automatically calculated for
O Fisher Yur4ik MT4 é um indicador de trading avançado que aproveita o poder da análise técnica para fornecer aos traders insights precisos sobre as tendências do mercado. Projetado especificamente para MetaTrader 4, este indicador é ideal para traders que buscam aprimorar seu processo de tomada de decisão e melhorar seus resultados de trading. Ao utilizar o Fisher Yur4ik MT4, os traders podem obter uma vantagem competitiva com alertas em tempo real e sinais visuais claros, permitindo que aprove
Supply and Demand Indicator + FREE Currency Strength Meter ADD-ON Looking for a powerful tool that can help you identify the most reactive zones in the forex market? Our supply and demand indicator for MetaTrader 4 and 5 is exactly what you need. With its advanced algorithms and real-time analysis, this indicator helps traders of all experience levels make informed trading decisions. The supply and demand indicator is a cutting-edge tool that helps traders identify areas where buyers and seller
Gvs Undefeated Trend   indicator is designed for trend and signal trading. This indicator generates trend signals.  It uses many algorithms and indicators to generate this signal. It tries to generate a signal from the points with the highest trend potential. This indicator is a complete trading product. This indicator does not need any additional indicators.  You can only trade with this indicator. The generated signals are displayed on the graphical screen.  Thanks to the alert features you ca
Phase Analytics Pro: Advanced Cyclic Market Analyzer Phase Analytics Pro is a sophisticated technical tool designed for traders who prioritize mathematical precision over lag-heavy traditional indicators. Based on the principles of digital signal processing, this indicator decomposes price action into phase and quadrature components to identify the dominant market cycle. How it works: The algorithm calculates the instantaneous phase of the market, allowing it to distinguish between trending and
EZZ Zig Zag MT4
Paulo Rocha
5 (1)
EZZ Elite Zig Zag is an indicator for the MetaTrader 4 terminal. This indicator traces the peak of the trend based on the market reversal, thus showing various opportunities in the financial market. EZZ Elite Zig Zag is a visual tool, intuitive, and easy to understand and use.  Test it Yourself by Downloading it for Free. Author Paulo Rocha all rights reserved
The Th3Eng PipFinite indicator is based on a very excellent analysis of the right trend direction with perfect custom algorithms. It show the true direction and the best point to start trading. With StopLoss point and Three Take Profit points. Also it show the right pivot of the price and small points to order to replace the dynamic support and resistance channel, Which surrounds the price. And Finally it draws a very helpful Box on the left side on the chart includes (take profits and Stop loss
Fibonacci recontratar e extensão linha de desenho ferramenta Fibonacci recontratar e estender a ferramenta de desenho de linha para a plataforma MT4 é adequado para comerciantes que usam método de negociação de pontos e negociação de secções douradas Vantagens: Não há linha extra, não há linhagem muito longa, e é fácil observar e encontrar oportunidades de negociação Versão experimental: https://www.mql5.com/zh/market/product/35884 Principais funções: 1. Podem ser desenhados diretamente vári
Infinity Trend Pro
Yaroslav Varankin
1 (1)
This is a trend indicator without redrawing Developed instead of the binary options strategy (by the color of the Martingale candlestick) Also works well in forex trading When to open trades (binary options) A signal will appear in the place with a candle signaling the current candle It is recommended to open a deal for one candle of the current timeframe M1 and M5 When a blue dot appears, open a deal up When a red dot appears, open a trade down. How to open trades on Forex. When a signal is rec
Este é um indicador MTF dos níveis de suporte e resistência com base nos   extremos do indicador Advanced ZigZag Dynamic   e / ou   Extended Fractals   com etiquetas de preço (pode ser desativado). TFs mais altos podem ser selecionados para o modo MTF. Por padrão, os níveis são gerados com base nos pontos do indicador ZigZag. Os pontos indicadores fractais também podem ser usados em conjunto com o ZigZag ou em vez dele. Para simplificar o uso e economizar tempo de CPU, o cálculo é realizado uma
This is the FXTraderariel-TakeProfit - Stop Loss Indicator . It provides you 3 potential Take Profits and 1 Stop Loss. These potential targets are computed based on several methods . The indicator can be used on every time frame, but we advise to use it on H1, H4 and D1. Especially if you are a novice trader. Pro Traders can also you use it for scalping in smaller time frames (M1, M5 and M15). This indicator is not a complete trading system. It doesn't provide you a Signal nor can predict the m
Binary Options Support Resistance Indicator This indicator is designed for binary options trading and effectively shows retracements from support and resistance levels. Signals appear on the current candle. A red arrow pointing downwards indicates a potential selling opportunity, while a blue arrow pointing upwards suggests buying opportunities. All that needs adjustment is the color of the signal arrows. It is recommended to use it on the M1-M5 timeframes as signals are frequent on these timef
Os compradores deste produto também adquirem
Neuro Poseidon MT4
Daria Rezueva
4.96 (24)
Neuro Poseidon is a new indicator by Daria Rezueva. It combines precise trading signals with adaptive TP/SL levels - creating best possible trades as a result! Message me and get  Neuro Poseidon Assistant  as a gift to automize your trading process! What makes it stand out? 1. Proven profitability on all assets and timeframes 2. Only confirmed BUY and SELL signals present on the chart 3. Adaptive TP & SL levels generated by the software for each trade 4. Easy to understand - suitable for all
Scalper Inside PRO
Alexey Minkov
4.74 (68)
Scalper Inside PRO Scalper Inside PRO is an intraday trend and scalping indicator for MetaTrader 4 that uses an exclusive algorithm to quickly detect market direction and key target levels. It automatically calculates entry, exit and multiple profit targets, and shows detailed performance statistics so you can see how different instruments and strategies performed. This helps you choose the most suitable trading instruments for the current market conditions. Additionally, you can easily integrat
Dynamic Forex28 Navigator
Bernhard Schweigert
4.43 (7)
Dynamic Forex28 Navigator - A ferramenta de negociação Forex de última geração. ATUALMENTE 49% DE DESCONTO. Dynamic Forex28 Navigator é a evolução dos nossos indicadores populares de longa data, combinando o poder de três em um: Indicador Advanced Currency Strength28 (695 avaliações) + Advanced Currency IMPULSE com ALERTA (520 avaliações) + Sinais CS28 Combo (Bônus). Detalhes sobre o indicador https://www.mql5.com/en/blogs/post/758844 O que o Next-Generation Strength Indicator oferece?  Tudo
Trend Lines PRO
Roman Podpora
5 (1)
LINHAS DE TENDÊNCIA PRO       Ajuda a entender onde o mercado está realmente mudando de direção. O indicador mostra inversões de tendência reais e pontos onde os principais participantes retornam ao mercado. Você vê     Linhas BOS     Análise de tendências e níveis-chave em prazos maiores — sem configurações complexas ou ruídos desnecessários. Os sinais não são repintados e permanecem no gráfico após o fechamento da barra. VERSÃO MT 5      -      Revela seu potencial máximo quando emparelhada co
Enigmera
Ivan Stefanov
5 (8)
ENIGMERA: O núcleo do mercado Importante: A demonstração do MQL5.com funciona no Strategy Tester e pode não refletir completamente a funcionalidade do Enigmera. Verifique a descrição, as capturas de tela e o vídeo para mais detalhes. Fique à vontade para me enviar uma mensagem com qualquer dúvida! O código do indicador foi completamente reescrito. A versão 3.0 adiciona novas funcionalidades e corrige erros acumulados desde o início do indicador. Introdução Este indicador e sistema de negociação
KT Alpha Hunter Arrows MT4
KEENBASE SOFTWARE SOLUTIONS
A maioria dos indicadores de setas entrega um sinal e deixa você descobrir todo o resto sozinho. O KT Alpha Hunter Arrows entrega um plano de trading completo. Cada seta de sinal aparece com um plano completo já desenhado no gráfico: linha de entrada, stop loss, quatro níveis de take profit e um veredito de edge em tempo real, mostrando se aquele ativo e timeframe valem a pena ser operados naquele momento. O pacote inclui o Trade Manager EA, que cuida da execução depois que você entra na operaçã
Este indicador é um indicador para análise automática de ondas que é perfeito para negociações práticas! Caso... Nota:   Não estou acostumado a usar nomes ocidentais para classificação de ondas. Devido à influência da convenção de nomenclatura de Tang Lun (Tang Zhong Shuo Zen), nomeei a onda básica como   uma caneta   e a banda de onda secundária como   um segmento   . ao mesmo tempo, o segmento tem a direção da tendência.   O segmento de tendência principal   é nomeado (esse método de nomencl
Este produto foi atualizado para o mercado de 2026 e otimizado para as versões mais recentes do MT5. AVISO DE ATUALIZAÇÃO DE PREÇO: Smart Trend Trading System está atualmente disponível por $99 . O preço aumentará para $199 após as próximas 30 compras . OFERTA ESPECIAL: Após comprar o Smart Trend Trading System, envie-me uma mensagem privada para receber o Smart Universal EA GRÁTIS e transformar seus sinais do Smart Trend em operações automatizadas. Smart Trend Trading System é um sistema de tr
MTF Supply Demand Zones
Georgios Kalomoiropoulos
4.82 (22)
Próxima geração de zonas automatizadas de oferta e demanda. Algoritmo novo e inovador que funciona em qualquer gráfico. Todas as zonas estão sendo criadas dinamicamente de acordo com a ação do preço do mercado. DOIS TIPOS DE ALERTAS --> 1) QUANDO O PREÇO ATINGE UMA ZONA 2) QUANDO UMA NOVA ZONA É FORMADA Você não recebe mais um indicador inútil. Você obtém uma estratégia de negociação completa com resultados comprovados.     Novas características:     Alertas quando o preço atinge a zona d
PZ Trend Trading
PZ TRADING SLU
4.8 (5)
O Trend Trading é um indicador projetado para lucrar o máximo possível com as tendências que ocorrem no mercado, cronometrando retrocessos e rupturas. Ele encontra oportunidades de negociação analisando o que o preço está fazendo durante as tendências estabelecidas. [ Guia de instalação | Guia de atualização | Solução de problemas | FAQ | Todos os produtos ] Negocie mercados financeiros com confiança e eficiência Lucre com as tendências estabelecidas sem ser chicoteado Reconhecer retrocessos
Step into the world of Forex trading with confidence, clarity, and precision using   Gold Indicator   a next-generation tool engineered to take your trading performance to the next level. Whether you’re a seasoned professional or just beginning your journey in the currency markets, Gold Indicator equips you with powerful insights and help you trade smarter, not harder. Built on the proven synergy of three advanced indicators, Gold Indicator focuses exclusively on medium and long-term trends eli
MetaBands M4
Vahidreza Heidar Gholami
3.5 (6)
MetaBands utiliza algoritmos poderosos e únicos para desenhar canais e detectar tendências, a fim de fornecer aos traders pontos potenciais para entrar e sair de negociações. É um indicador de canal mais um indicador de tendência poderoso. Inclui diferentes tipos de canais que podem ser mesclados para criar novos canais simplesmente usando os parâmetros de entrada. O MetaBands usa todos os tipos de alertas para notificar os usuários sobre eventos de mercado. Recursos Suporta a maioria dos algori
Current event:  https://c.mql5.com/1/326/A2SR2025_NoMusic.gif A. O que é A2SR ?   * É um indicador técnico importante (sem repintura, sem atraso). -- Orientação : -- em https://www.mql5.com/en/blogs/post/734748/page4#comment_16532516 -- e https://www.mql5.com/en/users/yohana/blog A2SR tem uma técnica especial para determinar os níveis de Suporte (demanda) e Resistência (oferta). Ao contrário da maneira comum que vimos na rede, o A2SR tem um conceito original na determinação dos níveis reais
Versão Swing M30/H1/H4 disponível Quer pegar os grandes movimentos? Gold Signal Swing Pro (M30/H1/H4). Alvo: $20-$80+ por operação. https://www.mql5.com/en/market/product/177643 KURAMA GOLD SIGNAL PRO (MT4) — Sistema Completo de Trading XAUUSD com Filtro de 7 Camadas, TP/SL Automático e Pontuação de Qualidade SEM REPINTURA. SEM REDESENHO. SEM ATRASO. Cada sinal é permanente. O que você vê é o que recebe. BÔNUS: Compre a licença vitalícia e receba AI
BTMM State Engine Pro is a MetaTrader 4 indicator for traders who use the Beat The Market Maker approach: Asian session context, kill zone timing, level progression, peak formation detection, and a multi-pair scanner from a single chart. It combines cycle state logic with a built-in scanner dashboard so you do not need the same tool on many charts at once. What it does Draws the Asian session range; session times can follow broker server offset or be set in inputs. Tracks level progression (L
Advanced Supply Demand
Bernhard Schweigert
4.91 (300)
Atualmente com 40% de desconto! A melhor solução para qualquer Trader Novato ou especialista! Este indicador é uma ferramenta de negociação exclusiva, de alta qualidade e acessível porque incorporamos uma série de recursos proprietários e uma nova fórmula. Com esta atualização, você poderá mostrar fusos horários duplos. Você não só será capaz de mostrar um TF mais alto, mas também mostrar ambos, o TF do gráfico, MAIS o TF mais alto: MOSTRANDO ZONAS ANINHADAS. Todos os traders de Oferta e Demanda
Price & Time Market Structure Indicator A professional market structure tool that analyzes waves through both price and time — not price alone. Main Description NeoWave PRO is a professional market structure indicator for MetaTrader 4 designed for traders who want to move beyond traditional one-dimensional wave tools such as ZigZag, swing indicators, and basic high/low systems. Most wave indicators analyze only one thing: Price. But a real market wave is not only a price movement. A true wave de
RFI levels PRO
Roman Podpora
5 (1)
O indicador mostra com precisão os pontos de reversão e as zonas de retorno de preço onde o   Principais players . Você identifica onde novas tendências estão se formando e toma decisões com máxima precisão, mantendo o controle sobre cada negociação. VERSION MT5     -     Revela seu potencial máximo quando combinado com o indicador   TREND LINES PRO. O que o indicador mostra: Estruturas de reversão e níveis de reversão com ativação no início de uma nova tendência. Exibição dos níveis de   TAKE
Quant Direction
Georgios Kalomoiropoulos
Quant Direction é uma ferramenta de análise de mercado tridimensional. Ela oferece uma análise de mercado totalmente objetiva, baseada em algoritmos, que calcula simultaneamente desvios percentuais precisos em diversos parâmetros. Desenvolvido com ferramentas avançadas de modelagem com inteligência artificial e rigorosamente testado, o algoritmo foi projetado para interpretar o mercado com precisão sem precedentes. Você pode analisar qualquer par de moedas ou instrumento financeiro em sua plataf
MonsterDash Harmonic Indicator is a harmonic pattern dashboard. It recognizes all major patterns. MonsterDash is a dashboard that displays all detected patterns for all symbols and (almost) all timeframes in sortable and scrollable format. Users can add their own user defined patterns . MonsterDash can open and update charts with the pattern found. Settings MonsterDash's default settings are good enough most of the time. Feel free to fine tune them to your needs. The color settings are for thos
ACTUALMENTE COM 40% DE DESCONTO A melhor solução para qualquer novato ou comerciante especializado! Este Indicador é uma ferramenta comercial única, de alta qualidade e acessível, porque incorporámos uma série de características proprietárias e uma nova fórmula. Com apenas UM gráfico, pode ler a força da moeda para 28 pares de Forex! Imagine como a sua negociação irá melhorar porque é capaz de apontar o ponto exacto do gatilho de uma nova tendência ou oportunidade de escalada? Manual do util
Bull versus Bear
Mohamed Hassan
4.5 (18)
Send us a message after your purchase to receive more information on how to get your  BONUS  for FREE  that works in great combination with Bull vs Bear ! Bull versus Bear is an easy-to-use Forex indicator that gives traders clear and accurate signals based on clear trend retests . Forget about lagging indicators or staring at charts for hours because  Bull vs Bear provides real-time entries with no lag and no repaint, so you can trade with confidence. Bull vs Bear  helps you enter trades during
The Propfolio Master Suite is the ultimate all-in-one analytical workstation for professional traders. Combining the power of the Beat The Market Maker (BTMM) methodology, Smart Money Concepts (SND/Liquidity), and Advanced Volume Profile, this suite replaces multiple different indicators with one optimized engine. Monitor up to 14 pairs simultaneously from a single chart, instantly identify market cycles, and seamlessly map institutional footprints with the click of a button. The Command Center
Introduction Harmonic Patterns are best used to predict potential turning point. Traditionally, Harmonic Pattern was identified manually connecting peaks and troughs points in the chart. Manual harmonic pattern detection is painfully tedious and not suitable for everyone. You are often exposed under subjective pattern identification with manual pattern detection. To avoid these limitations, Harmonic Pattern Plus was designed to automate your harmonic pattern detection process. The functionality
KuKl
IGOR KIRIANEN
The indicator is built on a non-standard Zig Zag, it draws accumulations after which if the price leaves this zone and a test of this zone occurs, then a sound signal is given and an arrow appears - after the test candle closes.The indicator does not redraw its signals, it is very easy to use, there are only three settings 1- this is the zig zag parameter 2- this is the minimum price exit from the zone 3- this is the maximum price exit from the zone. The lower the parameter for Zig Zag, the more
Gold Venamax MT4
Sergei Linskii
3 (2)
Gold Venamax   - este é o melhor indicador técnico de ações. O algoritmo do indicador analisa o movimento do preço de um ativo e reflete a volatilidade e as zonas de entrada potenciais. Recursos do indicador: Este é um super indicador com Magic e dois blocos de setas de tendência para uma negociação confortável e lucrativa. O botão vermelho para alternar blocos é exibido no gráfico. Magic é definido nas configurações do indicador, para que você possa instalar o indicador em dois gráficos exibin
NAM Order Blocks
NAM TECH GROUP, CORP.
3.67 (3)
Indicador de detecção de blocos de pedidos de multi-timeframe MT4. Características - Totalmente personalizável no painel de controle do gráfico, fornece interação completa. - Oculte e mostre o painel de controle onde quiser. - Detectar OBs em vários períodos de tempo. - Selecione a quantidade de OBs para exibir. - Interface de usuário de OBs diferente. - Filtros diferentes em OBs. - Alerta de proximidade OB. - Linhas ADR de alta e baixa. - Serviço de notificação (alertas de tela | not
PZ Harmonacci Patterns
PZ TRADING SLU
3.17 (6)
Este é sem dúvida o indicador de reconhecimento automático de formação de preço harmônico mais completo que você pode encontrar para a MetaTrader Platform. Ele detecta 19 padrões diferentes, leva as projeções de Fibonacci tão a sério quanto você, exibe a Zona de Reversão Potencial (PRZ) e encontra níveis adequados de stop loss e take-profit. [ Guia de instalação | Guia de atualização | Solução de problemas | FAQ | Todos os produtos ] Detecta 19 formações harmônicas de preços diferentes Traça
Atomic Analyst
Issam Kassas
5 (7)
Este produto foi atualizado para o mercado de 2026 e otimizado para as versões mais recentes do MT5. AVISO DE ATUALIZAÇÃO DE PREÇO: Atomic Analyst está atualmente disponível por $99 . O preço aumentará para $199 após as próximas 30 compras . OFERTA ESPECIAL: Após comprar o Atomic Analyst, envie-me uma mensagem privada para receber o Smart Universal EA GRÁTIS e transformar seus sinais do Atomic Analyst em operações automatizadas. Atomic Analyst é um indicador de trading de Price Action sem repa
Sinal de tendência GoldRush Arrow O indicador Sinal de tendência GoldRush Arrow fornece uma análise precisa e em tempo real das tendências, adaptada para scalpers de alta velocidade e curto prazo em XAU/USD. Criada especificamente para o intervalo de tempo de 1 minuto, esta ferramenta exibe setas direcionais para pontos de entrada claros, permitindo que os scalpers naveguem em condições de mercado voláteis com confiança. O indicador consiste em setas de alerta PRIMÁRIAS e SECUNDÁRIAS. Os sin
Mais do autor
The trading system is designed to work with gold on time periods: 30M, 1H. The indicator allows you to adjust to the market situation. Parameters for 1H :   PERIOD=9F ,   FILTER=300 .   Parameters for  30M :   PERIOD=22B ,   FILTER=450 .     A small adjustment to a specific broker is allowed .   If you change the amount of history displayed, you may also need to adjust the parameters. The indicator is not redrawn.     "Gold n XAU" uses different rules for entering a trade and different rules
Length Movement
Pavel Verveyko
5 (1)
Measures the length of the selected movement in points, shows the duration of the movement, as well as the speed of movement.   Outputs the average value of each dimension. It is designed to calculate the expected target based on typical market movements. The intended goal will provide information about the ratio of the stop size to the possible profit and will allow you not to open positions with a small expected profit. It will also help you determine the point at which it is more logical to c
Ichimoku Map (instant look at the markets) - built on the basis of the legendary Ichimoku Kinko Hyo indicator. The task of the Ichimoku Map is to provide information about the market strength on the selected time periods and instruments, from the point of view of the Ichimoku indicator. The indicator displays 7 degrees of buy signal strength and 7 degrees of sell signal strength. The stronger the trend, the brighter the signal rectangle in the table. The table can be dragged with the mouse. The
Turn
Pavel Verveyko
The indicator shows the market turning points (entry points). Reversals allow you to track rebound/breakout/testing from the reverse side of the lines of graphical analysis or indicators. Reversals can be an independent signal. The indicator allows you to determine reversals taking into account the trend and without it. You can choose a different period for the movement preceding the reversal, as well as the volatility coefficient. When plotting reversals, the indicator takes into account volati
The indicator allows you to quickly switch from one instrument to another, from one time period to another using the keyboard or buttons on the monitor. Each command can be assigned a hot key from 0-9, a-Z (case-insensitive) and VK_OEM_COMMA ("<" on the keyboard) and VK_OEM_PERIOD (">" on the keyboard). This can help you to operate the maximum number of instruments that are available at your broker, analyze more instruments/periods in less time. This product cannot be tested in the tester , beca
Ratio TP SL
Pavel Verveyko
5 (1)
This indicator allows you to measure the profitability of each specific transaction (the ratio of Stop and Profit). The indicator allows you to adjust the ratio by step size and number of steps. You can build an unlimited number of ratios to compare the risks from different movements. Note: in MT4, the number of horizontal lines in a single ratio cannot exceed 32. Building a line : click the " Ratio " button and draw a line (mouse click - the first point of the line, where the mouse is release
Corporate Report
Pavel Verveyko
5 (1)
The script displays info about the share's corporate reports and dividends. The data is downloaded from   investing.com : Report date Profit per share (EPS) Revenue Market capitalization Amount of dividends Date of payment of dividends Dividend income The product cannot be tested in the tester (since it is not possible to receive data from the Internet). Before launching:  Add 2   URL   https://ru.investing.com/earnings-calendar/Service/getCalendarFilteredData  and   https://ru.investing.com/di
Channel FTF
Pavel Verveyko
The Envelopes indicator determines the presence of a trend or flat. It has 3 types of signals, shows the probable retracement levels and levels of the possible targets. The Fibonacci coefficients are used in the indicator's calculations. Signals (generated when touching the lines or rebounding from lines): Trend - the middle line of the Envelopes has a distinct inclination; the lines below the channel's middle line are used for buy trades, the lines above the middle line and the middle line itse
Mr Big
Pavel Verveyko
The indicator shows and highlights the chart candles, which are formed as a result of large players entering the market in large volumes. Such candles can also be formed after achieving a certainty on the market, when most of the participants hold positions in the same direction. The movement is likely to continue in that direction after such candles. The indicator highlights the significant candles from the existing ones on the chart; The indicator allows identifying the trends based on candles
Splash
Pavel Verveyko
The indicator identifies the most suitable moment for entering the market in terms of market volatility, when the market has the strength to move (the signal is indicated by an arrow under the candle). For each of the signals, the presence of trends on the current and higher timeframes is determined, so that the signal is in the direction of the majority of positions opened on the market (denoted near the signal by abbreviations of timeframes with a trend present). The signal appears after the c
The indicator displays the key support and resistance levels on the chart. The significance of these levels lies in that the price may reverse or strengthen the movement when passing such levels, since they are formed as a consequence of the natural reaction of market participants to the price movement, depending on which positions they occupied or did not have time to occupy. The psychology of the level occurrence: there always those who bought, sold, hesitated to enter or exited early. If the
This indicator is a multitimeframe trading strategy. It has the levels for stop loss, take profit and entry point. The order level can also be set manually. The indicator uses the regularity of the market, which manifests itself on all instruments, and does not require adjustment of the parameters. The strategy uses a proprietary approach to determining: trend, volatility, hierarchy of timeframe significance, the size of the history period (the number of candles), which is important for making a
Trend Sync
Pavel Verveyko
5 (1)
The indicator shows the trend of 3 timeframes: higher timeframe; medium timeframe; smaller (current) timeframe, where the indicator is running. The indicator should be launched on a chart with a timeframe smaller than the higher and medium ones. The idea is to use the trend strength when opening positions. Combination of 3 timeframes (smaller, medium, higher) allows the trend to be followed at all levels of the instrument. The higher timeframes are used for calculations. Therefore, sudden change
The indicator detects important peaks and troughs (extremes) on the chart. These points can be used to plot support/resistance levels and trend lines, as well as any other graphical analysis. These points can serve as reference points for setting trading orders. The indicator does not redraw . Settings: Size_History  - the size of the calculated history. Num_Candles_Right  - number of candles to the right of the peak or trough. Num_Candles_Left  - number of candles to the left of the peak or
Key Volumes
Pavel Verveyko
1 (1)
The indicator shows key volumes confirmed by the price movement. The indicator allows you to analyze volumes in the direction, frequency of occurrence, and their value. There are 2 modes of operation: taking into account the trend and not taking into account the trend (if the parameter Period_Trend = 0, then the trend is not taken into account; if the parameter Period_Trend is greater than zero, then the trend is taken into account in volumes). The indicator does not redraw . Settings History_S
This trading system is based on market impulses of varying complexity.   To generate a signal, the indicator uses the moments when the direction of the pulse and the necessary section of the trend coincide. The indicator also takes into account the current market volatility. Stop_loss tags can be set with the parameter "0" or "1", then Stop_Loss will take into account market volatility.   Take_Profit tags can be set with the parameter "0", then Take_Profit will take into account market volatil
Indexes
Pavel Verveyko
The stocks that make up the index are one of the drivers of the movement. Analyzing the financial performance of all elements of the index, we can assume further development of the situation. The program (script) displays corporate reports of shares that are part of the index selected in the settings.   "Indexes" cannot be tested in the tester (since there is no way to get information from the Internet). Information is downloaded from the site investing.com: Report Date Earnings per share (E
Fibo World
Pavel Verveyko
The indicator builds a graphical analysis based on the Fibonacci theory. Fibo Fan is used for the analysis of the impulses and corrections of the movement. Reversal lines (2 lines at the base of the Fibonacci fan) are used to analyze the direction of movements. The indicator displays the of 4 the target line in each direction. The indicator takes into account market volatility. If the price is above the reversal lines, it makes sense to consider buying, if lower, then selling. You can open posi
The indicator determines the state of the market: trend or flat. The state of the market is determined by taking into account volatility. The flat (trading corridor)is displayed in yellow. The green color shows the upward trend. The red color shows the downward trend. The height of the label corresponds to the volatility in the market. The indicator does not redraw . Settings History_Size   - the amount of history for calculation. Period_Candles  - the number of candles to calculate the indicat
The indicator plots flexible support and resistance levels (dots). A special phase of movement is used for construction. Levels are formed dynamically, that is, each new candle can continue the level or complete it. The level can provide resistance or support to the price even where it is no longer there. Also, support and resistance levels can change roles. The importance of levels is affected by: the amount of time the level is formed and the number of touches. The significance of these lev
The indicator is a trading system for short-term trading. Scalper Assistant helps to determine the direction of the transaction, and also shows the entry and exit points. The indicator draws two lines (possible points for opening positions). At the moment of the breakdown of the upper line up (and when all trading conditions are met), an up arrow appears (a buy signal), as well as 2 goals. At the moment of the breakdown of the lower line down (and when all trading conditions are met), a down ar
Gold n XAU
Pavel Verveyko
The trading system is designed to work with gold on time periods: 30M, 1H. The indicator allows you to adjust to the market situation. Parameters for 1H :   PERIOD=9F ,   FILTER=300 .   Parameters for  30M :   PERIOD=22B ,   FILTER=450 .   A small adjustment to a specific broker is allowed .   If you change the amount of history displayed, you may also need to adjust the parameters. The indicator is not redrawn.     "Gold n XAU" uses different rules for entering a trade and different rules fo
The indicator builds "psychological levels": levels of round numbers and intermediate levels of round numbers. Round numbers play an important role in forming support and resistance levels. There is a pattern in which the decline or growth of the price can stop at round numbers. The level whose price ends at 0 is the level of a round number of the first order. Intermediate level, this is the level between two round levels, for example, between 10 and 20 this is level 15. In the " Num_Zeros "
Ichimoku Map (instant look at the markets) - built on the basis of the legendary Ichimoku Kinko Hyo indicator. The task of the Ichimoku Map is to provide information about the market strength on the selected time periods and instruments, from the point of view of the Ichimoku indicator. The indicator displays 7 degrees of buy signal strength and 7 degrees of sell signal strength. The stronger the trend, the brighter the signal rectangle in the table. The table can be dragged with the mouse. The
The indicator displays a stock chart of a non-standard type, in which the price and time have the same value. The usual chart of Japanese candlesticks does not take into account all the information that the time analysis can give. Renko charts do not use all the information that price can give in relation to time. The "Chart Price and Time" indicator takes into account price and time equally and shows the predominance of price or time. Taking into account price and time equally gives an idea
The indicator tracks sharp volatility (moments when the market has shown increased activity and movement may occur), on the selected instruments and time periods. The information is displayed as colored rectangles. Thus, it is possible to assess at a glance which tool should be given priority attention. The indicator will be useful for scalpers when they need a quick reaction or for traders working with a large number of instruments. The indicator does not redraw. The indicator displays 8 degree
The Alert Creator indicator is designed to create alerts for selected conditions. You can select one or several indicators for the notification. If several conditions are selected, the alert is triggered when all the selected conditions are met. The signals can be configured separately for buying and separately for selling. Example, a buy alert: the closing price is above the moving average, the RSI is below 20. (In this example, 2 indicators are used to generate an alert: MA and RSI) At the
The indicator determines the strength of the trend and its possible reversal points, based on the author's arithmetic approach . Each new peak or trough is a trend development. Such peaks and troughs are numbered so that the strength of the trend development can be seen. Attempts to change the trend are also numbered. This gives an understanding of a possible change in the direction of the trend. Indicator signals are generated when trying to change the trend . In the settings, it is possible
O indicador desenha níveis potenciais que podem se tornar níveis significativos de suporte e resistência no futuro. Quanto maior a linha, maior a probabilidade de uma reversão de preço ou aumento do movimento de preços após a quebra desse nível. Com a diminuição da probabilidade de formação de nível, o comprimento da linha é reduzido. O indicador "Level Predictor" não requer ajustes. Nas configurações, você pode alterar o design do indicador. O botão " Line_Length " é exibido no gráfico par
The indicator defines a trading corridor, a flat market, and corrections. Allows you to compare the significance of different flat and trend areas (by time of existence and by volatility). This makes it possible to assess the market cycle and its mood at a glance. That is, how long does the flat last on average, and how long is the trend and what kind of volatility they have in points. As a rule, the longer the flat lasts, the more likely it is to accumulate the potential for a strong movem
Filtro:
vincent de paul kouakou kouassi
324
vincent de paul kouakou kouassi 2022.07.04 21:51 
 

very poor indicator, gives very bad signals

Pavel Verveyko
9702
Resposta do desenvolvedor Pavel Verveyko 2022.07.04 22:16
Hello, I am very sorry that you did not like the indicator. I draw your attention to the fact that the indicator does not give signals, it draws lines that the price sees, the trader independently decides on the position to be opened (its direction, number of lots, etc.). In general, the trader himself determines the graphical strategy by which he will trade. Success in trading depends on many factors, I wish you success.
krisnara123
2190
krisnara123 2022.02.03 12:55 
 

This indicator really simplifies trading .It helps traders to wait and pickup the sweet spot choice entries. Sometimes Trendlines turn out be more powerful than horizontal lines. Pavel is always open to receive some feature requests.

Wan Suryolaksono
1946
Wan Suryolaksono 2022.02.01 12:05 
 

O usuário não deixou nenhum comentário para sua avaliação

Responder ao comentário