Level Predictor

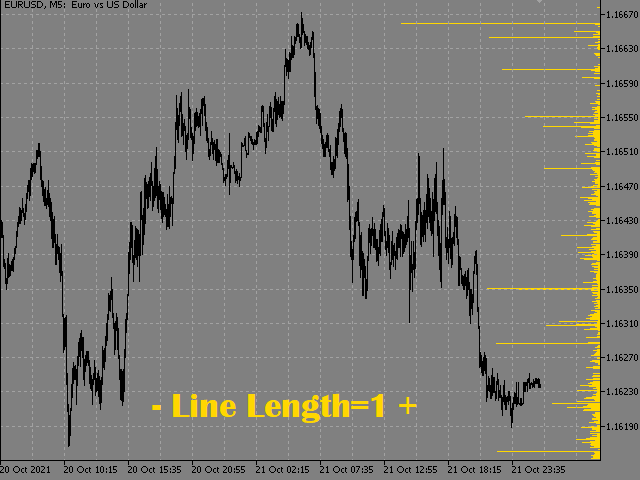
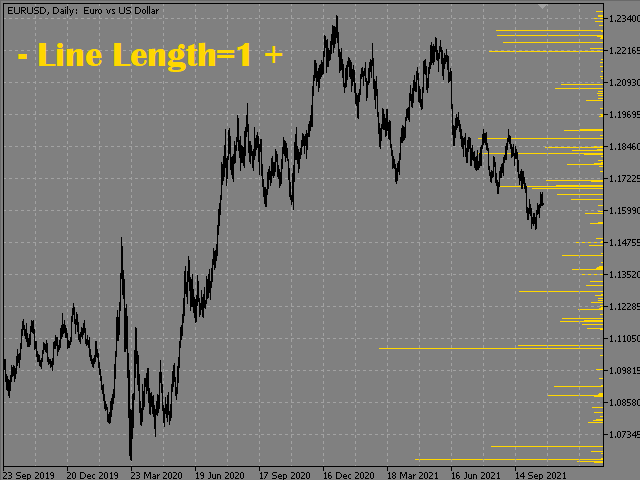
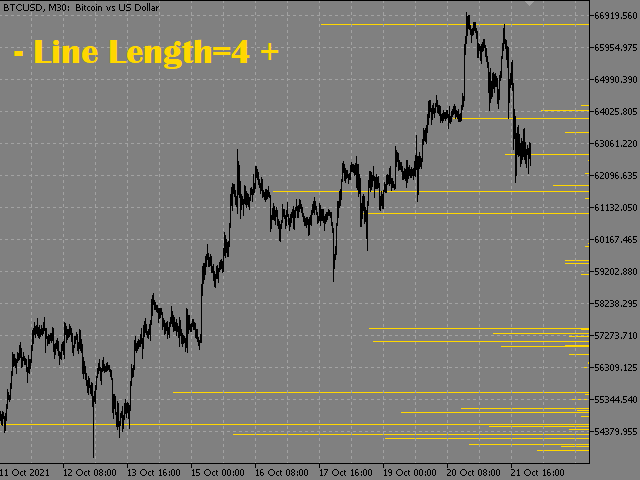
O indicador desenha níveis potenciais que podem se tornar níveis significativos de suporte e resistência no futuro.

Quanto maior a linha, maior a probabilidade de uma reversão de preço ou aumento do movimento de preços após a quebra desse nível.
Com a diminuição da probabilidade de formação de nível, o comprimento da linha é reduzido.

O indicador "Level Predictor" não requer ajustes.

Nas configurações, você pode alterar o design do indicador.

O botão "Line_Length" é exibido no gráfico para ajustar o comprimento das linhas (para facilitar a percepção do indicador).
A configuração "Line_Length" selecionada é salva para cada período de tempo e ferramenta.
O botão "Line_Length" pode ser arrastado com o mouse.
Quando você passa o mouse sobre a borda esquerda do botão, ele é destacado com a cor selecionada e, quando pressionado, o número é reduzido e as linhas do indicador são encurtadas.
Quando você passa o mouse sobre a borda direita do botão, ele é destacado com a cor selecionada e, quando pressionado, o número aumenta e as linhas do indicador são alongadas.
    Produtos recomendados
    "Impulses and Corrections 4" is created to help traders navigate the market situation. The indicator shows multi-time frame upward and downward "Impulses" of price movements. These impulses are the basis for determining the "Base" , which is composed of zones of corrections of price movements, as well as "Potential" zones for possible scenarios of price movement. Up and down impulses are determined based on a modified formula of Bill Williams' "Fractals" indicator. The last impulse is always "U
    O indicador Crypto_Forex "Auto FIBO Pro" é uma ótima ferramenta auxiliar na negociação! - O indicador calcula e coloca automaticamente no gráfico os níveis de Fibonacci e as linhas de tendência locais (cor vermelha). - Os níveis de Fibonacci indicam áreas-chave onde o preço pode reverter. - Os níveis mais importantes são 23,6%, 38,2%, 50% e 61,8%. - Pode utilizá-lo para scalping de reversão ou para negociação de grelha de zona. - Existem muitas oportunidades para melhorar o seu sistema atual u
    RSI Speed mp
    DMITRII GRIDASOV
    Indicador Crypto_Forex "RSI SPEED" para MT4 - ótima ferramenta preditiva, sem necessidade de repintura. - O cálculo deste indicador é baseado em equações da física. O RSI SPEED é a primeira derivada do próprio RSI. - O RSI SPEED é bom para entradas de scalping na direção da tendência principal. - Use-o em combinação com um indicador de tendência adequado, por exemplo, HTF MA (como nas imagens). - O indicador RSI SPEED mostra a rapidez com que o próprio RSI muda de direção - ele é muito sensíve
    Fibonacci recontratar e extensão linha de desenho ferramenta Fibonacci recontratar e estender a ferramenta de desenho de linha para a plataforma MT4 é adequado para comerciantes que usam método de negociação de pontos e negociação de secções douradas Vantagens: Não há linha extra, não há linhagem muito longa, e é fácil observar e encontrar oportunidades de negociação Versão experimental: https://www.mql5.com/zh/market/product/35884 Principais funções: 1. Podem ser desenhados diretamente vári
    Daily Candle Predictor é um indicador que prevê o preço de fechamento de uma vela. O indicador destina-se principalmente ao uso em gráficos D1. Este indicador é adequado tanto para negociação forex tradicional quanto para negociação de opções binárias. O indicador pode ser usado como um sistema de negociação autônomo ou pode atuar como um complemento ao seu sistema de negociação existente. Este indicador analisa a vela atual, calculando certos fatores de força dentro do próprio corpo da vela, be
    Super Reversal Pattern
    Parfait Mujinga Ndalika
    Super Reversal Pattern Indicator Unlock the power of advanced pattern recognition with our Super Reversal Pattern Indicator. Designed for traders seeking precision and reliability, this indicator identifies one of the most effective reversal patterns in technical analysis, offering a significant edge in your trading strategy. Key Features: Non-Repainting Accuracy: Enjoy the confidence of non-repainting technology. Once a Super Reversal Pattern is detected, it remains static, providing consiste
    Gold Phoenix
    Yaroslav Varankin
    The perfect tool for Scalng in the Forex markets You can trade both from signal to signal and using take profit  The algorithm does not use Zigzag!  No redrawing!  This is a channel instrument that uses a moving average as a filter. Moving Average  There are 2 parameters for the settings Ma Period = 5 period Moving Average  Channel 1.0 distance of channel lines from the chart Price Signal Filter - calculation of signal opening and filter There is a complete set of Alert There is a multi-timefram
    Cosmic Diviner X Planet
    Olena Kondratenko
    4 (2)
    This unique multi-currency strategy simultaneously determines the strength of trends and market entry points, visualizing this using histograms on the chart. The indicator is optimally adapted for trading on the timeframes М5, М15, М30, Н1. For the convenience of users, the indicator renders the entry point (in the form of an arrow), recommended take profit levels (TP1, TP2 with text labels) and the recommended Stop Loss level. The take profit levels (TP1, TP2) are automatically calculated for
    Noize Absorption Index MT4
    Ekaterina Saltykova
    5 (1)
    Noize Absorption Index - is the manual trading system that measures the difference of pressure between bears forces and bulls forces. Green line - is a noize free index that showing curent situation. Zero value of index shows totally choppy/flat market.Values above zero level shows how powerfull bullish wave is and values below zero measures bearish forces.Up arrow appears on bearish market when it's ready to reverse, dn arrow appears on weak bullish market, as a result of reverse expectation. S
    PZ Harmonacci Patterns
    PZ TRADING SLU
    3.17 (6)
    Este é sem dúvida o indicador de reconhecimento automático de formação de preço harmônico mais completo que você pode encontrar para a MetaTrader Platform. Ele detecta 19 padrões diferentes, leva as projeções de Fibonacci tão a sério quanto você, exibe a Zona de Reversão Potencial (PRZ) e encontra níveis adequados de stop loss e take-profit. [ Guia de instalação | Guia de atualização | Solução de problemas | FAQ | Todos os produtos ] Detecta 19 formações harmônicas de preços diferentes Traça
    O indicador SMC Venom Model BPR é uma ferramenta profissional para os traders que trabalham com o conceito Smart Money (SMC). Identifica automaticamente dois padrões principais no gráfico de preços: FVG   (Fair Value Gap) é uma combinação de três velas, em que existe um gap entre a primeira e a terceira velas. Forma uma zona entre níveis onde não há suporte de volume, o que geralmente leva a uma correção de preço. BPR   (Balanced Price Range) é uma combinação de dois padrões FVG que formam uma “
    Gold Bricks FX USES THE TREND WAVE INDICATOR AND IT CAN IDENTIFY THE BEGINNING AND THE END OF A NEW WAVE TREND MOVEMENT. AS AN OSCILLATOR, THE INDICATOR IDENTIFIES THE OVERBOUGHT AND OVERSOLD ZONES. IT WORKS GREAT TO CATCH THE SHORT TERM PRICE REVERSALS AND USES A MARTINGALE STRATEGY TO CLOSE ALL TRADES IN PROFIT. USE DEFAULT SETTINGS ON H1 OR HIGHER TIME FRAME ON ANY PAIR FOR MORE ACCURATE TRADES WHY THIS EA : Smart entries calculated by 4 great strategies The EA can be run on even a $300
    Pattern 123
    Pavel Verveyko
    "Pattern 123" is an indicator-a trading system built on a popular pattern, pattern 123. This is the moment when we expect a reversal on the older trend and enter the continuation of the small trend, its 3rd impulse. The indicator displays signals and markings on an open chart. You can enable/disable graphical constructions in the settings. The indicator has a built-in notification system (email, mobile terminal, standard terminal alert). "Pattern 123" has a table that displays signals from sele
    The Th3Eng PipFinite indicator is based on a very excellent analysis of the right trend direction with perfect custom algorithms. It show the true direction and the best point to start trading. With StopLoss point and Three Take Profit points. Also it show the right pivot of the price and small points to order to replace the dynamic support and resistance channel, Which surrounds the price. And Finally it draws a very helpful Box on the left side on the chart includes (take profits and Stop loss
    VR Cub
    Vladimir Pastushak
    VR Cub é um indicador para obter pontos de entrada de alta qualidade. O indicador foi desenvolvido para facilitar cálculos matemáticos e simplificar a busca por pontos de entrada em uma posição. A estratégia de negociação para a qual o indicador foi escrito tem provado a sua eficácia há muitos anos. A simplicidade da estratégia de negociação é a sua grande vantagem, o que permite que até mesmo os comerciantes novatos negociem com sucesso com ela. VR Cub calcula os pontos de abertura de posição e
    Trade with Gann on your side!! MASTER CIRCLE 360 CIRCLE CHART, originally created by Gann admitted that this is “The Mother of all charts”. It is one of the last studies that this great trader left for us. The numeric tab le is apparently quite simple like all the tables and is based on square numbers, the SQUARE OF 12 and is by evolution, one of the most important square numbers. Here we can find CYCLE, PRICE AND TIME thanks to angles and grades, to show past and future support and resistance.
    PZ Support Resistance
    PZ TRADING SLU
    3.33 (3)
    Cansado de traçar linhas de suporte e resistência? A Resistência de suporte é um indicador de período múltiplo que detecta e plota automaticamente linhas de suporte e resistência no gráfico com um toque muito interessante: conforme os níveis de preços são testados ao longo do tempo e sua importância aumenta, as linhas se tornam mais espessas e mais escuras. [ Guia de instalação | Guia de atualização | Solução de problemas | FAQ | Todos os produtos ] Melhore sua análise técnica da noite para o d
    Atomic Analyst
    Issam Kassas
    5 (5)
    Primeiramente, vale ressaltar que este Indicador de Negociação não repinta, não redesenha e não apresenta atrasos, tornando-o ideal tanto para negociação manual quanto automatizada. Manual do utilizador: configurações, entradas e estratégia. O Analista Atômico é um Indicador de Ação de Preço PA que utiliza a força e o momentum do preço para encontrar uma vantagem melhor no mercado. Equipado com filtros avançados que ajudam a remover ruídos e sinais falsos, e aumentam o potencial de negociação.
    Point61 Indicator
    Evgeniy Machok
    5 (1)
    The Point61 indicator is the result of many years of monitoring of price behavior of currency pairs and metals. It is not a secret, that in times of uncertainty, traders are looking for possible levels of support and resistance - the point, where price should stop its movement. There are 2 possible scenarios at these points: 1. Reverse (correction) to the opposite direction; 2. Breakthrough to continue movement. Very often these points are used to set stop orders - TakeProfit or StopLoss
    Infinity Trend Pro
    Yaroslav Varankin
    1 (1)
    This is a trend indicator without redrawing Developed instead of the binary options strategy (by the color of the Martingale candlestick) Also works well in forex trading When to open trades (binary options) A signal will appear in the place with a candle signaling the current candle It is recommended to open a deal for one candle of the current timeframe M1 and M5 When a blue dot appears, open a deal up When a red dot appears, open a trade down. How to open trades on Forex. When a signal is rec
    Doesn't redraw! "Xhmaster formula forex indicator" - a new oscillator indicator with regression mathematical modeling of free numerical series. This indicator is 60% more accurate in identifying price reversal points compared to the standard "Xmaster formula" indicator, and it is less sensitive to small price fluctuations. "Xhmaster formula forex indicator" is a unique and advanced tool designed specifically for traders in the Forex market. It provides traders with excellent opportunities for su
    Indicador Crypto_Forex "Morning Star pattern" para MT4. - O indicador "Morning Star pattern" é um indicador muito poderoso para negociação de Price Action: sem repintura, sem atraso. - O indicador detecta padrões Morning Star otimistas no gráfico: sinal de seta azul no gráfico (veja as imagens). - Com alertas para PC, celular e e-mail. - Também seu irmão - o indicador bearish "Evening Star pattern" está disponível (siga o link abaixo). - O indicador "Morning Star pattern" é excelente para comb
    Blahtech Market Profile
    Blahtech Limited
    4.53 (15)
    Was: $249  Now: $99   Market Profile defines a number of day types that can help the trader to determine market behaviour. A key feature is the Value Area, representing the range of price action where 70% of trading took place. Understanding the Value Area can give traders valuable insight into market direction and establish the higher odds trade. It is an excellent addition to any system you may be using. Blahtech Limited presents their Market Profile indicator for the MetaTrader community. Ins
    This is the FXTraderariel-TakeProfit - Stop Loss Indicator . It provides you 3 potential Take Profits and 1 Stop Loss. These potential targets are computed based on several methods . The indicator can be used on every time frame, but we advise to use it on H1, H4 and D1. Especially if you are a novice trader. Pro Traders can also you use it for scalping in smaller time frames (M1, M5 and M15). This indicator is not a complete trading system. It doesn't provide you a Signal nor can predict the m
    Rainbow Price Visualizer v1.21 See where the market really breathes. Turns your MT4 chart into an ultra-precise heatmap that highlights price zones favored by big players. Why it matters 300 price levels at 0.2‑pip resolution — microscopic detail. 8 visual themes (Rainbow, Fire, Ocean…) for instant readibility. Smart opacity: low noise fades, real zones pop. Lightweight rendering with automatic cleanup. Fully customizable: saturation, opacity, resolution, history depth. Bands project into the f
    Trend Ray
    Andriy Sydoruk
    The indicator shows the potential trend direction by cyclical-wave dependence. Thus, all the rays of the intersection will be optimal rays, in the direction of which the price is expected to move, taking into account the indicator period. Rays can be used as a direction for potential market movement. But we must not forget that the approach must be comprehensive, the indicator signals require additional information to enter the market.
    This is an arrow indicator without a future function,developed based on the most advanced profit trading algorithms.It has the most innovative and advanced dual trend analysis module, as well as the latest and highly effective market trend prediction algorithm.Trends are your friends, and following larger trends can earn the maximum profit in foreign exchange. This indicator helps traders identify current trends and track them. Someone once made a profit of 10 times in a week by relying on it.No
    Volume Profile Sniper v11. 1 - ferramenta abrangente de análise de mercado Abordagem profissional ao comércio O Volume Profile Sniper v11.1 combina mais de 15 filtros-chave em um único indicador, fornecendo sinais claros com base em uma avaliação abrangente da situação do mercado. Principais recursos Análise do desequilíbrio volumétrico-o algoritmo calcula a proporção de compradores e vendedores em cada vela, sinalizando a predominância de uma das partes (limite ajustável de 50% a 90%). Filtr
    This indicator is a must have tool that scans the active chart for candlestick patterns. It labels each bar according the candlestick pattern(s) that it finds enabling you to more easily analyze price action and be more informed about your trading decision. There are 103 common and uncommon possible patterns plus 6 new patterns based on research that the indicator can identify. If a candlestick(s) meets the requirements for multiple patterns, the bar will be labeled with up to 4 patterns names f
    Barbeador de mercado   Cambista de mercado Este indicador faz parte dos sistemas RPTrade Pro Solutions. Market Scalper é um indicador de tendência diária usando Price Action, Dynamic Support e Resistances. Ele foi projetado para ser usado por qualquer pessoa, mesmo o iniciante absoluto na negociação pode usá-lo. NUNCA repinta. As indicações são dadas de perto para perto. Projetado para ser usado sozinho, nenhum outro indicador é necessário. Dá-lhe indicações claras e simples Como funciona Ma
    Os compradores deste produto também adquirem
    Scalper Inside PRO
    Alexey Minkov
    4.74 (69)
    Scalper Inside PRO – Since 2020. An exclusive indicator that utilizes an innovative algorithm to swiftly and accurately determine the market trend. The indicator automatically calculates opening, closing, and profit levels, providing detailed trading statistics. With these features, you can choose the most appropriate trading instrument for the current market conditions. Additionally, you can easily integrate your own arrow indicators into Scalper Inside Pro to quickly evaluate their statistics
    Advanced Supply Demand
    Bernhard Schweigert
    4.91 (299)
    Atualmente com 40% de desconto! A melhor solução para qualquer Trader Novato ou especialista! Este indicador é uma ferramenta de negociação exclusiva, de alta qualidade e acessível porque incorporamos uma série de recursos proprietários e uma nova fórmula. Com esta atualização, você poderá mostrar fusos horários duplos. Você não só será capaz de mostrar um TF mais alto, mas também mostrar ambos, o TF do gráfico, MAIS o TF mais alto: MOSTRANDO ZONAS ANINHADAS. Todos os traders de Oferta e Demanda
    Sinal de tendência GoldRush Arrow O indicador Sinal de tendência GoldRush Arrow fornece uma análise precisa e em tempo real das tendências, adaptada para scalpers de alta velocidade e curto prazo em XAU/USD. Criada especificamente para o intervalo de tempo de 1 minuto, esta ferramenta exibe setas direcionais para pontos de entrada claros, permitindo que os scalpers naveguem em condições de mercado voláteis com confiança. O indicador consiste em setas de alerta PRIMÁRIAS e SECUNDÁRIAS. Os sin
    NAM Divergences
    NAM TECH GROUP, CORP.
    5 (1)
    Indicador de detecção MT4 Multi-timeframe Divergence e Overbougt / Oversold. Características - Totalmente personalizável no painel de controle do gráfico, fornece interação completa. - Oculte e mostre o painel de controle onde quiser. - Informação em tempo real sobre divergências não capitalizadas. - Informações em tempo real sobre situações de sobrecompra / sobrevenda. - Informações em tempo real sobre divergências regulares. - Informações em tempo real sobre divergências ocultas. -
    O indicador " Dynamic Scalper System " foi desenvolvido para o método de scalping, operando dentro de ondas de tendência. Testado nos principais pares de moedas e ouro, é possível a compatibilidade com outros instrumentos de negociação. Fornece sinais para a abertura de posições de curto prazo ao longo da tendência, com suporte adicional para o movimento dos preços. O princípio do indicador: As setas grandes determinam a direção da tendência. Um algoritmo para gerar sinais de scalping sob a fo
    ACTUALMENTE COM 40% DE DESCONTO A melhor solução para qualquer novato ou comerciante especializado! Este Indicador é uma ferramenta comercial única, de alta qualidade e acessível, porque incorporámos uma série de características proprietárias e uma nova fórmula. Com apenas UM gráfico, pode ler a força da moeda para 28 pares de Forex! Imagine como a sua negociação irá melhorar porque é capaz de apontar o ponto exacto do gatilho de uma nova tendência ou oportunidade de escalada? Manual do util
    Ultimate Sniper Dashboard
    Hispraise Chinedum Abraham
    4.82 (22)
    Desconto de $299! Os preços podem aumentar no futuro! Leia a descrição abaixo! Melhor Sistema de Entrada para Ultimate Sniper Dashboard: NÍVEIS DINÂMICOS FINAIS. (Por favor, verifique os meus produtos) O Ultimate Sniper Dashboard só funciona em mercados ao vivo devido aos limites de teste MT4 em várias moedas. Apresentamos o painel de instrumentos de Ultimate-Sniper! O nosso melhor, que contém tanto HA-Sniper, MA-Sniper. e muitos modos especiais. O Ultimate Sniper Dashboard é uma besta absolu
    Dynamic Forex28 Navigator
    Bernhard Schweigert
    4.43 (7)
    Dynamic Forex28 Navigator - A ferramenta de negociação Forex de última geração. ATUALMENTE 49% DE DESCONTO. Dynamic Forex28 Navigator é a evolução dos nossos indicadores populares de longa data, combinando o poder de três em um: Indicador Advanced Currency Strength28 (695 avaliações) + Advanced Currency IMPULSE com ALERTA (520 avaliações) + Sinais CS28 Combo (Bônus). Detalhes sobre o indicador https://www.mql5.com/en/blogs/post/758844 O que o Next-Generation Strength Indicator oferece?  Tudo
    ACTUALMENTE 40% DE DESCONTO!! A melhor solução para qualquer novato ou comerciante especializado! Este indicador é uma ferramenta comercial única, de alta qualidade e acessível, porque incorporámos uma série de características proprietárias e uma fórmula secreta. Com apenas UM gráfico, dá alertas para todos os 28 pares de moedas. Imagine como a sua negociação irá melhorar porque é capaz de identificar o ponto exacto de desencadeamento de uma nova tendência ou oportunidade de escalada! Constr
    Supply and Demand Dashboard PRO
    Bernhard Schweigert
    4.8 (20)
    Actualmente 40% OFF ! Este painel é uma peça de software muito poderosa que trabalha em múltiplos símbolos e até 9 prazos. Baseia-se no nosso principal indicador (Melhores críticas: Advanced Supply Demand ).   O tablier dá uma óptima visão geral. Mostra:   Valores filtrados da Oferta e da Procura, incluindo a classificação da força da zona, Distâncias de/para as zonas e dentro das zonas, Destaca as zonas aninhadas, Dá 4 tipos de alertas para os símbolos escolhidos em todos os (9) períodos de
    TPSpro RFI Levels
    Roman Podpora
    4.86 (28)
    INSTRUÇÕES RUS  /  INSTRUÇÕES   ENG  /  Versão MT5 Principais funções: Exibe zonas ativas de vendedores e compradores! O indicador exibe todos os níveis/zonas de impulso iniciais corretos para compras e vendas. Quando esses níveis/zonas são ativados, onde a busca por pontos de entrada começa, os níveis mudam de cor e são preenchidos com cores específicas. Setas também aparecem para uma percepção mais intuitiva da situação. LOGIC AI - Exibição de zonas (círculos) para busca de pontos de entrada
    FX Volume
    Daniel Stein
    4.63 (38)
    FX Volume: Vivencie o Verdadeiro Sentimento de Mercado sob a Perspectiva de um Corretor Visão Geral Rápida Quer aprimorar sua abordagem de trading? FX Volume fornece insights em tempo real sobre como traders de varejo e corretores estão posicionados—bem antes de relatórios atrasados como o COT. Seja para buscar ganhos consistentes ou simplesmente ter uma vantagem mais clara no mercado, FX Volume ajuda você a detectar grandes desequilíbrios, confirmar rompimentos e aperfeiçoar sua gestão de ris
    Super Signal – Skyblade Edition Sistema profissional de sinais de tendência sem repintar / sem atraso com taxa de acerto excepcional | Para MT4 / MT5 Funciona melhor em timeframes mais curtos, como 1 minuto, 5 minutos e 15 minutos. Principais características: Super Signal – Skyblade Edition é um sistema inteligente de sinais desenvolvido especificamente para operações com tendência. Utiliza uma lógica de filtragem em múltiplas camadas para detectar apenas movimentos direcionais fortes sustenta
    KT Alpha Hunter Arrows MT4
    KEENBASE SOFTWARE SOLUTIONS
    A maioria dos indicadores de setas entrega um sinal e deixa você descobrir todo o resto sozinho. O KT Alpha Hunter Arrows entrega um plano de trading completo. Cada seta de sinal aparece com um plano completo já desenhado no gráfico: linha de entrada, stop loss, quatro níveis de take profit e um veredito de edge em tempo real, mostrando se aquele ativo e timeframe valem a pena ser operados naquele momento. O pacote inclui o Trade Manager EA, que cuida da execução depois que você entra na operaçã
    Documentation for connecting Metatrader 4 with Python with a simple drag and drop EA.   A full end-to-end solution ,fully tested ,fast and efficient! The Pytrader ecosystem consists of a python script and a MT4 EA. (  MT5  version ) Further for the licensing an indicator is used.  The communication between the python script and the EA is based on sockets. EA is the  Server   and the python script the  Client .  It is always query(function / python script) and output(data / server). The EA doe
    O indicador Route Lines Prices - foi concebido para identificar a direção dos preços. A sua interface simples contém múltiplos algoritmos para calcular o comportamento dos preços e a direção futura. Estes algoritmos incluem cálculos de volatilidade e suavização de preços com base nos períodos de tempo utilizados. O indicador possui um único parâmetro para alterar o valor de " Calculating price values ". O valor padrão de 1 fornece um cálculo automático equilibrado, que pode ser utilizado sem ne
    Volatility Trend System - um sistema de negociação que dá sinais para entradas. O sistema de volatilidade fornece sinais lineares e pontuais na direção da tendência, bem como sinais para sair dela, sem redesenho e atrasos. O indicador de tendência monitora a direção da tendência de médio prazo, mostra a direção e sua mudança. O indicador de sinal é baseado em mudanças na volatilidade e mostra entradas no mercado. O indicador está equipado com vários tipos de alertas. Pode ser aplicado a vários i
    Trend Sniper Super Indicator is one of the best indicator which can provide you will perfect signals for short term and long term trades. This indicator is suitable for both scalping and swing trading strategies. The indicator is over 85% accurate. It uses terminal Message Alerts, Emails and Push notifications to your mobile device to inform you about the new trading opportunities and it will calculate the take profit and stop loss level for you. All you will need to do is to place a trade. Subs
    Trend Swing
    Mohamed Hassan
    4.5 (10)
    This indicator is unstoppable when combined with our other indicator called  Market Analysis . After purchase, send us a message and you could get  it  for  FREE as a BONUS!  Trend Swing is a professional indicator that is developed from scratch by our in-house development team. This indicator is very sophisticated because you can see the entry price levels with buy and sell signals that are given in real-time! It automatically draws the take profit zones along your stop loss which makes it e
    Currency Strength Exotics
    Bernhard Schweigert
    4.88 (33)
    ACTUALMENTE 20% DE DESCONTO ! A melhor solução para qualquer novato ou comerciante especializado! Este Indicador é especializado para mostrar a força da moeda para quaisquer símbolos como Pares Exóticos de Commodities, Índices ou Futuros. É o primeiro do seu género, qualquer símbolo pode ser adicionado à 9ª linha para mostrar a verdadeira força da moeda de Ouro, Prata, Petróleo, DAX, US30, MXN, TRY, CNH etc. Esta é uma ferramenta de negociação única, de alta qualidade e acessível, porque inco
    Antes de tudo, vale ressaltar que esta Ferramenta de Negociação é um Indicador Não Repintante, Não Redesenhante e Não Atrasado, o que a torna ideal para negociação profissional. Curso online, manual do utilizador e demonstração. O Indicador de Conceitos de Ação de Preço Inteligente é uma ferramenta muito poderosa tanto para traders novos quanto experientes. Ele combina mais de 20 indicadores úteis em um único, combinando ideias avançadas de negociação como Análise do Trader do Círculo Interno e
    BTMM State Engine Pro is a MetaTrader 4 indicator for traders who use the Beat The Market Maker approach: Asian session context, kill zone timing, level progression, peak formation detection, and a multi-pair scanner from a single chart. It combines cycle state logic with a built-in scanner dashboard so you do not need the same tool on many charts at once. What it does Draws the Asian session range; session times can follow broker server offset or be set in inputs. Tracks level progression (L
    Binary Options Support Resistance Indicator This indicator is designed for binary options trading and effectively shows retracements from support and resistance levels. Signals appear on the current candle. A red arrow pointing downwards indicates a potential selling opportunity, while a blue arrow pointing upwards suggests buying opportunities. All that needs adjustment is the color of the signal arrows. It is recommended to use it on the M1-M5 timeframes as signals are frequent on these timef
    Ultimate Dynamic Levels
    Hispraise Chinedum Abraham
    4.7 (10)
    Actualmente em férias com desconto de $399! Os preços podem aumentar no futuro. Ler descrição abaixo!  Apresentando os Últimos Níveis Dinâmicos - o Melhor Indicador de Entrada para o Painel de Atiradores Sniper Ultimate! Entradas extremamente baixas de risco e RR elevado!! Encontre AQUI o Painel de Atiradores Ultimate Sniper. A capacidade mais importante tanto para comerciantes principiantes como profissionais é dizer exactamente onde e quando é mais provável que um mercado gire, e como entrar
    Scalping Lines System -  é um sistema de scalping concebido especificamente para negociar o ativo Ouro (XAUUSD) em timeframes de M1 a H1. Combina indicadores de tendência, volatilidade e análise de mercado de sobrecompra/sobrevenda, reunidos num único oscilador para identificar sinais de curto prazo. Os principais parâmetros internos das linhas de sinal estão pré-configurados. Alguns parâmetros permanecem para ajuste manual: "Duração da Onda de Tendência", que regula a duração de uma série de
    Indicador Miraculous – Ferramenta 100% Não Repintável para Forex e Opções Binárias Baseada no Quadrado de Nove de Gann Este vídeo apresenta o Indicador Miraculous , uma ferramenta de negociação altamente precisa e poderosa, desenvolvida especificamente para traders de Forex e Opções Binárias . O que torna este indicador único é a sua base no lendário Quadrado de Nove de Gann e na Lei da Vibração de Gann , tornando-o uma das ferramentas de previsão mais precisas disponíveis na negociação moderna.
    PipFinite Trend PRO
    Karlo Wilson Vendiola
    4.88 (2251)
    Breakthrough Solution For Trend Trading And Filtering With All Important Features Built Inside One Tool! Trend PRO's smart algorithm detects the trend, filters out market noise and gives entry signals with exit levels. The new features with enhanced rules for statistical calculation improved the overall performance of this indicator. Important Information Revealed Maximize the potential of Trend Pro, please visit www.mql5.com/en/blogs/post/713938 The Powerful Expert Advisor Version Automatin
    Quantum Breakout Indicator PRO
    Bogdan Ion Puscasu
    4.96 (26)
    Apresentando       Quantum Breakout PRO   , o inovador Indicador MQL5 que está transformando a maneira como você negocia Breakout Zones! Desenvolvido por uma equipe de traders experientes com experiência em negociação de mais de 13 anos,   o Quantum Breakout PRO   foi projetado para impulsionar sua jornada comercial a novos patamares com sua estratégia inovadora e dinâmica de zona de rompimento. O Quantum Breakout Indicator lhe dará setas de sinal em zonas de breakout com 5 zonas-alvo de lucro
    SYSTEM INTRODUCTION:   The Binary Options Channels System Is Specifically Designed For Binary Options Trading. Unlike Other Systems And Indicators That Were Adopted From Other Trading Environments For Binary Options. Little Wonder Why Many Of Such Systems Fail To Make Money . Many End Up Loosing Money For Their Users.  A Very Important Fact That Must Be Noted Is The Fact That Application Of Martingale Is not Required. Thus Making It Safer For Traders Usage And Profitability. A Trader Can Use Fi
    Se você comprar este indicador, receberá meu Gerenciador de Operações Profissional   + EA  GRATUITAMENTE. Primeiramente, vale ressaltar que este Sistema de Trading é um Indicador Não Repintado, Não Redesenho e Não Atrasado, o que o torna ideal tanto para o trading manual quanto para o automatizado. Curso online, manual e download de predefinições. O "Sistema de Trading Inteligente MT5" é uma solução completa de trading projetada para traders novos e experientes. Ele combina mais de 10 indicador
    Mais do autor
    Ichimoku Map (instant look at the markets) - built on the basis of the legendary Ichimoku Kinko Hyo indicator. The task of the Ichimoku Map is to provide information about the market strength on the selected time periods and instruments, from the point of view of the Ichimoku indicator. The indicator displays 7 degrees of buy signal strength and 7 degrees of sell signal strength. The stronger the trend, the brighter the signal rectangle in the table. The table can be dragged with the mouse. The
    The trading system is designed to work with gold on time periods: 30M, 1H. The indicator allows you to adjust to the market situation. Parameters for 1H :   PERIOD=9F ,   FILTER=300 .   Parameters for  30M :   PERIOD=22B ,   FILTER=450 .     A small adjustment to a specific broker is allowed .   If you change the amount of history displayed, you may also need to adjust the parameters. The indicator is not redrawn.     "Gold n XAU" uses different rules for entering a trade and different rules
    Length Movement
    Pavel Verveyko
    5 (1)
    Measures the length of the selected movement in points, shows the duration of the movement, as well as the speed of movement.   Outputs the average value of each dimension. It is designed to calculate the expected target based on typical market movements. The intended goal will provide information about the ratio of the stop size to the possible profit and will allow you not to open positions with a small expected profit. It will also help you determine the point at which it is more logical to c
    Turn
    Pavel Verveyko
    The indicator shows the market turning points (entry points). Reversals allow you to track rebound/breakout/testing from the reverse side of the lines of graphical analysis or indicators. Reversals can be an independent signal. The indicator allows you to determine reversals taking into account the trend and without it. You can choose a different period for the movement preceding the reversal, as well as the volatility coefficient. When plotting reversals, the indicator takes into account volati
    The indicator allows you to quickly switch from one instrument to another, from one time period to another using the keyboard or buttons on the monitor. Each command can be assigned a hot key from 0-9, a-Z (case-insensitive) and VK_OEM_COMMA ("<" on the keyboard) and VK_OEM_PERIOD (">" on the keyboard). This can help you to operate the maximum number of instruments that are available at your broker, analyze more instruments/periods in less time. This product cannot be tested in the tester , beca
    Ratio TP SL
    Pavel Verveyko
    5 (1)
    This indicator allows you to measure the profitability of each specific transaction (the ratio of Stop and Profit). The indicator allows you to adjust the ratio by step size and number of steps. You can build an unlimited number of ratios to compare the risks from different movements. Note: in MT4, the number of horizontal lines in a single ratio cannot exceed 32. Building a line : click the " Ratio " button and draw a line (mouse click - the first point of the line, where the mouse is release
    Corporate Report
    Pavel Verveyko
    5 (1)
    The script displays info about the share's corporate reports and dividends. The data is downloaded from   investing.com : Report date Profit per share (EPS) Revenue Market capitalization Amount of dividends Date of payment of dividends Dividend income The product cannot be tested in the tester (since it is not possible to receive data from the Internet). Before launching:  Add 2   URL   https://ru.investing.com/earnings-calendar/Service/getCalendarFilteredData  and   https://ru.investing.com/di
    Channel FTF
    Pavel Verveyko
    The Envelopes indicator determines the presence of a trend or flat. It has 3 types of signals, shows the probable retracement levels and levels of the possible targets. The Fibonacci coefficients are used in the indicator's calculations. Signals (generated when touching the lines or rebounding from lines): Trend - the middle line of the Envelopes has a distinct inclination; the lines below the channel's middle line are used for buy trades, the lines above the middle line and the middle line itse
    Mr Big
    Pavel Verveyko
    The indicator shows and highlights the chart candles, which are formed as a result of large players entering the market in large volumes. Such candles can also be formed after achieving a certainty on the market, when most of the participants hold positions in the same direction. The movement is likely to continue in that direction after such candles. The indicator highlights the significant candles from the existing ones on the chart; The indicator allows identifying the trends based on candles
    Splash
    Pavel Verveyko
    The indicator identifies the most suitable moment for entering the market in terms of market volatility, when the market has the strength to move (the signal is indicated by an arrow under the candle). For each of the signals, the presence of trends on the current and higher timeframes is determined, so that the signal is in the direction of the majority of positions opened on the market (denoted near the signal by abbreviations of timeframes with a trend present). The signal appears after the c
    The indicator displays the key support and resistance levels on the chart. The significance of these levels lies in that the price may reverse or strengthen the movement when passing such levels, since they are formed as a consequence of the natural reaction of market participants to the price movement, depending on which positions they occupied or did not have time to occupy. The psychology of the level occurrence: there always those who bought, sold, hesitated to enter or exited early. If the
    This indicator is a multitimeframe trading strategy. It has the levels for stop loss, take profit and entry point. The order level can also be set manually. The indicator uses the regularity of the market, which manifests itself on all instruments, and does not require adjustment of the parameters. The strategy uses a proprietary approach to determining: trend, volatility, hierarchy of timeframe significance, the size of the history period (the number of candles), which is important for making a
    Trend Sync
    Pavel Verveyko
    5 (1)
    The indicator shows the trend of 3 timeframes: higher timeframe; medium timeframe; smaller (current) timeframe, where the indicator is running. The indicator should be launched on a chart with a timeframe smaller than the higher and medium ones. The idea is to use the trend strength when opening positions. Combination of 3 timeframes (smaller, medium, higher) allows the trend to be followed at all levels of the instrument. The higher timeframes are used for calculations. Therefore, sudden change
    The indicator detects important peaks and troughs (extremes) on the chart. These points can be used to plot support/resistance levels and trend lines, as well as any other graphical analysis. These points can serve as reference points for setting trading orders. The indicator does not redraw . Settings: Size_History  - the size of the calculated history. Num_Candles_Right  - number of candles to the right of the peak or trough. Num_Candles_Left  - number of candles to the left of the peak or
    Running along Lines
    Pavel Verveyko
    3 (2)
    The indicator draws support and resistance lines on an important part of the chart for making decisions. After the trend line appears, you can trade for a breakout or rebound from it, as well as place orders near it. Outdated trend lines are deleted automatically. Thus, we always deal with the most up-to-date lines. The indicator is not redrawn . Settings: Size_History  - the size of the calculated history. Num_Candles_extremum  - the number of candles on each side of the extremum. Type_Arrow
    Key Volumes
    Pavel Verveyko
    1 (1)
    The indicator shows key volumes confirmed by the price movement. The indicator allows you to analyze volumes in the direction, frequency of occurrence, and their value. There are 2 modes of operation: taking into account the trend and not taking into account the trend (if the parameter Period_Trend = 0, then the trend is not taken into account; if the parameter Period_Trend is greater than zero, then the trend is taken into account in volumes). The indicator does not redraw . Settings History_S
    This trading system is based on market impulses of varying complexity.   To generate a signal, the indicator uses the moments when the direction of the pulse and the necessary section of the trend coincide. The indicator also takes into account the current market volatility. Stop_loss tags can be set with the parameter "0" or "1", then Stop_Loss will take into account market volatility.   Take_Profit tags can be set with the parameter "0", then Take_Profit will take into account market volatil
    Indexes
    Pavel Verveyko
    The stocks that make up the index are one of the drivers of the movement. Analyzing the financial performance of all elements of the index, we can assume further development of the situation. The program (script) displays corporate reports of shares that are part of the index selected in the settings.   "Indexes" cannot be tested in the tester (since there is no way to get information from the Internet). Information is downloaded from the site investing.com: Report Date Earnings per share (E
    Fibo World
    Pavel Verveyko
    The indicator builds a graphical analysis based on the Fibonacci theory. Fibo Fan is used for the analysis of the impulses and corrections of the movement. Reversal lines (2 lines at the base of the Fibonacci fan) are used to analyze the direction of movements. The indicator displays the of 4 the target line in each direction. The indicator takes into account market volatility. If the price is above the reversal lines, it makes sense to consider buying, if lower, then selling. You can open posi
    The indicator determines the state of the market: trend or flat. The state of the market is determined by taking into account volatility. The flat (trading corridor)is displayed in yellow. The green color shows the upward trend. The red color shows the downward trend. The height of the label corresponds to the volatility in the market. The indicator does not redraw . Settings History_Size   - the amount of history for calculation. Period_Candles  - the number of candles to calculate the indicat
    The indicator plots flexible support and resistance levels (dots). A special phase of movement is used for construction. Levels are formed dynamically, that is, each new candle can continue the level or complete it. The level can provide resistance or support to the price even where it is no longer there. Also, support and resistance levels can change roles. The importance of levels is affected by: the amount of time the level is formed and the number of touches. The significance of these lev
    The indicator is a trading system for short-term trading. Scalper Assistant helps to determine the direction of the transaction, and also shows the entry and exit points. The indicator draws two lines (possible points for opening positions). At the moment of the breakdown of the upper line up (and when all trading conditions are met), an up arrow appears (a buy signal), as well as 2 goals. At the moment of the breakdown of the lower line down (and when all trading conditions are met), a down ar
    Gold n XAU
    Pavel Verveyko
    The trading system is designed to work with gold on time periods: 30M, 1H. The indicator allows you to adjust to the market situation. Parameters for 1H :   PERIOD=9F ,   FILTER=300 .   Parameters for  30M :   PERIOD=22B ,   FILTER=450 .   A small adjustment to a specific broker is allowed .   If you change the amount of history displayed, you may also need to adjust the parameters. The indicator is not redrawn.     "Gold n XAU" uses different rules for entering a trade and different rules fo
    The indicator builds "psychological levels": levels of round numbers and intermediate levels of round numbers. Round numbers play an important role in forming support and resistance levels. There is a pattern in which the decline or growth of the price can stop at round numbers. The level whose price ends at 0 is the level of a round number of the first order. Intermediate level, this is the level between two round levels, for example, between 10 and 20 this is level 15. In the " Num_Zeros "
    Ichimoku Map (instant look at the markets) - built on the basis of the legendary Ichimoku Kinko Hyo indicator. The task of the Ichimoku Map is to provide information about the market strength on the selected time periods and instruments, from the point of view of the Ichimoku indicator. The indicator displays 7 degrees of buy signal strength and 7 degrees of sell signal strength. The stronger the trend, the brighter the signal rectangle in the table. The table can be dragged with the mouse. The
    The indicator displays a stock chart of a non-standard type, in which the price and time have the same value. The usual chart of Japanese candlesticks does not take into account all the information that the time analysis can give. Renko charts do not use all the information that price can give in relation to time. The "Chart Price and Time" indicator takes into account price and time equally and shows the predominance of price or time. Taking into account price and time equally gives an idea
    The indicator tracks sharp volatility (moments when the market has shown increased activity and movement may occur), on the selected instruments and time periods. The information is displayed as colored rectangles. Thus, it is possible to assess at a glance which tool should be given priority attention. The indicator will be useful for scalpers when they need a quick reaction or for traders working with a large number of instruments. The indicator does not redraw. The indicator displays 8 degree
    The Alert Creator indicator is designed to create alerts for selected conditions. You can select one or several indicators for the notification. If several conditions are selected, the alert is triggered when all the selected conditions are met. The signals can be configured separately for buying and separately for selling. Example, a buy alert: the closing price is above the moving average, the RSI is below 20. (In this example, 2 indicators are used to generate an alert: MA and RSI) At the
    The indicator determines the strength of the trend and its possible reversal points, based on the author's arithmetic approach . Each new peak or trough is a trend development. Such peaks and troughs are numbered so that the strength of the trend development can be seen. Attempts to change the trend are also numbered. This gives an understanding of a possible change in the direction of the trend. Indicator signals are generated when trying to change the trend . In the settings, it is possible
    The indicator defines a trading corridor, a flat market, and corrections. Allows you to compare the significance of different flat and trend areas (by time of existence and by volatility). This makes it possible to assess the market cycle and its mood at a glance. That is, how long does the flat last on average, and how long is the trend and what kind of volatility they have in points. As a rule, the longer the flat lasts, the more likely it is to accumulate the potential for a strong movem
    Filtro:
    Sem comentários
    Responder ao comentário