DailyBoxScanner
- Indicadores
- Versão: 1.0

THE DAILY BOX SCANNER 🔥
The MT5 Indicator That Turns the Previous Daily Candle Into a Reversal Machine
---
What if the market told you exactly where it was going to reverse — every single day — before it happened?
Not with vague arrows. Not with repainting signals. Not with some black-box algorithm that leaves you guessing.
But with the most honest, most reliable, most universally respected structure in all of trading: the previous daily candle's high and low.
That's it. That's the edge. And the Daily Box Scanner weaponizes it across your entire watchlist, across multiple timeframes, automatically, while you sleep.
---
THE STRATEGY THAT INSTITUTIONS HAVE USED FOR DECADES — NOW FULLY AUTOMATED
Every day, the market opens inside yesterday's range. That range — the Daily Box — is where the battle lines are drawn.
· The top of the box is where sellers are waiting.
· The bottom of the box is where buyers are lurking.
· The middle is noise.
The Daily Box Scanner waits for price to push into the top 25% or bottom 25% of yesterday's range — the exhaustion zones — and then hunts for a reversal pattern.
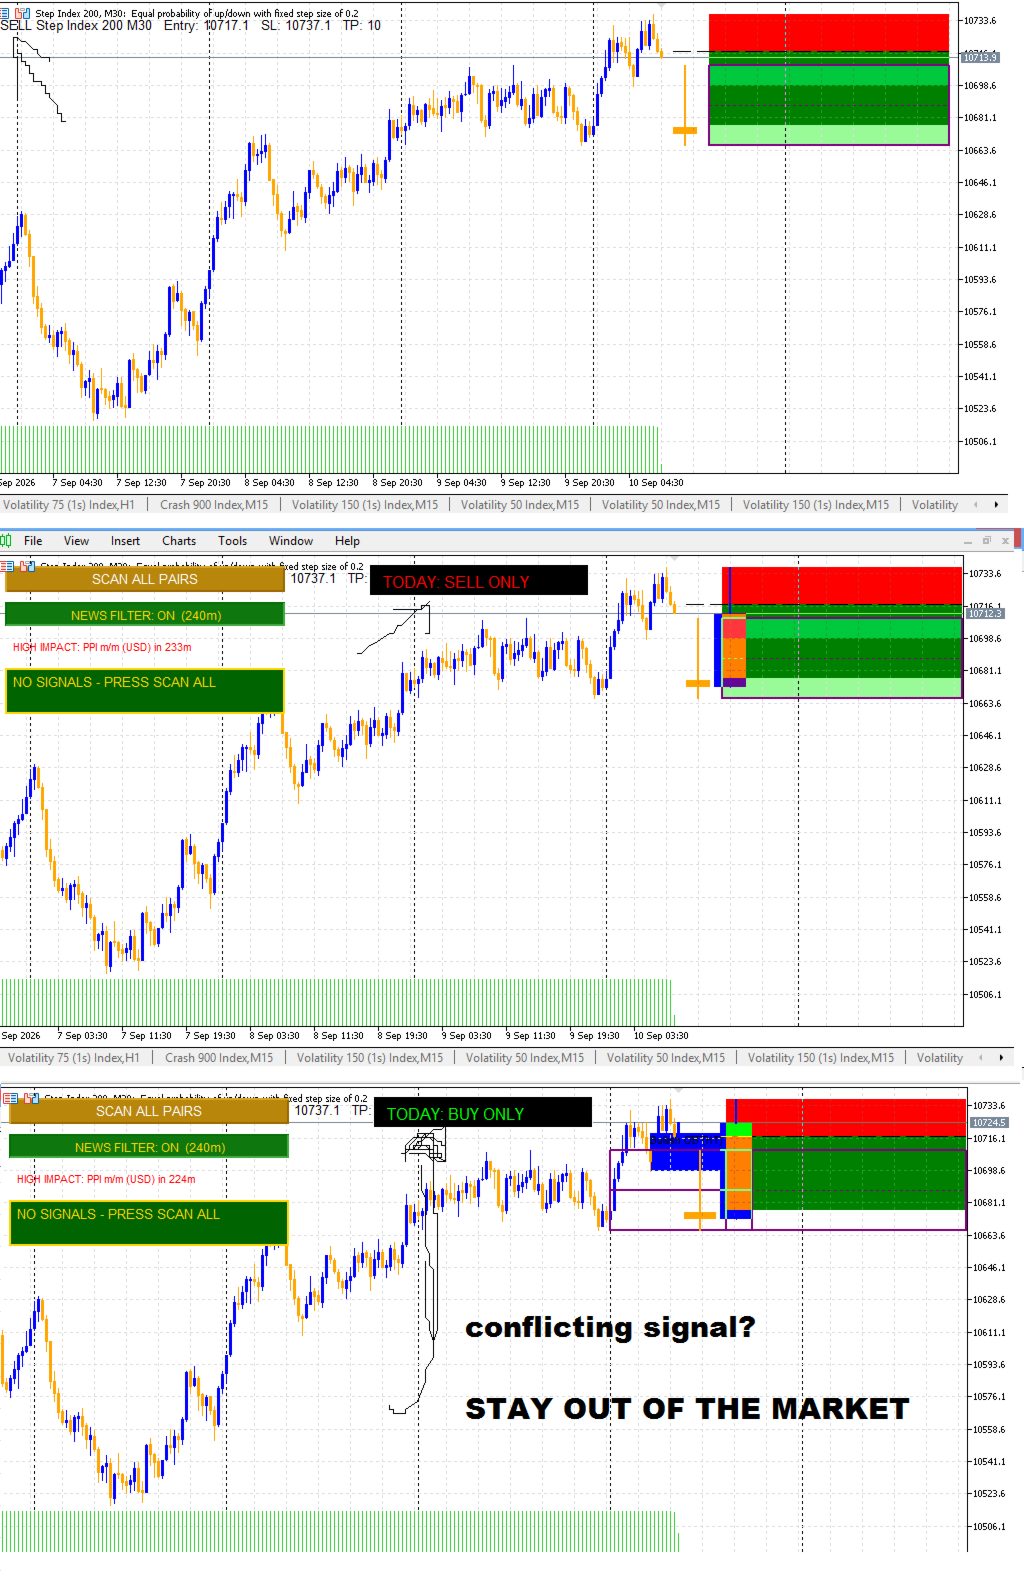
When it finds one, it doesn't just beep at you. It draws the entire trade on a fresh chart: the entry, the stop loss at the swing point, the take profit at 2x risk, the shaded zones, the previous daily candle rendered as a proper candlestick glyph, and the projected box extending into the future so you can see exactly where the trade lives.
This is not an indicator that tells you what to think. This is an indicator that shows you what the market is doing — and where it's likely to turn.
---
WHAT MAKES THIS DIFFERENT FROM EVERY OTHER "REVERSAL" INDICATOR
Most reversal indicators are glorified oscillator crossovers. They fire in the middle of nowhere, they repaint, and they leave you holding the bag.
The Daily Box Scanner is built on structure, not math tricks.
Here's the funnel every single signal must pass through before it ever reaches your dashboard:
Gate 1 — The Zone. Price must push into the top 25% or bottom 25% of the previous daily range. No zone, no signal. This alone eliminates 80% of the garbage.
Gate 2 — The ATR Band. The signal candle must be the right size — not a doji, not a monster spike. You control the minimum and maximum ATR multiples.
Gate 3 — Relative Volume. The reversal candle must show real participation — volume that exceeds the average of the prior 20 bars by your chosen multiplier. This is the filter that separates genuine reversals from dead-cat bounces.
Gate 4 — The Pattern. Either a hammer/shooting-star (long wick, small body — your WickBodyRatio is adjustable) or a 3-bar structural reversal (spike bar + close-back confirmation). Both patterns, both directions, all automatic.
Gate 5 — The Context. The extreme bar must be a genuine local high or low of the bars that led into it. This kills the fake signals where price is just drifting sideways inside the zone.
Gate 6 — One Per Side Per Day. Optional dedup so you don't get spammed with the same BUY signal five times on five timeframes.
Only signals that survive all six gates reach your dashboard.
That's why the dashboard shows a funnel summary — checked, no-data, no-zone, atr, volume, no-pattern, context, dedup — so you can see exactly why nothing matched and which filter to relax. No guessing. No mystery.
---
THE PO3 OVERLAY: SEE YESTERDAY AND TODAY AT A GLANCE
Here's something no other scanner gives you.
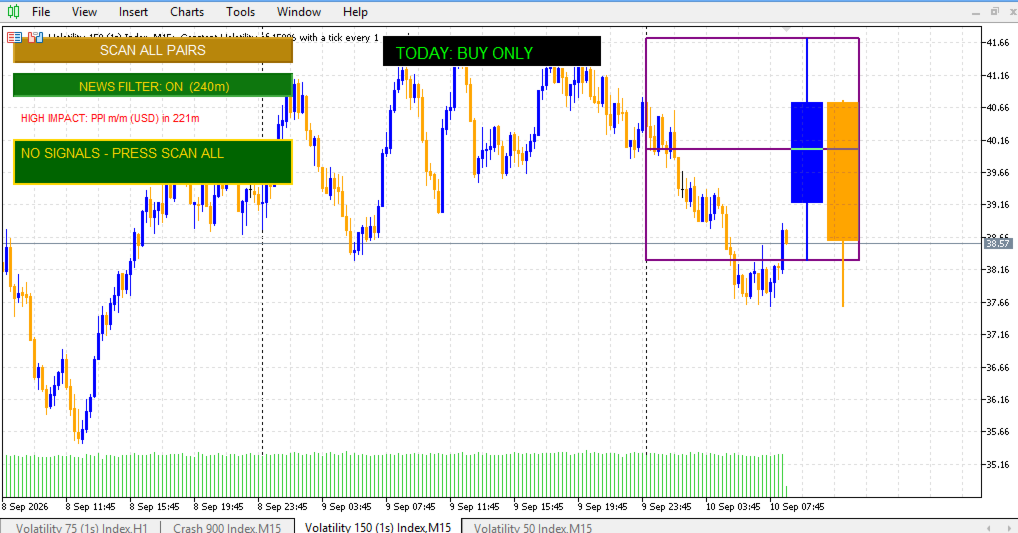
The PO3 Overlay draws a continuous box across today's price — no seam, no gap, no ugly vertical line — showing you the previous daily range extending into the live session. It includes:
· The previous daily candle rendered as a real candlestick (body + wicks), updating in place
· The current forming daily candle, live, redrawn efficiently without flicker
· A dotted mid-line so you always know where the 50% level sits
· The top and bottom zones shaded so you can see the danger areas instantly
This is the visual context that turns a naked chart into a battlefield map.
---
MULTI-PAIR, MULTI-TIMEFRAME, ONE CLICK
The SCAN ALL PAIRS button does exactly what it says. It sweeps your entire Market Watch — every symbol, every enabled timeframe — and returns a ranked list of every valid setup it finds.
Toggle which timeframes to scan:
· M5 — for the scalpers
· M15 — the sweet spot for most intraday traders
· M30 — for the patient
· H1 — for the swing traders
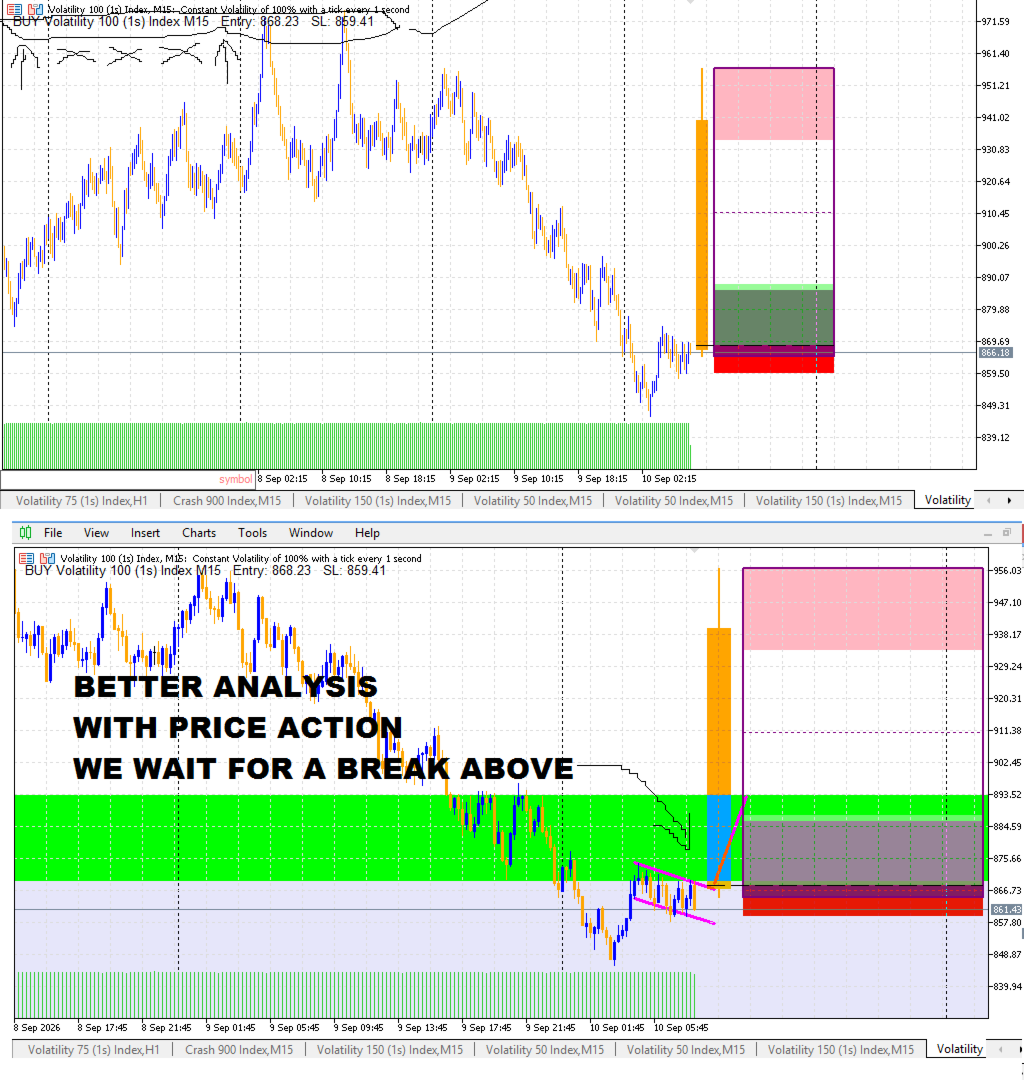
Each signal appears as a clickable row on the dashboard. Click it, and a new chart opens with the entire setup drawn out — entry line, TP box in green, SL box in red, zone shading, previous daily candle glyph, the works.
No more manually marking up charts. No more "wait, where was the entry again?" The trade is laid out for you, ready to execute.
---
THE DASHBOARD THAT TELLS YOU THE TRUTH
Top-left corner, always visible, always honest:
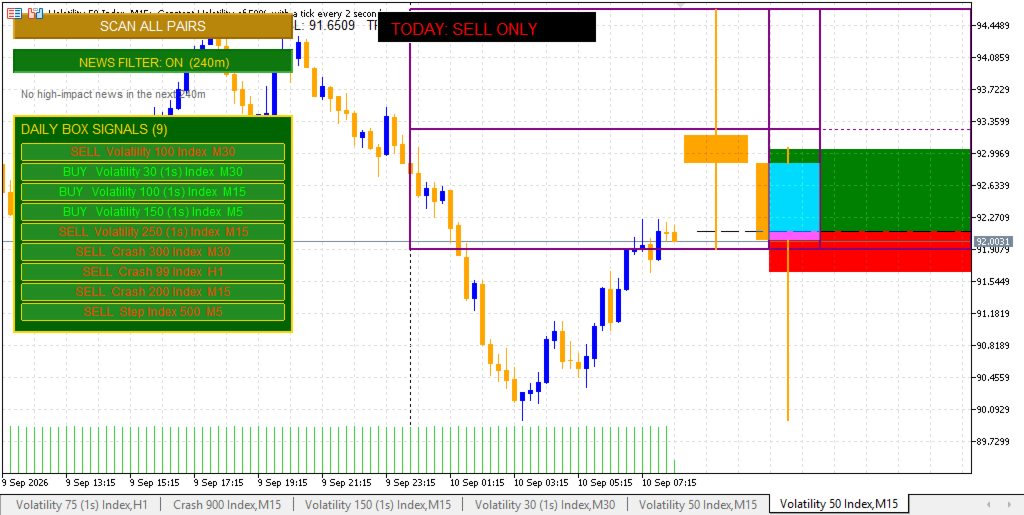
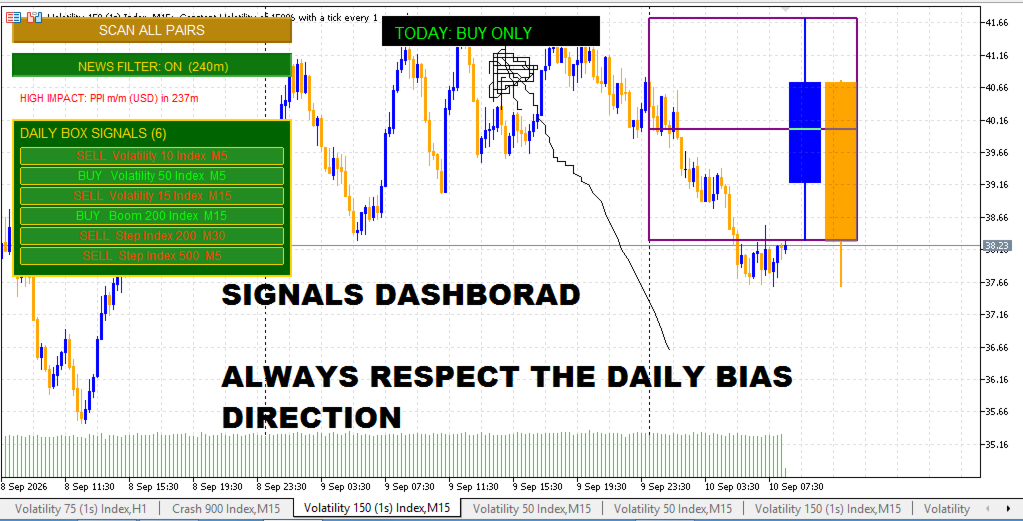
DAILY BIAS PANEL — A multi-factor daily bias (EMA, RSI, MACD, ADX/DI) that reads TODAY: BUY ONLY, TODAY: SELL ONLY, or TODAY: NO CLEAR BIAS in bold color-coded text. Trade with the daily tide, not against it.
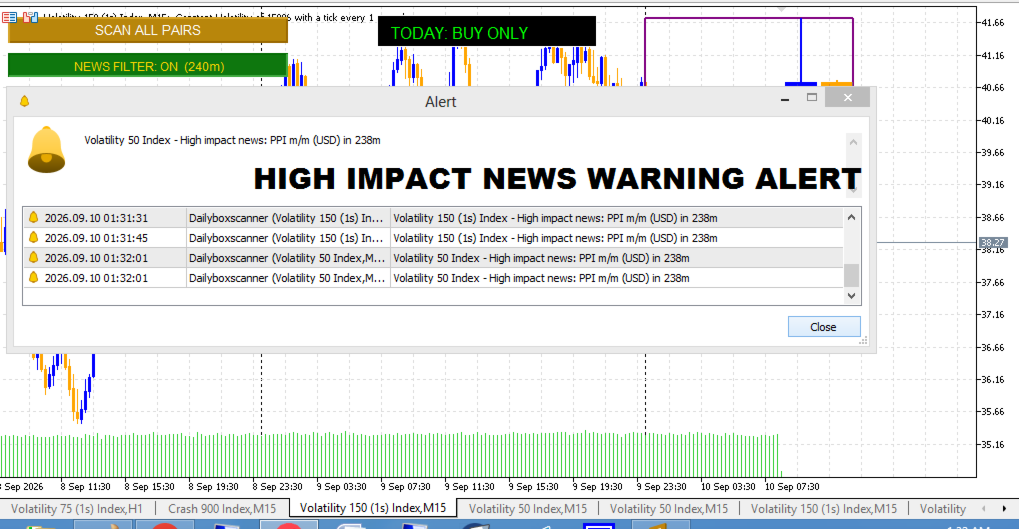
NEWS FILTER BUTTON — One click to toggle the high-impact news filter on or off. When on, it scans the economic calendar for high-impact events affecting either currency in your pair, up to 240 minutes ahead, and alerts you when news is within your threshold. No more getting stopped out by an NFP print you forgot about.
SIGNAL DASHBOARD — Green and gold, premium styled, showing every signal found with direction, symbol, and timeframe. Click any row to open the full setup chart.
FUNNEL SUMMARY — When zero signals are found, it tells you why. Which gate killed the most setups. Which filter to loosen. This is transparency no other indicator gives you.
---
THE H1 ORDER BLOCK — BONUS COSMETIC LAYER
As if that weren't enough, the scanner also identifies and draws the most recent valid H1 order block — the consolidation range that preceded a breakout, sitting below price (bullish) or above price (bearish).
It uses a percentage-based minimum size so it scales correctly across wildly different symbols — from EURUSD to XAUUSD to BTCUSD. It draws the block as a shaded rectangle with a label, and it self-diagnoses in the log when no block is found, telling you exactly how close the tightest consolidation was to your tolerance.
This is institutional order flow, drawn on your chart, for free.
---
AUTO-DEPLOY: EVERY CHART, EVERY PAIR, ALWAYS CONSISTENT
The scanner doesn't just live on one chart.
With AutoDeployToOtherCharts enabled, it automatically attaches itself to every other open chart in your terminal — so the daily bias, order block, PO3 overlay, and dashboard are always there, no matter which pair or timeframe you're looking at.
The deploy is deferred to the first timer tick — not run inside OnInit — which prevents the cascade failure that plagues other indicators trying to do the same thing. The developer thought about this. That's the level of care in this code.
---
BUILT FOR SPEED. BUILT FOR RELIABILITY. BUILT TO RESPECT YOUR CHART.
Let's talk about what's under the hood, because the difference shows.
Efficient object handling. The PO3 overlay uses a lightweight upsert helper — moving existing objects instead of delete-and-recreate — which eliminates the flicker and ghosting that plague lesser indicators.
Throttled recalculation. The main calculation runs once per new bar, not on every tick. The PO3 overlay updates on a timer, not tick-by-tick. Your chart stays smooth even on fast-moving symbols.
No handle leaks. ATR is calculated with a lightweight internal True Range average rather than creating and managing an iATR handle per symbol — critical when scanning the entire Market Watch.
Deferred deployment. As mentioned, auto-deploy is deferred out of OnInit to prevent the recursive cascade that makes other indicators hang.
Self-documenting logs. When something doesn't fire, the log tells you why. The order block scanner prints a throttled diagnostic showing the tightest consolidation it found and how many passed each stage. You're never left in the dark.
---
HOW TO USE THE DAILY BOX SCANNER — A COMPLETE WALKTHROUGH
STEP 1: INSTALLATION
1. Open MetaTrader 5
2. Go to File → Open Data Folder
3. Navigate to MQL5 → Indicators
4. Drop the DailyBoxScanner.mq5 file into that folder (or a subfolder like SaintEmma — but if you use a subfolder, update the IndicatorFileName input to match, e.g. SaintEmma\DailyBoxScanner)
5. Open MetaEditor (F4), find the file, and click Compile (F7)
6. Back in MT5, open the Navigator panel (Ctrl+N), find DailyBoxScanner under Indicators
7. Drag it onto any chart
The indicator will initialize, apply premium green-and-gold chart cosmetics (white background, blue bulls, orange bears — clean and readable), and begin drawing the dashboard.
STEP 2: CONFIGURE YOUR INPUTS
The inputs are grouped logically. Here's what matters most:
Daily Box / Reversal Strategy:
· ZonePercent (default 25.0) — How deep into the box price must push. 25% means the top quarter or bottom quarter. Lower it to 20% for stricter signals, raise to 30% for more signals.
· UseHammerPattern (true) — Enables hammer/shooting-star detection.
· UseThreeBarReversal (true) — Enables the 3-bar structural reversal pattern.
· WickBodyRatio (2.0) — How many times the wick must exceed the body for a hammer. 2.0 is standard. Raise to 2.5 or 3.0 for stricter.
· RequireReversalContext (true) — Keep this on. It's the fake-signal killer.
· RiskReward (2.0) — TP distance as a multiple of SL distance. 2.0 means 2:1. Raise for more aggressive targets.
Signal Filters:
· VolumeAvgPeriod (20) — Bars for the average volume comparison.
· VolumeMultiplier (1.5) — Signal volume must exceed 1.5x the average. Set to 0 to disable volume filtering entirely.
· ATRPeriod (14) — ATR period for the candle-size filter.
· MinATRMultiple (0.5) — Reject candles smaller than 0.5x ATR.
· MaxATRMultiple (2.0) — Reject candles larger than 2.0x ATR. Set either to 0 to disable that bound.
· OneSignalPerSidePerDay (true) — Keeps the dashboard clean. Turn off if you want every signal on every timeframe.
Scanner Timeframes:
Toggle M5, M15, M30, H1 on or off depending on your trading style.
News Filter:
· NewsFilterDefaultOn (true) — Start with the filter active.
· NewsLookaheadMinutes (240) — Look 4 hours ahead for high-impact news.
· NewsAlertThresholdMinutes (240) — Alert when news is within 4 hours.
H1 Order Block:
· OBLookbackBars (120) — How far back to search.
· OBConsolidationBars (3) — Bars forming the consolidation.
· OBConsolidationTolerancePct (0.35) — Max range of the consolidation as a % of price.
· OBMinSizePercent (0.05) — Minimum block size as a % of price.
PO3 Overlay:
· ShowPO3Overlay (true) — Toggle the continuous previous-day box on the live chart.
Dashboard / Signal Chart:
· SignalPanelWidthBars (60) — How wide the projected panel is on signal charts.
· SignalPanelGapBars (3) — Gap between price and the panel.
Refresh / Auto-Deploy:
· FastRefreshSeconds (15) — How often bias/OB/PO3 refresh.
· NewsCheckEverySeconds (60) — How often the news calendar re-checks.
· AutoDeployToOtherCharts (true) — Auto-attach to all open charts.
· IndicatorFileName ("DailyBoxScanner") — Must match the compiled .ex5 name.
STEP 3: RUN THE SCANNER
Click the gold SCAN ALL PAIRS button in the top-left corner.
The indicator sweeps every symbol in your Market Watch, across every enabled timeframe, and returns a list of valid setups.
If signals are found, they appear as clickable rows on the green-and-gold dashboard. Each row shows the direction (BUY/SELL), the symbol, and the timeframe.
Click any row and a new chart opens with the full setup drawn:
· The previous daily candle rendered as a candlestick glyph on the left
· The shaded zones (pink for sell zone, green for buy zone)
· The TP box in green (entry to take profit)
· The SL box in red (entry to stop loss)
· The purple daily box border with dotted mid-line
· The entry line as a dashed black line
· An info label showing the exact entry, SL, and TP prices
Everything you need to place the trade is right there.
STEP 4: READ THE DASHBOARD
Daily Bias (top center): Tells you if today is a BUY ONLY, SELL ONLY, or NO CLEAR BIAS day. Trade with the bias, not against it.
News Filter (top left): Shows whether the filter is on or off, and if on, displays the nearest high-impact news event and how many minutes away it is. Red text means news is imminent.
Signal Dashboard (below the news filter): Lists every signal found. If no signals, shows the funnel summary explaining why.
STEP 5: EXECUTE WITH CONFIDENCE
When you click a signal and the chart opens, you have everything:
· Entry price — the close of the signal candle
· Stop loss — always at the swing low (for buys) or swing high (for sells) of the pattern bar
· Take profit — calculated as entry + (risk × RiskReward)
· Zone context — you can see exactly where price is within the daily box
· Daily bias — you know if the daily tide is with you
Place the trade. Set the SL and TP. Let the market do the rest.
---
THE PSYCHOLOGY OF WHY THIS WORKS
Markets are auctions. They move from liquidity zone to liquidity zone, from imbalance to balance, from extreme to mean.
The previous daily high and low are the two most watched levels in all of trading. Every institutional desk, every algorithm, every retail trader has them marked. When price pushes into those zones, it's either:
A) Breaking out with conviction — in which case it blasts through and keeps going, and the reversal pattern never forms (so you don't get a signal), or
B) Reversing from exhaustion — in which case you get a long wick, a volume spike, a structural close-back, and a signal.
The Daily Box Scanner is designed to catch only scenario B.
It doesn't predict. It doesn't guess. It waits for the market to show its hand — and then it acts.
That's the difference between gambling and trading.
---
WHO IS THIS FOR?
The Intraday Scalper — Scanning M5 and M15 across 20 pairs, looking for quick reversals off the daily extremes. The dashboard is your radar. The chart is your execution.
The Swing Trader — Scanning H1 for high-probability reversals at the daily box edges. The daily bias panel keeps you on the right side of the trend.
The Prop Firm Challenger — The strict 6-gate filter and the 2:1 risk-reward default mean only the cleanest setups make it through. This is the discipline you need to pass.
The Algorithmic Curious — The structure is transparent. Every gate is documented. The funnel summary tells you exactly why signals did or didn't fire. You can tune it, backtest it, and make it yours.
The Busy Professional — You don't have time to stare at charts all day. The scanner does the watching. You just check the dashboard, click the signal, and execute.
---
WHAT YOU GET
· The DailyBoxScanner.mq5 indicator — full source code, ready to compile
· Six-gate signal filtration — zone, ATR, volume, pattern, context, dedup
· Two reversal patterns — hammer/shooting-star and 3-bar structural reversal
· Multi-pair, multi-timeframe scanning — M5, M15, M30, H1
· The PO3 Overlay — continuous previous-day box with live prev/current candle pair
· The signal chart generator — one click opens a fully annotated setup chart
· The daily bias panel — multi-factor daily direction filter
· The news filter — high-impact event awareness with alerts
· The H1 order block drawer — institutional order flow visualization
· The funnel summary — transparency into why signals did or didn't fire
· Auto-deploy to all charts — consistent experience across your terminal
· Premium chart cosmetics — green and gold, clean and readable
· Efficient object handling — no flicker, no ghosting, no lag
· Self-documenting logs — you're never left guessing
· Full input customization — every filter, every threshold, every toggle
---
THE GUARANTEE OF QUALITY
This is not a repackaged free indicator. This is not a template with a coat of paint.
This is a purpose-built, professionally engineered MT5 indicator that solves a specific problem: finding high-probability reversals at the previous daily box extremes across a multi-pair watchlist, automatically, with full transparency.
The code is clean. The logic is sound. The execution is premium.
Every design decision — from the deferred auto-deploy to the upsert object helpers to the throttled recalculation to the funnel summary — was made with the trader in mind.
---
FINAL WORD
The market gives you the same information every single day.
Yesterday's high. Yesterday's low. The range between them.
The question is: what are you going to do with it?
The Daily Box Scanner turns that information into a systematic, filtered, multi-pair, multi-timeframe reversal detection engine — and lays the entire trade out on a chart for you with one click.
No more guessing. No more missed setups. No more staring at charts waiting for something to happen.
The scanner watches. You execute.
SaintEmma FX — Daily Box Scanner.
Your edge. Automated.
---
For setup support, customization requests, or to join the SaintEmma FX community, reach out on WhatsApp at the number listed in the indicator header.
Trade smart. Trade structured. Trade the box.