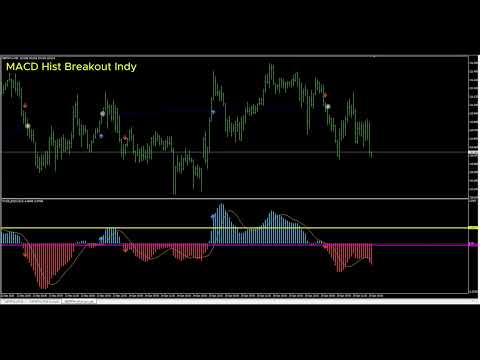
MACD Hist Breakout Indy MT5
- Indicadores
- Versão: 1.3
- Atualizado: 1 junho 2026
- Ativações: 5

Introduction
Stop trading lagging zero-line crosses and start trading pure momentum. The MACD 1-2-3 Momentum Breakout PRO is an advanced algorithm designed exclusively for MetaTrader 5. It tracks the internal "breathing cycle" of the market to identify high-probability momentum shifts using a strict, multi-step algorithmic cycle.
Now updated to Version 1.03, this indicator features a complete multi-channel alert system and introduces Dynamic Visual Breakout Levels—giving you absolute clarity on exactly where the momentum barrier was broken.
How It Works: The 1-2-3 Breakout Logic
The indicator utilizes a sophisticated built-in State Machine to track the exact structure of the MACD Histogram. It waits for a complete 3-step cycle before confirming a signal on a closed bar.
🔵 BUY Signal (Bullish Breakout):
-
The Build (Step 1): The MACD Histogram rises above the Zero Line, establishing a bullish peak.
-
The Pullback (Step 2): The market retraces, and the MACD Histogram drops below the Zero Line (the resting phase).
-
The Breakout (Step 3): Bullish volume returns. The histogram crosses back above the Zero Line and breaks higher than the previous peak. A BUY arrow is printed, and a horizontal reference line is drawn exactly at the breakout threshold.
🔴 SELL Signal (Bearish Breakout):
-
The Build (Step 1): The MACD Histogram drops below the Zero Line, establishing a bearish trough.
-
The Pullback (Step 2): The market retraces, pushing the histogram above the Zero Line.
-
The Breakout (Step 3): Bearish volume returns, crossing below the Zero Line and breaking lower than the previous trough. A SELL arrow is printed, accompanied by a dynamic resistance line.
Key Features (Updated for v1.03)
-
[NEW] Dynamic Reference Lines: The indicator now draws automatic horizontal lines (OBJ_HLINE) in the sub-window at the exact breakout level. This allows you to visually verify the breakout threshold instantly. Old lines are smartly auto-deleted to keep your chart clean.
-
[NEW] Comprehensive Alert System: Never miss a setup. Supports Popup Alerts, Email Notifications, and Mobile Push Notifications. Alerts are meticulously filtered to trigger only on closed bars, preventing false alarms.
-
100% Non-Repainting: Built with strict MT5 ArraySetAsSeries and CopyBuffer architecture. Signals are calculated and locked in only on closed bars.
-
Native MT5 Optimization: Coded from the ground up for MT5 using Handle-based indicators for lightning-fast performance and minimal CPU usage.
-
Smart Pip Offset: Chart arrows automatically adjust their distance from the candlesticks based on your broker's digit structure (4-digit or 5-digit), keeping the main chart pristine.
Input Parameters / Settings
════════ MACD Settings ════════
-
Fast EMA Period (12): The period for the fast Exponential Moving Average.
-
Slow EMA Period (26): The period for the slow Exponential Moving Average.
-
Signal SMA Period (9): The period for the Signal Line.
-
Applied Price (Close): The price type used for calculations.
════════ Arrow Settings ════════
-
Buy / Sell Arrow Color: Customize the colors for your signals on the main chart.
-
Arrow Width: Adjust the size/thickness of the signal arrows.
-
Pip Offset: The distance (in pips) between the price candlestick and the signal arrow.
════════ Breakout Level Line ════════
-
Show Level Line (True/False): Toggle the visual breakout threshold lines in the sub-window.
-
Buy / Sell Level Color: Customize the colors of the horizontal breakout lines.
-
Level Line Width & Style: Adjust the thickness and style (Solid, Dash, Dot, etc.) of the reference lines.
════════ Notification Settings ════════
-
Enable Popup Alert: On-screen MT5 terminal alerts.
-
Enable Email Notification: Sends alerts to your configured email.
-
Enable Mobile Push Notification: Sends instant alerts to your MetaTrader mobile app.
-
Alert on New Bar Only (True): Highly recommended. Ensures alerts are only sent when a signal is permanently locked in on a closed bar.
-
Alert Prefix: Custom text tag (e.g., "MACD BO") added to your alerts so you can easily identify the strategy.
Trading Recommendations
-
Timeframes: Excellent for day trading and swing trading (M15, H1, H4, and D1).
-
Instruments: Suitable for Forex majors, Gold (XAUUSD), and global Indices.
-
Pro Tip: Use the new Breakout Level Lines in the sub-window to gauge the strength of the breakout. A candle that closes significantly past this line indicates high momentum and a higher probability of a winning trade!