SessionsRangeZone

 RangeZone Indicator

🌍 General Overview: Global Exchange Trading from East to West

World financial markets operate on the principle of continuous trading sessions, where activity moves with the sun from one financial center to another. Understanding this dynamic is key to successful trading!

How Trading Moves Around the World:

Asian Session (Sydney, Tokyo):

  • Opens first, sets the tone for daily volatility

  • Japanese yen, Australian dollar, Asian indices

  • Often forms key support/resistance levels

European Session (London):

  • European financial center - high liquidity

  • Euro, British pound, European stocks

  • Overlap with Asian session creates increased activity

American Session (New York):

  • World's largest financial market

  • USD, Canadian dollar, American stocks

  • Overlap with European session - peak trading day

Why This Matters:

  • 📈 Volatility: Session opening times are periods of increased activity

  • 💰 Liquidity: Session overlaps increase trading volumes

  • 🎯 Key Levels: First hours of sessions form important price levels

  •  Trading Opportunities: Each session has characteristic patterns

⚙️ Installation and Indicator Settings

Simple Installation:

  1. Download  Market_Sessions_RZ.mq5  file

  2. Move to MQL5/Indicators folder of your terminal

  3. Restart MetaTrader 5

  4. Find in navigator and drag to chart

Arsenal of Settings - Complete Control:

Session Settings:

text

InpStartSidney = 0 // Sydney session start (hour) InpEndSidney = 9 // Sydney session end InpColorSidney = clrOrange // Session color

Similarly for Tokyo, London and New York

Visual Settings:

  • InpWidth = 60  - Displayed session height

  • InpShowLabels = INPUT_YES  - Show session names

  • InpShowRange = INPUT_YES  - Show session ranges

  • InpShowVLines = INPUT_YES  - Session start vertical lines

Range Zones Settings:

  • InpRZ_StartHour = 9  - Zone start hour

  • InpRZ_StartMinute = 0  - Zone start minute

  • InpRZ_EndHour = 10  - Zone end hour

  • InpRZ_ZoneColor = clrBlue  - Zone fill color

  • InpRZ_FillZone = true  - Zone filling

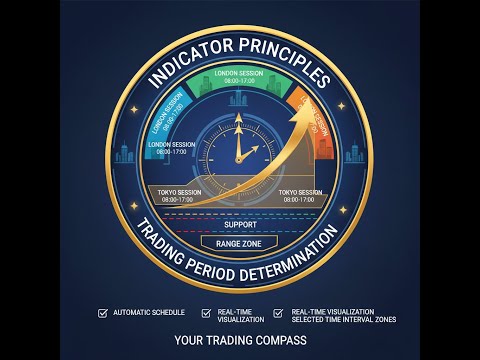
📊 Principles of Trading Period Determination

How the Indicator Defines Sessions:

Automatic Schedule:

  • Accounts for time zones of each financial center

  • Correctly handles sessions crossing midnight

  • Automatically adapts to weekends and holidays

Real-time Visualization:

  • Colored zones of active sessions

  • Labels with names and operating hours

  • Dynamic updates as market moves

Selected Time Interval Zones:

Range Zones - Your Trading Compass:

  • Show price range for selected period

  • Visualize key support/resistance levels

  • Help determine trend direction

Usage Advantages:

  • 🎯 Accuracy: Real price levels instead of subjective lines

  •  Time: Binding to specific trading periods

  • 📊 Clarity: Clear chart visualization

  • 🔄 Automation: Elimination of manual drawing

🎯 First Bar Zone: Heart of Trading Session

Drawing Rules and Timeframe Selection:

Key Setting:

text
InpSessionRangeTF = PERIOD_H1  // Timeframe for session's first bar

Working Principle:
The indicator identifies the first complete bar of session start on selected timeframe and builds price range from High to Low of this bar.

Why This Matters:

  • First session bar contains maximum information about market participants' intentions

  • Its range often becomes key level for entire trading day

  • Breaking this range signals bulls/bears strength

Trading Strategy Examples:

🏆 Strategy 1: "Session Breakout" (ICT Concept)

Timeframe: M15-H1
Rules:

  1. Wait for London session first bar zone formation

  2. On bounce from upper/lower boundary - enter in session direction

  3. Stop-loss beyond opposite zone boundary

  4. Take-profit at distance equal to zone width

Real Example:
EUR/USD, London session, first H1 bar with range 1.0850-1.0860. Bounce from 1.0850 and move to 1.0880 (target = 1.0850 + 30 pips).

🏆 Strategy 2: "Session Overlap" (Smart Money)

Timeframe: M5-M30
Rules:

  1. Mark London and New York session overlap zones

  2. Look for first bar zone breakout in general trend direction

  3. Enter on volume and momentum confirmation

  4. Use zone boundaries as dynamic levels

Real Example:
GBP/USD, session overlap 15:00-16:00 MSK. Upper boundary breakout of New York zone with volume increase - long entry.

🏆 Strategy 3: "Price Action Inside Zone"

Timeframe: M1-M15
Rules:

  1. Define current session first bar zone

  2. Trade from zone boundaries using Price Action patterns

  3. Inside zone - scalping, zone breakout - trend trading

  4. Combine with Fibonacci levels from zone

Real Example:
Gold, Asian session, zone 1815-1820. "Double bottom" pattern formation at lower boundary - long entry.

🏆 Strategy 4: "Multi-timeframe Analysis"

Timeframes: H1 + M15
Rules:

  1. Identify key session zone on H1

  2. Look for entries on M15 in breakout/bounce direction

  3. Use multiple sessions for confirmation (e.g., London + New York)

  4. Risk management based on zone width

🏆 Strategy 5: "Seasonal Arbitrage Opportunities"

Timeframe: H4-D1
Rules:

  1. Analyze historical data for different session zones

  2. Identify seasonal patterns (e.g., Asian flat + European trend)

  3. Build strategy on statistical probability of movements

  4. Hedge positions between correlated instruments

💎 Conclusions: Why This Indicator Will Change Your Trading

Trader Advantages:

  •  Time Saving: Automation of routine session analysis

  •  Improved Accuracy: Objective levels instead of subjective drawings

  •  Versatility: Suitable for any trading style and instruments

  •  Education: Deeper understanding of market structure and smart money behavior

Who This Indicator Is For:

  • 📊 Beginner Traders: Quick understanding of market structure

  • 🎯 Professionals: Precise entries and advanced strategies

  •  Busy People: Saving hours of daily analysis

  • 🔍 Analysts: Deep research of market patterns

Limited Offer:

The indicator is already included in the arsenal of successful traders worldwide. Join the community of professionals!

📞 For Contact and Purchase:
Telegram: @TrendHunterEA
Don't Miss the Opportunity to Turn Market Sessions into Your Source of Stable Income!

P.S. Remember: successful trading requires not only good tools but also discipline, risk management and continuous learning. Market Sessions RZ gives you the necessary advantage!


Produtos recomendados
SMMA Bands Indicator
Elie Baptiste Granger
The SMMA Bands indicator is an advanced volatility-based trading tool that creates 6 dynamic support and resistance levels around an envelope formed by two Smoothed Moving Averages (SMMA).  This indicator combines the reliability of SMMA trend identification with the precision of standard deviation-based volatility bands, making it suitable for both trend-following and mean-reversion strategies. Every band has its own buffer for use in EA. feel free to make suggestions and add reviews , i will
Mega Spikes Max
Niccyril Chirindo
1 (2)
Mega Spikes Max is a specialized indicator for Boom and Crash synthetic indices that generates trading signals with automatic alert notifications. Features The indicator analyzes market conditions using proprietary algorithms and displays buy/sell arrows directly on the chart. It works specifically with Boom and Crash indices on M5 timeframe. Signal generation combines multiple technical analysis methods to identify potential trading opportunities. The system provides two TP levels and SL calcu
SlopeChannelB MT5
MIKHAIL VINOGRADOV
SlopeChannelB – uma ferramenta de análise técnica que constrói um canal de movimento de preços inclinado, oferecendo oportunidades únicas para avaliar a situação atual do mercado e encontrar sinais de negociação. Características principais do indicador: Canal de movimento de preços inclinado : O indicador ajuda a visualizar os níveis de suporte e resistência, que podem indicar pontos potenciais de reversão ou continuação da tendência. Várias cores de linhas e destaque de fundo : Os níveis d
Advanced Trading Chaos  The main purpose of the indicator is to help the trader detect the signals described by Bill Williams in his books to make a quick and correct trading decision. 1)Bullish/Bearish Reversal Bar(BDB) 2) Divergent Bar(DB) 3) Second Sage Signal — the third consecutive Awesome Oscillator bar  4) Working fractals (Fractals that worked above/below the red forehead  5) Three bar coloring modes 5.1) Coloring of bars according to the AO indicator (Including the squatting bar) 5.2
JAC Trend Color Candle
Eduardo Da Costa Custodio Santos
O indicador "JAC  Trend Color Candle" para Meta Trader 5, foi criado para facilitar visualmente a tendência para o trader. Ele tem como base três parâmetros, que identifica a tendência de alta, tendência de baixa e mercado sem tendência. As cores são podem ser configuradas pelo trader, e a média também pode ser configurada pelo trader. os parâmetros de tendência não podem ser configurados, pois, são o diferencial do indicador.
Ichimoku Aiko MTF
Michael Jonah Randriamampionontsoa
Ichimoku Aiko MTF is a collection of technical indicators that show support and resistance levels, as well as momentum and trend direction. It is a multi-timeframe indicator so you don't need to change the chart timeframe when you want to see the ichimoku clouds on a higher timeframe.  eg. The chart timeframe is M15 and you want to see on the M15 timeframe chart the H1 ichimoku indicators (the ichimoku in Metatrader can't do that) that's why you need to use Ichimoku Aiko MTF.
The " Stochastic Advanced " indicator displays the signals of the 'Stochastic" indicator directly on the chart without the presence of the indicator itself at the bottom of the screen. The indicator signals can be displayed not only on the current timeframe, but also on a timeframe one level higher. In addition, we have implemented a filter system based on the Moving Average indicator. Manual (Be sure to read before purchasing) | Version for MT4 Advantages 1. Displaying the signals of the "Stoch
Trend Lines Scalper
Magdalena Estefania Colonna
TREND LINES Scalper Professional Indicator OVERVIEW Trend Lines Scalper is a highly accurate, advanced indicator designed specifically for professional traders looking to maximize their scalping opportunities by automatically detecting trend lines and high-probability signals. This powerful algorithm combines classic technical analysis with modern technology, automatically identifying price patterns and generating accurate, real-time signals for successful scalping trades. MAIN FEATURES
The indicator detects divergence signals - the divergences between the price peaks and the MACD oscillator values. The signals are displayed as arrows in the additional window and are maintained by the messages in a pop-up window, e-mails and push-notifications. The conditions which formed the signal are displayed by lines on the chart and in the indicator window. The indicator parameters MacdFast - fast MACD line period MacdSlow - slow MACD line period MacdSignal - MACD signal line period Macd
Fit line supports to extrapolation next movement of market, support for buy/sell decision. Indicator using spline algorithm to extrapolation.  You can change number of spline with parameter "PointsNumber" and number of extrapolation point with "ExtrapolateBars". Eextrapolation points will be save into csv format, with prefix in parameter "PointsPrefix", and store in folder File of Data Folder.
Divergence MACD indicator shows price and MACD indicator divergence. The indicator is not redrawn! The algorithm for detection of price and MACD extremums has been balanced for the earliest entry allowing you to use the smallest SL order possible. The indicator displays all types of divergences including the hidden one, while having the minimum number of settings. Find out more about the divergence types in Comments tab. Launch settings: Max Bars - number of bars calculated on the chart. Indent
RED ZONE Monitor Loss-Cut & Break-Even Risk Monitor for Averaging Traders (MT5) RED ZONE Monitor is a risk management indicator for traders who use averaging, scaling-in, or multiple open positions . It visually displays: The loss-cut (liquidation) risk zone The break-even price Based on current open positions, lots, and margin conditions This indicator does not provide entry signals. It does not promise profits. It shows where your account actually fails if price moves against you. What RED ZO
O indicador ROMAN5 Time Breakout desenha automaticamente caixas de suporte e resistência diárias para rompimentos. Ajuda o usuário a identificar o momento de comprar ou vender. Vem com um alerta sonoro sempre que um novo sinal aparece. Ele também possui a facilidade de enviar e-mail. O seu endereço de e-mail e configurações do servidor SMTP devem ser especificados na janela de configurações do guia "Email" no seu MetaTrader 5. Seta para cima azul = Comprar Seta para baixo vermelha = Vender. Você
FREE
Padrão de barras de acumulação do indicador Crypto_Forex para MT5. - O indicador "Accumulation Bar" é um indicador muito poderoso focado em ruturas para a negociação de Price Action. - O indicador deteta a acumulação de preço em área estreita durante 1 barra e mostra: direção de rutura, ordem pendente e localizações de SL. - Barra de acumulação de alta - Sinal de seta azul no gráfico (ver imagens). - Barra de acumulação de baixa - Sinal de seta vermelha no gráfico (ver imagens). - Sem repintur
The Market Structure Trend Targets is a powerful trading indicator designed to give traders a clear, structured, and data-driven view of market momentum, breakouts, and key price reaction zones. Built on the principles of smart market structure analysis , it helps identify not only trend direction, but also precise breakout levels , trend exhaustion , and potential reversal zones — all with visual clarity and trader-friendly metrics. Key Features Breakout Points with Numbered Markers Track signi
Renko System
Marco Montemari
This indicator can be considered as a trading system. It offers a different view to see the currency pair: full timeless indicator, can be used for manual trading or for automatized trading with some expert advisor. When the price reaches a threshold a new block is created according to the set mode. The indicator beside the Renko bars, shows also 3 moving averages. Features renko mode median renko custom median renko 3 moving averages wicks datetime indicator for each block custom notification
The indicator detects and displays М. Gartley's Butterfly pattern. The pattern is plotted by the extreme values of the ZigZag indicator (included in the resources, no need to install). After detecting the pattern, the indicator notifies of that by the pop-up window, a mobile notification and an email. The pattern and wave parameters are displayed on the screenshots. The default parameters are used for demonstration purposes only in order to increase the amount of detected patterns. Parameters z
Order Book, known also as Market Book, market depth, Level 2, - is a dynamically updated table with current volumes of orders to buy and to sell specific financial instument at price levels near Bid and Ask. MetaTrader 5 provides the means for receiving market book from your broker, but in real time only, without access to its history. The indicator OrderBook Cumulative Indicator accumulates market book data online and visualizes them on the chart. In addition, the indicator can show the market
KDJ Index 4   交易实用必备工具指标 波浪自动计算指标,通道趋势交易 完美的趋势-波浪自动计算通道计算 , MT4版本 完美的趋势-波浪自动计算通道计算 , MT5版本 本地跟单复制交易 Easy And Fast Copy , MT4版本 Easy And Fast Copy , MT5版本 本地跟单复制交易 模拟试用 Easy And Fast Copy , MT4 模拟账号运行 Easy And Fast Copy , MT5 模拟账号运行 "Cooperative QQ:556024  "  "Cooperation wechat:556024"  "Cooperative email:556024@qq.com" 强烈推荐趋势指标, 波浪的标准自动计算   和   波浪的标准自动计算MT5版本     KDJ指标又叫 随机指标 ,是一种相当新颖、实用的技术分析指标,它起先用于期货市场的分析,后被广泛用于股市的中短期趋势分析,是期货和股票市场上最常用的技术分析工具。 随机指标KDJ一般是用于股票分析的统计体系,根据统计学原理,通过一个特定的周期(常为9日、9周等)
LT Rainbow Trend
Thiago Duarte
5 (1)
Você, assim como eu, gosta de operar a favor da tendência? Então este indicador vai te ajudar! Rainbow Trend é um indicador de tendência, no qual utiliza várias Médias Móveis junto do gráfico. Ela mede diferentes zonas de força da tendência para diferentes prazos: muito curto, curto, médio, longo e muito longo. Cada zona tem sua cor, e é possível ter alertas sonoros quando o preço sai de uma zona e entra em outra. Sua configuração é muito simples. Se encontrou alguma falha ou tem alguma sugestão
Visual Dolphin Indicator
AL MOOSAWI ABDULLAH JAFFER BAQER
Visual Dolphin Indicator Unlock the rhythm of the market with the Visual Dolphin Indicator, your ultimate tool for identifying and capitalizing on market trends with clarity and confidence. Designed for both novice and experienced traders, this indicator eliminates the noise and guesswork, providing crystal-clear buy and sell signals directly on your chart. The Logic Behind the Waves The core of the Visual Dolphin Indicator is a sophisticated yet intuitive dual-wave system based on moving avera
Auto Optimized RSI   é um indicador de setas inteligente e fácil de usar, projetado para fornecer sinais de negociação precisos. Ele utiliza simulações de trades com dados históricos para identificar automaticamente os níveis de compra e venda de RSI mais eficazes para cada instrumento e período gráfico. Este indicador pode ser usado como um sistema de negociação independente ou como parte da sua estratégia atual. É especialmente útil para traders de curto prazo. Diferente dos níveis fixos tradi
The   Trendlines Oscillator   helps traders identify trends and momentum based on the normalized distances between the current price and the most recently detected bullish and bearish trend lines. The indicator features bullish and bearish momentum, a signal line with crossings, and multiple smoothing options. USAGE The   Trendlines Oscillator   works by systematically: Identifying pivot highs and lows. Connecting pivots to form bullish (support) and bearish (resistance) trendlines. Measuring
AW Heiken Ashi MT5
AW Trading Software Limited
AW Heiken Ashi — Indicador inteligente de tendência e níveis de TP. Indicador avançado baseado no Heiken Ashi clássico, adaptado para traders, com maior flexibilidade e clareza. Ao contrário do indicador padrão, o AW Heiken Ashi ajuda a analisar a tendência, determinar metas de lucro e filtrar sinais falsos, proporcionando decisões de negociação mais seguras. Guia de configuração e instruções - Aqui / Versão MT4 - Aqui Vantagens do AW Heiken Ashi: Funciona em qualquer ativo e período de tempo, A
Donchian Channel DC is the indicator of Donchian Channels, that plots maximum and minimum values of a specific period, besides mean value line. It´s possible to configure simple period for analysis and the indicator will plot all three values. You can trade with this indicator as trend or reversal, according to each strategy. Do not let to test others indicators as soon as others expert advisors.
All about time and price by ICT. This indicator provides a comprehensive view of ICT killzones, Silver Bullet times, and ICT Macros, enhancing your trading experience.  In those time windows price either seeks liquidity or imbalances and you often find the most energetic price moves and turning points. Features: Automatic Adaptation: The ICT killzones intelligently adapt to the specific chart you are using. For Forex charts, it follows the ICT Forex times: In EST timezone: Session: Asia: 20h00-0
Owl Smart Levels MT5
Sergey Ermolov
4.03 (32)
Versão MT4  |  FAQ O Indicador Owl Smart Levels é um sistema de negociação completo dentro de um indicador que inclui ferramentas populares de análise de mercado, como fractais avançados de Bill Williams , Valable ZigZag que constrói a estrutura de onda correta do mercado e níveis de Fibonacci que marcam os níveis exatos de entrada no mercado e lugares para obter lucros. Descrição detalhada da estratégia Instruções para trabalhar com o indicador Consultor de negociação Owl Helper Chat privado d
Signal Strike
Murtadha Majid Jeyad Al-Khuzaie
Signal Strike is a professional trading indicator designed for MetaTrader 5 that delivers clear, high‑confidence entry signals directly on your chart. Built with advanced logic that combines trend, momentum, volatility, and volume confirmation, this tool helps traders identify precise BUY and SELL opportunities with confidence. Unlike generic indicators, Signal Strike is engineered to filter out indecision candles and weak setups. When conditions align, the indicator plots entry, stop loss, an
Fractal Advanced MT5
Siarhei Vashchylka
5 (6)
Fractal Advanced - displays Fractal and Alligator indicators on the price chart. Has wide options for settings and customization. It is also equipped with alerts and a hotkey system. Manual (Be sure to read before purchasing) | Version for MT4 Advantages 1. The indicator does not fill the entire chart with fractals, but allows you to display only relevant signals. 2. The number of fractals is adjusted by scrolling the mouse while holding down the Shift key. 3. Instantly show/hide the Alligator
Statistical Arbitrage Spread Generator for Cointegration [MT5] What is Pair Trading? Pair trading is a market-neutral strategy that looks to exploit the relative price movement between two correlated assets — instead of betting on the direction of the market. The idea? When two assets that usually move together diverge beyond a statistically significant threshold, one is likely mispriced. You sell the expensive one, buy the cheap one , and profit when they converge again. It’s a statistica
FREE
Os compradores deste produto também adquirem
Se você comprar este indicador, receberá meu Gerenciador de Operações Profissional + EA  GRATUITAMENTE. Primeiramente, vale ressaltar que este Sistema de Trading é um Indicador Não Repintado, Não Redesenho e Não Atrasado, o que o torna ideal tanto para o trading manual quanto para o automatizado. Curso online, manual e download de predefinições. O "Sistema de Trading Inteligente MT5" é uma solução completa de trading projetada para traders novos e experientes. Ele combina mais de 10 indicadores
Divergence Bomber
Ihor Otkydach
4.96 (76)
Cada comprador deste indicador recebe adicionalmente, e de forma gratuita: A ferramenta exclusiva "Bomber Utility", que acompanha automaticamente cada operação, define os níveis de Stop Loss e Take Profit e fecha operações de acordo com as regras da estratégia; Arquivos de configuração (set files) para ajustar o indicador em diferentes ativos; Set files para configurar o Bomber Utility nos modos: "Risco Mínimo", "Risco Balanceado" e "Estratégia de Espera"; Um vídeo tutorial passo a passo que aju
***Entry In The Zone and SMC Multi Timeframe é uma ferramenta de análise de mercado em tempo real desenvolvida com base nos Smart Money Concepts (SMC). Ela foi projetada para ajudar os traders a analisarem a estrutura do mercado de forma sistemática e obterem uma visão mais clara da direção geral do mercado. O sistema analisa automaticamente Pontos de Reversão, Zonas-Chave e a Estrutura de Mercado em múltiplos timeframes, enquanto exibe Points of Interest (POI), sinais sem repaint e níveis autom
FX Power MT5 NG
Daniel Stein
5 (28)
FX Power: Analise a Força das Moedas para Decisões de Negociação Mais Inteligentes Visão Geral FX Power é a sua ferramenta essencial para compreender a força real das principais moedas e do ouro em quaisquer condições de mercado. Identificando moedas fortes para comprar e fracas para vender, FX Power simplifica as decisões de negociação e revela oportunidades de alta probabilidade. Quer você prefira seguir tendências ou antecipar reversões usando valores extremos de Delta, esta ferramenta adap
Gold Sniper Scalper Pro
Ich Khiem Nguyen
3.29 (7)
Gold Sniper Scalper Pro - Sistema de Negociação de Ouro (XAU/USD) no MetaTrader 5 Para o negociador sério: Aborde a negociação de Ouro com uma metodologia estruturada e baseada em dados que combina múltiplos fatores de análise de mercado. Esta ferramenta foi construída para apoiar a sua análise de negociação de Ouro. Oportunidade de Preço Limitada Esta é uma chance de possuir o Gold Sniper Scalper Pro antes que o preço aumente. O preço do produto aumentará $50 após cada 10 compras subsequentes.
Atomic Analyst MT5
Issam Kassas
4.19 (27)
Primeiramente, vale ressaltar que este Indicador de Negociação não repinta, não redesenha e não apresenta atrasos, tornando-o ideal tanto para negociação manual quanto automatizada. Manual do utilizador: configurações, entradas e estratégia. O Analista Atômico é um Indicador de Ação de Preço PA que utiliza a força e o momentum do preço para encontrar uma vantagem melhor no mercado. Equipado com filtros avançados que ajudam a remover ruídos e sinais falsos, e aumentam o potencial de negociação.
Azimuth Pro
Ottaviano De Cicco
5 (1)
PROMOÇÃO DE LANÇAMENTO O preço do Azimuth Pro está inicialmente definido em 299 $ para os primeiros 100 compradores. O preço final será de 499 $. A DIFERENÇA ENTRE ENTRADAS RETAIL E INSTITUCIONAIS NÃO É O INDICADOR — É A LOCALIZAÇÃO. A maioria dos traders entra em níveis de preço arbitrários, perseguindo momentum ou reagindo a sinais atrasados. As instituições esperam o preço atingir níveis estruturados onde oferta e demanda realmente mudam. Azimuth Pro mapeia esses níveis automaticamente: V
Quantum TrendPulse
Bogdan Ion Puscasu
5 (20)
Apresentando   Quantum TrendPulse   , a ferramenta de negociação definitiva que combina o poder do   SuperTrend   ,   RSI   e   Stochastic   em um indicador abrangente para maximizar seu potencial de negociação. Projetado para traders que buscam precisão e eficiência, este indicador ajuda você a identificar tendências de mercado, mudanças de momentum e pontos de entrada e saída ideais com confiança. Principais características: Integração SuperTrend:   siga facilmente a tendência predominante do
Trend indicator AI mt5
Ramil Minniakhmetov
5 (13)
O indicador Trend Ai é uma ótima ferramenta que irá melhorar a análise de mercado de um trader, combinando a identificação de tendências com pontos de entrada acionáveis e alertas de reversão. Este indicador permite que os usuários naveguem pelas complexidades do mercado forex com confiança e precisão Além dos sinais primários, o indicador Trend Ai identifica pontos de entrada secundários que surgem durante retrações ou retrações, permitindo que os comerciantes capitalizem as correções de preço
Antes de tudo, vale ressaltar que esta Ferramenta de Negociação é um Indicador Não Repintante, Não Redesenhante e Não Atrasado, o que a torna ideal para negociação profissional. Curso online, manual do utilizador e demonstração. O Indicador de Conceitos de Ação de Preço Inteligente é uma ferramenta muito poderosa tanto para traders novos quanto experientes. Ele combina mais de 20 indicadores úteis em um único, combinando ideias avançadas de negociação como Análise do Trader do Círculo Interno
Grabber System MT5
Ihor Otkydach
4.81 (21)
Apresento a você um excelente indicador técnico: Grabber, que funciona como uma estratégia de trading “tudo incluído”, pronta para usar. Em um único código estão integradas ferramentas poderosas de análise técnica de mercado, sinais de entrada (setas), funções de alertas e notificações push. Cada comprador deste indicador também recebe gratuitamente: Utilitário Grabber: ferramenta para gerenciamento automático de ordens abertas Vídeo tutorial passo a passo: como instalar, configurar e operar com
SynaptixQuant Dominance Matrix
Devie Arevalo Montemayor
5 (1)
SynaptixQuant Dominance Matrix: Institutional-Grade Market State Extraction Engineered for traders who require a data-driven view of market behaviour beyond surface-level indicators. The Synaptix Quant (SQ) Dominance Matrix is not a conventional currency strength display. Behind its intentionally streamlined interface runs a sophisticated analytical architecture designed to quantify market conditions with precision. Every output is generated through layered signal processing built to identify d
ARIPoint
Temirlan Kdyrkhan
1 (1)
ARIPoint is a powerful trading companion designed to generate high-probability entry signals with dynamic TP/SL/DP levels based on volatility. Built-in performance tracking shows win/loss stats, PP1/PP2 hits, and success rates all updated live. Key Features: Buy/Sell signals with adaptive volatility bands Real-time TP/SL/DP levels based on ATR Built-in MA Filter with optional ATR/StdDev volatility Performance stats panel (Success, Profit/Loss, PP1/PP2) Alerts via popup, sound, push, or email Cu
Berma Bands
Muhammad Elbermawi
5 (7)
O indicador Berma Bands (BBs) é uma ferramenta valiosa para traders que buscam identificar e capitalizar tendências de mercado. Ao analisar a relação entre o preço e os BBs, os traders podem discernir se um mercado está em uma fase de tendência ou de variação. Visite o [ Blog Berma Home ] para saber mais. As Bandas de Berma são compostas por três linhas distintas: a Banda de Berma Superior, a Banda de Berma Média e a Banda de Berma Inferior. Essas linhas são plotadas em torno do preço, criando u
FX Volume MT5
Daniel Stein
4.79 (24)
FX Volume: Vivencie o Verdadeiro Sentimento de Mercado sob a Perspectiva de um Corretor Visão Geral Rápida Quer aprimorar sua abordagem de trading? FX Volume fornece insights em tempo real sobre como traders de varejo e corretores estão posicionados—bem antes de relatórios atrasados como o COT. Seja para buscar ganhos consistentes ou simplesmente ter uma vantagem mais clara no mercado, FX Volume ajuda você a detectar grandes desequilíbrios, confirmar rompimentos e aperfeiçoar sua gestão de ris
ACB Breakout Arrows MT5
KEENBASE SOFTWARE SOLUTIONS
5 (1)
O indicador ACB Breakout Arrows fornece um sinal de entrada crucial no mercado ao detectar um padrão especial de rompimento. O indicador escaneia constantemente o gráfico em busca de um momento de consolidação em uma direção e fornece o sinal preciso logo antes do movimento principal. Obtenha o scanner de múltiplos ativos e múltiplos períodos aqui - Scanner para ACB Breakout Arrows MT5 Principais recursos Níveis de Stop Loss e Take Profit são fornecidos pelo indicador. Acompanha um painel Scan
Super Signal – Skyblade Edition Sistema profissional de sinais de tendência sem repintar / sem atraso com taxa de acerto excepcional | Para MT4 / MT5 Principais características: Super Signal – Skyblade Edition é um sistema inteligente de sinais desenvolvido especificamente para operações com tendência. Utiliza uma lógica de filtragem em múltiplas camadas para detectar apenas movimentos direcionais fortes sustentados por verdadeiro momentum. Este sistema   não tenta prever topos ou fundos . Ele
Atbot
Zaha Feiz
4.62 (55)
AtBot: Como funciona e como usá-lo ### Como funciona O indicador "AtBot" para a plataforma MT5 gera sinais de compra e venda usando uma combinação de ferramentas de análise técnica. Ele integra a Média Móvel Simples (SMA), a Média Móvel Exponencial (EMA) e o índice de Faixa Verdadeira Média (ATR) para identificar oportunidades de negociação. Além disso, pode utilizar velas Heikin Ashi para melhorar a precisão dos sinais. Deixe uma avaliação após a compra e receba um presente especial. ### Princ
TPSproTREND PrO MT5
Roman Podpora
4.74 (19)
O TPSproTrend PRO identifica o momento em que o mercado realmente muda de direção e cria um ponto de entrada no início do movimento. Você entra no mercado quando o preço está apenas começando a se mover, e não depois que o movimento já ocorreu.   Indicador       Não redesenha os sinais e exibe automaticamente os pontos de entrada, Stop Loss e Take Profit, tornando a negociação clara, visual e estruturada. INSTRUÇÕES EM RUSSO   -   VERSÃO MT4 Principais vantagens Sinalização sem redesenho.   Tod
Volatility Master for MetaTrader is a real-time dashboard tool that scans up to 56 symbols using up to 2 flexible dashboards on different charts to identify high-volatility, trending markets instantly. With clear bullish/bearish signals, customizable alerts, and a user-friendly interface, it helps you avoid range-bound conditions and focus on high-probability trades. Clarity leads to confidence. Trade confidently and protect your capital effectively with this powerful dashboard. Setup & Guide: 
Elliott Wave Trend was designed for the scientific wave counting. This tool focuses to get rid of the vagueness of the classic Elliott Wave Counting using the guideline from the template and pattern approach. In doing so, firstly Elliott Wave Trend offers the template for your wave counting. Secondly, it offers Wave Structural Score to assist to identify accurate wave formation. It offers both impulse wave Structural Score and corrective wave Structure Score. Structural Score is the rating to sh
Trend Forecaster
Alexey Minkov
5 (7)
The Trend Forecaster indicator utilizes a unique proprietary algorithm to determine entry points for a breakout trading strategy. The indicator identifies price clusters, analyzes price movement near levels, and provides a signal when the price breaks through a level. The Trend Forecaster indicator is suitable for all financial assets, including currencies (Forex), metals, stocks, indices, and cryptocurrencies. You can also adjust the indicator to work on any time frames, although it is recommen
Quantas vezes você comprou um indicador de negociação com ótimos backtests, prova de desempenho em conta real com números fantásticos e estatísticas por toda parte, mas depois de usá-lo, você acaba perdendo sua conta? Você não deve confiar em um sinal por si só, você precisa saber por que ele apareceu em primeiro lugar, e é isso que o RelicusRoad Pro faz de melhor! Manual do Usuário + Estratégias + Vídeos de Treinamento + Grupo Privado com Acesso VIP + Versão Móvel Disponível Uma Nova Maneira d
Quantum Trend Sniper
Bogdan Ion Puscasu
4.74 (53)
Apresentando       Quantum Trend Sniper Indicator   , o inovador Indicador MQL5 que está transformando a maneira como você identifica e negocia as reversões de tendência! Desenvolvido por uma equipe de traders experientes com experiência comercial de mais de 13 anos,       Indicador de Atirador de Tendência Quântica       foi projetado para impulsionar sua jornada de negociação a novos patamares com sua forma inovadora de identificar reversões de tendência com precisão extremamente alta. ***Com
PZ Swing Trading MT5
PZ TRADING SLU
5 (5)
Swing Trading é o primeiro indicador projetado para detectar oscilações na direção da tendência e possíveis oscilações de reversão. Ele usa a abordagem de negociação de linha de base, amplamente descrita na literatura de negociação. O indicador estuda vários vetores de preço e tempo para rastrear a direção da tendência agregada e detecta situações nas quais o mercado está sobrevendido ou sobrecomprado em excesso e pronto para corrigir. [ Guia de instalação | Guia de atualização | Solução de prob
Advanced Supply Demand MT5
Bernhard Schweigert
4.5 (14)
Atualmente com 33% de desconto! A melhor solução para qualquer Trader Novato ou especialista! Este indicador é uma ferramenta de negociação exclusiva, de alta qualidade e acessível porque incorporamos uma série de recursos proprietários e uma nova fórmula. Com esta atualização, você poderá mostrar fusos horários duplos. Você não só será capaz de mostrar um TF mais alto, mas também mostrar ambos, o TF do gráfico, MAIS o TF mais alto: MOSTRANDO ZONAS ANINHADAS. Todos os traders de Oferta e Demanda
Este é um indicador para MT5 que fornece sinais precisos para entrar em uma negociação sem redesenhar. Ele pode ser aplicado a qualquer ativo financeiro: forex, criptomoedas, metais, ações, índices. Ele fornecerá estimativas bastante precisas e informará quando é melhor abrir e fechar um negócio. Assista o vídeo (6:22) com um exemplo de processamento de apenas um sinal que compensou o indicador! A maioria dos traders melhora seus resultados de negociação durante a primeira semana de negociação c
Este painel mostra os últimos   padrões harmónicos   disponíveis para os símbolos seleccionados, pelo que poupará tempo e será mais eficiente /   versão MT4 . Indicador gratuito:   Basic Harmonic Pattern Colunas do indicador Symbol :   aparecem os símbolos seleccionados Trend :   de alta ou de baixa Pattern :   tipo de padrão (gartley, borboleta, morcego, caranguejo, tubarão, cifra ou ABCD) Entry :   preço de entrada SL:   preço de paragem de perda TP1:   preço do 1º take profit TP2:   preço
Gartley Hunter Multi
Siarhei Vashchylka
5 (11)
Gartley Hunter Multi - An indicator for searching for harmonic patterns simultaneously on dozens of trading instruments and on all possible timeframes. Manual (Be sure to read before purchasing) | Version for MT4 Advantages 1. Patterns: Gartley, Butterfly, Shark, Crab. Bat, Alternate Bat, Deep Crab, Cypher 2. Simultaneous search for patterns on dozens of trading instruments and on all possible timeframes 3. Search for patterns of all possible sizes. From the smallest to the largest 4. All fou
Cansado de traçar linhas de suporte e resistência? A Resistência de suporte é um indicador de período múltiplo que detecta e plota automaticamente linhas de suporte e resistência no gráfico com um toque muito interessante: conforme os níveis de preços são testados ao longo do tempo e sua importância aumenta, as linhas se tornam mais espessas e mais escuras. [ Guia de instalação | Guia de atualização | Solução de problemas | FAQ | Todos os produtos ] Melhore sua análise técnica da noite para o d
Mais do autor
RealChannel
Vladimir Utkin
1 (1)
The indicator based on the trading channel in the MT5 trading terminal is a tool that automatically builds a channel formed by the peaks of the price chart in an upward and downward sequence. This indicator helps traders identify support and resistance levels, market trends, as well as set stop-loss and take-profit levels for optimal trade management. This version of the indicator is equipped with a basic trading logic, which can be disabled in the settings and used as an indicator for your tra
FREE
Cazador de Oro
Vladimir Utkin
Инструкция по использованию советника TrendHanter для MetaTrader 5 1. Установка советника Скопируйте файлы : Поместите файл   TrendHanter.ex5   в папку: MT5 → MQL5 → Experts Запуск советника : Откройте MT5. Перетащите   TrendHanter   из раздела «Советники» на нужный график. Во вкладке «Общие» разрешите: Автоматическую торговлю   Разрешить оповещения 2. Настройка параметров Во вкладке «Параметры» настройте: Группа параметров Ключевые настройки Описание Stochastic InpKPeriod=14 ,   InpDPeriod=3
The Tick Volume Balance indicator is created based on the tick volumes of the instrument on the selected timeframe, taking into account the trading balance of supply and demand prices. The indicator considers the nature of candle formation used in the Price Action strategy. With equal volume, a regular candle and a candle with a pattern will have a larger size and will be colored according to its pattern. I would like to note that large volume candles colored in bullish and bearish colors at t
In the fast-paced world of cryptocurrency trading, understanding market dynamics is crucial for making informed decisions. One of the key indicators that traders use to analyze market behavior is Volume Delta, which offers insights into the balance between buying and selling pressure. This article explores the concept of Volume Delta, its significance in order flow analysis, and how it can be used effectively in trading strategies. By providing a clear understanding of this indicator, traders ca
### **User Guide for CVD Indicator Installation and Usage in MT5**   **Indicator Name:** Cumulative Volume Delta (CVD)   **Version:** 1.00   **Purpose:** Visualizes buy/sell pressure balance through volume analysis.   --- ### **Installation**   1. Download `CVD.mq5` file.   2. In MT5:      - `File` → `Open Data Folder`      - Navigate to `MQL5/Indicators`      - Paste the file into the folder.   3. Restart MT5.   4. In the "Navigator" panel:      - Right-click `CVD` → "Attach to Chart"    
Индикаторы профиля объёма: основные понятия Определение Профиль объёма — это продвинутый индикатор технического анализа, который показывает торговую активность за условленный период времени на определённых ценовых уровнях. С учётом таких пользовательских параметров, как количество строк и период времени, индикатор строит на графике гистограмму, отражающую доминирующие или значимые ценовые уровни, основанные на объёме. По сути, профиль объёма берёт в расчёт общий объём, торгуемый на определённом
### EMA Oscillator Analysis   **Working Principle:**   1. **Main Line Calculation (BufferV):**      - Computes price deviation from adaptive EMA.      - Formula: `BufferV[i] = Close[i] - (alpha * Close[i] + (1-alpha) * BufferV[i-1])`      - Where `alpha = 2/(ema_period+1)`.   2. **Volatility Bands:**      - `BufferDev`/`BufferNegDev`: ±1 standard deviation.      - `BufferDevLimit`/`BufferNegDevLimit`: ±2 standard deviations (multiplied by `limit_factor`).      - Standard deviation is calculate
What is this?   This Expert Advisor adds a visual trading panel to MetaTrader 5 charts. Key features:   - Open/close trades with one click   - Manage Stop Loss (SL) and Take Profit (TP) levels   - Auto-apply risk settings   - Light/dark theme toggle    Interface:   1. Main panel with buttons:      - `BUY` – open buy order      - `SELL` – open sell order      - `CLOSE ALL` – close all trades      - `On/Off` – hide/show panel   2. Input fields:      - `Stop Loss (SL)` – SL distance in points  
Complete Advisor Description for MetaTrader 5 Video  https://youtu.be/7BKaf6kB-OQ?si=MB684rKT8f2f1rmv Advisor Logic The advisor uses a   dual stochastic   system: Senior timeframe   defines the trend. Junior timeframe   finds entry points. Fractal levels   build support/resistance. Signals are filtered by: Order rules ( isFreeOpen / isTwoOpen / isOneOpen ) Reverse signals ( Revers ) Stop levels based on fractals or %/pips. Key Parameters Parameter Group Parameter Description Stochastic SeniorTF
Description of the "GraphicPatternsBuilder" Indicator    Principle of Operation and Advantages:   The indicator automatically plots support (green) and resistance (red) lines on the chart, identifying key price levels. Works on any asset (cryptocurrency, stocks, Forex) and all timeframes.    Key Advantages:  1.  Automation of Routine Work  – The indicator independently identifies significant extrema and draws lines.   2.  Two Construction Algorithms :      -  Type 1 : Line is built using two
ImbalanceCandleAnalyzer: Your Algorithmic Edge on ICT Imbalances Stop Guessing. Start Trading with the Precision of Professional Smart Money. Dear Trader, if you're familiar with the ICT strategy, you know that Price Imbalances (or FVGs) are the cornerstone of high-probability entries. These are the "roadmaps" left by smart money. But manually hunting for them on the chart wastes hours, leads to missed opportunities, and human error. What if you could automate this process? The   ImbalanceCandle
RangerTrader
Vladimir Utkin
Advertising Brochure: Trading Advisor Ranger v1.02 Professional Range Trading Tool "Range Breaker" Strategy: Innovative Market Approach Ranger is an intelligent trading system based on price range breakouts with mathematically verified risk management. The algorithm combines entry precision with multi-level capital protection. TOP-10 Ranger Advantages in Ascending Effectiveness: 10. Multi-Level Deposit Protection - Automatic lot calculation based on risk percentage - Built-in volatility fi
Cazador RSI
Vladimir Utkin
Cazador RSI Expert Advisor    Technical Overview & Algorithm Description Core Trading Strategy The Cazador RSI EA implements a sophisticated   RSI-based momentum strategy   with   pyramiding/averaging   capabilities: Entry Signals: BUY Trigger : RSI crosses above 20 level (oversold bounce) SELL Trigger : RSI crosses above 80 level (overbought reversal) Multiple Timeframe Confirmation : Uses current and historical RSI values Averaging System: Dynamic Position Sizing : Lot size increases
Filtro:
Sem comentários
Responder ao comentário