 MetaTrader 5
 Experts
 Indicadores
 Bibliotecas
 Utilitários
 Widgets
 Regras
Conheça o Mercado MQL5 no YouTube, assista aos vídeos tutoriais
Como comprar um robô de negociação ou indicador?
Execute seu EA na
hospedagem virtual
hospedagem virtual
Teste indicadores/robôs de negociação antes de comprá-los
Quer ganhar dinheiro no Mercado?
Como apresentar um produto para o consumidor final?
Indicadores Técnicos para MetaTrader 5 - 164
 É com base nos sinais de indicadores técnicos que se aplicam as decisões para abertura ou fechamento de uma transação nos mercados de ações e Forex. A essência dos indicadores reside na previsão de mudanças de preço, com base na conversão matemática de preço e/ou volumes de um instrumento financeiro.
Teste os indicadores técnicos para prever melhor o comportamento do mercado e lucrar com isso.

The Current Price Line indicator displays the current price as a real-time horizontal line on the chart. Features of the Current Price Line Unlike standard buy/sell lines, it is unaffected by spreads, enabling precise price identification. It instantly identifies reactive price zones (such as resistance/support lines), facilitating high-precision entries. It delivers high performance for scalping and day trading. Simultaneous display of lines across multiple timeframes supports multi-timeframe a
Multiple Divergence Detection System for MT5 Sistema de detecção e visualização de divergências multi-indicadores (Regular / Hidden, 10 fontes de indicadores, leve e eficiente) Valor principal • Visualização unificada – Detecta automaticamente divergências regulares e ocultas entre preço e indicadores, exibindo linhas de ligação e rótulos claros.
• Análise de múltiplas fontes – Inclui MACD / MACD Histogram / RSI / Stochastic / CCI / Momentum / OBV / VWMACD / CMF / MFI.
É possível

DS Candle Percent Panel – Visão completa do mercado em um só olhar O DS Candle Percent Panel é um indicador avançado que exibe em tempo real a variação percentual do preço em relação à abertura de cada candle nos principais timeframes — de M1 até D1 , incluindo períodos personalizados como H2 e H6 . Com ele, você não precisa mais alternar entre múltiplos gráficos para entender se o mercado está subindo em H1 enquanto cai em M1. Tudo é mostrado de forma clara, coerente e instantânea , diretam

Here our more valuable tools
SMC Trend Trading , Easy SMC Trading , Institutional SMC Architect Volume Analysis Tools , Volume flow Profile , Market volume profile , FVG with Volume , Liquidity Heatmap Profile , Volume Spread Analysis Purpose : Measures market pressure by analyzing tick movements, volume, and speed within a time window. How it works : Calculates weighted price changes, considers tick velocity and volatility, and applies EMA smoothing. Trading use : Strong po

Instantly identify key price action signals with an intuitive visualization indicator:
Pin Bar: The Rejection Candle. Green for a bullish close, red for a bearish close. Defined by a long wick and a small body, signaling a strong price rejection.
Inside Bar: The Consolidation Candle. Highlighted in blue, this pattern occurs when a candle trades entirely within the range of the previous one. It represents a period of market indecision and compression.
Fakey Bar: The Failed Breakout

OrderFlow Pro - Institutional Order Flow Detector Professional Order Flow Analysis for MT5 OrderFlow Pro is an advanced technical indicator designed to detect and analyze institutional order flow in real-time. The indicator provides traders with comprehensive insights into market dynamics by identifying buying and selling pressure, volume imbalances, absorption zones, trapped traders, and delta divergences. KEY FEATURES Order Flow Detection: Real-time buy and sell pressure calculation with perce

MA MTF Fijo: Smooth Curves, Clean Charts
Eliminates the visual "steps" of multi-timeframe moving averages.
Fixed MA MTF: It offers a smooth and professional line of any higher timeframe directly on your current chart.
Key Points:
No Steps: Real and smooth curve between candles (Goodbye to rough straight lines). High Performance: Optimized code; does not slow down your MetaTrader 5. Maximum Versatility: Supports all 21 timeframes and all methods (SMA, EMA, SMMA, LWMA). Multi-Market: Ideal fo

Swing and Liquidity Sweep Finder is a powerful tool designed to automatically detect swing points and liquidity sweeps on your chart.
It helps traders identify where the market is likely to grab liquidity before reversing, showing both internal and external liquidity zones with high accuracy.
This indicator is ideal for ICT and Smart Money Concept traders who rely on swing structure and liquidity manipulation for their entries and exits.
Our Team Services: If you are want to see our products cl

Composite MA Indicator - Comprehensive Guide Description:
The Composite MA indicator is a sophisticated multi-timeframe trend analysis tool that calculates the average value of multiple moving averages across a user-defined period range. It provides comprehensive market trend visualization through both a color-coded composite moving average line on the chart and an Excel-style panel displaying trend direction across 21 different timeframes. The indicator uses canvas technology for smooth GUI r

Magic History is a detailed trade visualization indicator designed to bring the full story of your trading activity directly onto the chart. If you’re a developer or trader who uses magic numbers, this is made for you. Smart pagination - never lose track of your trades again. Pagination means dividing content into separate pages instead of showing everything all at once.
In the context of your Magic History indicator:
Pagination is a system that lets you view your trades in sections (pages) — f
Advanced ZigZag Histogram with Divergence Detection and Order Flow Simulation ZigDeltaSwingPro is a comprehensive technical analysis indicator for MetaTrader 5, built on the classic ZigZag algorithm and enhanced with modern features such as divergence detection, dynamic histogram visualization, swing pattern recognition, and simulated order flow insights. Designed for scalpers and swing traders alike, it leverages MT5’s internal tick volume to deliver actionable signals—no external data feeds r
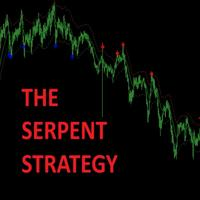
Trade Like a Serpent — Calm, Precise, Lethal. The Serpent Strategy equips you with a visual edge — clarity in confusion, precision in volatility, and confidence in timing.
Let your trades strike like a serpent — swift, silent, and accurate. Overview The Serpent Strategy is a powerful custom-built MetaTrader 5 indicator designed to identify high-probability trade zones using a unique combination of market volatility, trend direction, and momentum confirmation.
It visualizes price action in th
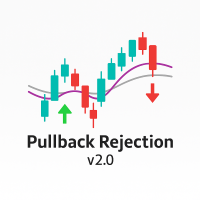
Overview Pullback Rejection v2.0 is a professional-grade visual indicator that spots continuation setups after pullbacks using Heiken Ashi logic and multi-EMA trend bias.
It is designed for scalpers and intraday traders who want clean, rule-based BUY and SELL signals aligned with trend direction only — no repainting, no noise, no counter-trend traps. Trading Concept The indicator combines EMA 7, EMA 50, and EMA 200 to define directional bias: Bias Condition Trades Allowed Bullish EMA7 > EMA200

İşte Portekizce çevirisi: Early Reversal Detector - Capture Reversões Antes que Elas Aconteçam O que Este Indicador NÃO Faz Não é um gerador de sinais de compra/venda. Ele não diz automaticamente quando entrar ou sair de negociações. O que Este Indicador Faz Early Reversal Detector identifica mudanças no comportamento do preço para determinar pontos de entrada ótimos com precisão. Como Funciona O indicador cria candles em um painel separado que se parecem com os candles de preço no seu gráfico p

ICT Unicorn Hunter – Multi-Timeframe Smart Setup Detector IMPORTANT: This is a Multi-Timeframe Scanner, looking for 'Unicorn' setups. A Unicorn in this definition is a liquidity sweep, market structure shift and creation of a Fair Value Gap overlapping with the last opposite-close candle before the liquidity sweep (breaker). This scanner does NOT provide visualisation of the Unicorn on the chart.
For visualisation, use the Unicorn Tracker indicator, which is designed to work with the Unicorn

# Velas de Alta, Baixa e Base - Reconhecimento Profissional de Padrões
## Visão Geral
Velas de Alta, Baixa e Base é um sistema profissional de identificação de padrões de velas projetado para ajudar os traders a identificar zonas de oferta e demanda de alta probabilidade. Este indicador identifica e destaca automaticamente três tipos de velas essenciais que formam a base das estratégias de negociação institucionais: Velas de Alta (forte pressão de compra), Velas de Baixa (forte pressão de ven

Blogs MQL5 = https://www.mql5.com/en/blogs/post/776162 Versão MT4 = https://www.mql5.com/en/market/product/188797 Versão MT5 = https://www.mql5.com/en/market/product/154022
CONTRARIAN ZONES [tambangEA] é um indicador profissional de zonas de mercado concebido para identificar potenciais áreas de reversão, combinando a estrutura de *swing* (oscilação), condições de momentum, volatilidade, comportamento do volume, características de rejeição e o histórico de interação com a zona.
Ao contrário d

Object Synchronizer: Seamless Chart Object Duplication & Management Tired of drawing the same trendline or Fibonacci retracement on multiple charts for the same symbol? Wish your analysis on one timeframe would instantly appear on another? Introducing Object Synchronizer , the ultimate utility indicator for MQL5 that bridges the gap between your charts. Designed for professional traders and analysts using multiple charts of the same symbol, this powerful tool automatically duplicates and manages

Indicador Institucional de Compressão de Liquidez O indicador mede o aperto de liquidez em tempo real utilizando a largura normalizada das Bandas de Bollinger, o volume e o spread médio, a fim de identificar fases de compressão antes das rupturas de preço. Exibição:
Janela separada em estilo profissional, com histograma “Compression Score” e linha de limiar (“Threshold”). Principais Características Deteção antecipada: Identifica zonas de contração antes dos impulsos de preço. Medição multifator
Signal Histogram é um indicador técnico confiável para a plataforma MetaTrader 5, projetado para determinar visualmente a tendência atual baseada na comparação do preço de fechamento com a média móvel. O indicador exibe um histograma em uma janela separada: as barras verdes indicam que o preço está acima da média, enquanto as vermelhas indicam que o preço está abaixo ou igual à média. Essa abordagem permite avaliar rapidamente a direção da tendência e identificar pontos potenciais de reversão.
Fibo AUTO Pro: Redefining Fibonacci Analysis - Smarter, More Intuitive, More Efficient Product Overview
Fibo AUTO Pro is a professional-level technical analysis indicator designed specifically for modern traders. Based on the classic Fibonacci retracement theory, it has been comprehensively enhanced with intelligence to address the pain points of traditional drawing tools in terms of efficiency, visualization, and accuracy. Fibo AUTO Pro is not merely a line-drawing tool; it is your intellige
Mean Reversion Probability – Indicador de Reversão Estatística Descrição curta
Indicador institucional que calcula a probabilidade estatística de reversão para a média móvel de 200 períodos, com base na análise de sobreextensões históricas. Identifica zonas de fadiga do mercado com precisão quantitativa. Principais funcionalidades
Análise estatística avançada – Cria uma base de dados com mais de 500 extensões históricas para calcular probabilidades reais
Pontuação de probabilidade (0–99%) – Qu

ARB é um indicador desenvolvido para identificar oportunidades de rompimento (breakout) de alta probabilidade, através de um sistema de canais ATR adaptativos e um modelo de pontuação multifatorial preciso (0–100).
Combina volatilidade, volume, momentum e tendência multi–timeframe para oferecer sinais filtrados, visuais e acionáveis em tempo real. PRINCÍPIOS DE FUNCIONAMENTO O indicador baseia-se no conceito de Adaptive Range Breakout (ARB) — uma abordagem moderna de trading de rompimentos que a
Enhance your trading strategy with this indicator from tr1cky.com This indicates buying and selling strength. Look for correlation on multiple timeframes for best indication and confidence in your trade. This indicator is simply RSI-MFI for buying and MFI-RSI for selling and is used in the successful expert advisors by tr1cky,com that just use this indicator for execution.

Hi Traders,
On purchase this tool we will give lifetime free updates for this tool
you can contact me how to use this tool better or your suggestion for improvement
This tool will work on any accounts
Where When Enter Exit – Trade Plotter helps traders easily see, track, and review their sell trades directly on the chart.
It clearly shows where you entered, when you exited, and why , so you can quickly learn from every trade. Key Features Auto Plot Entries & Exits –
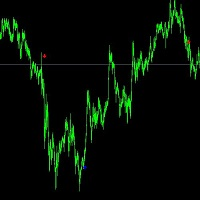
The 5-minute trend buying point reference for gold has an accuracy rate of 90%. All signals are not redrawn, Parameters need to be adjusted for different varieties and periods. The default value for gold trading is the 5-minute period. You can carefully study what direction guidance is suitable for you. We hope you can make money and it is worth referring to for professionals and novice traders. Stop loss is at the end of the line, real-time signal. Welcome to use it. If you have any question

Hidden Trend Channel Project 17 Tool
SPECIAL NOVEMBER SALE is now finished. Price goes back to normal.
This is an Automated Tool for Multi Timeframe Trend Channel Analysis Visualization with Intelligent Range Market, Trending Market, Reversal, Breakout Detection. It draws multiple Trend Channels with multiple sub-trendlines levels inside the channel for perfectly give you the trader, the crystal clear Trend channels where price trend direction is moving.
This tool is accurately useful for T
Reach the apex of precision trading with ApexFusion Pro — a next-generation indicator that fuses RSI divergence , diagonal support & resistance trendlines , Order Blocks , and Fair Value Gaps (FVG) into one visual system. Built for professional traders, it reveals the hidden balance between momentum and liquidity , showing where institutions accumulate, where reversals form, and where the true market flow begins. Key Features: Detects RSI divergences (bullish & bearish) with visual signals Dr
TuMz TrendSignal – Your Reliable Trading Compass in Volatile Markets Tired of noisy indicators that give false signals? Meet TuMz TrendSignal — a clean, non-repainting, ATR-based trend indicator built for serious MT5 traders. Using a smart combination of mid-price (HL/2) and adaptive ATR bands , TuMz TrendSignal dynamically draws: Green trend line during uptrends Red trend line during downtrends Dotted support/resistance zones that adjust to market volatility Clear buy/sell arrows at tr

CVD (Cumulative Volume Delta) for MT5 CVD (Cumulative Volume Delta) for MT5 Simple, fast CVD for volume and order flow trading. It tracks net buying vs selling pressure and plots CVD as candles. The Data Window also shows tick count per candle. What it does Accumulates volume delta from ticks or a chosen timeframe Optional reset: No Reset, Current Chart Period, or a specific timeframe Works on any symbol and timeframe How it’s calculated Tick-based: each incoming tick is labeled as buyer- or sel

- What does this do?
This indicator draws the standard session boxes used in Steve Mauro's BTMM (Beat the Market Maker) method:
• Asian session boxes
• Brinks boxes: London and New York session changeover boxes
• New York session boxes
• Stop-hunt boxes
- Is this for me?
If you use the BTMM trading system and you are on MetaTrader5, this is for you.
• The one provided by Steve Mauro was for MetaTrader4. This is its first MetaTrader5 adaptation. You cannot find this anyw
Indicador de Linhas de Sessão Bancária
As Linhas de Sessão Bancária destacam automaticamente as horas do dia em que o preço se movimenta. Ajuda os traders experientes a marcar e a acompanhar claramente as principais sessões de negociação institucional em que os bancos operam — Asiática, Londres e Nova Iorque — com linhas de sessão totalmente personalizáveis para os seus gráficos.
Concebido para traders que necessitam de clareza e precisão ao acompanhar os ciclos de volatilidade.
Porquê as
Shadow Pulse Descrição Breve Shadow Pulse é um indicador profissional para identificar pontos de reversão baseado no método de reversão à média. Gera sinais de compra e venda de alta precisão usando um sistema inteligente de filtragem multinível. Estratégia de Trading O indicador foi projetado para funcionar em qualquer período de tempo de M1 a H4 e mostra resultados excepcionais no scalping de ouro (XAUUSD). Pode ser aplicado eficazmente tanto para negociação agressiva em períodos inferiores qu

Find potential stop-run zones before price gets there. Bank Levels Tracker highlights potential liquidity levels around obvious swing highs and lows, where retail stop losses may cluster. These areas can become important stop-run zones, often watched by Smart Money Concepts traders for possible liquidity grabs, fakeouts, and reversal setups. Instead of manually marking the same highs and lows over and over again, Bank Levels Tracker plots the levels in advance and sends an instant alert when pr

- What does this do?
This indicator draws the standard EMAs used in Steve Mauro's BTMM (Beat the Market Maker) method:
• The 5 EMA (Mustard)
• The 13 EMA (Ketchup)
• The 50 EMA (Water)
• The 200 EMA (Mayo)
• The 800 EMA (Blueberry)
- What improvement does this indicator offer?
The original version provided by Steve Mauro was for MetaTrader4. This is for MetaTrader5.
The original version provided by Steve Mauro misplaced the EMA-crossover arrows. This indicator handle
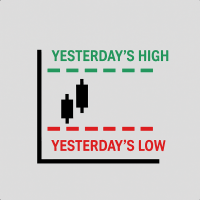
- What does this do?
This indicator draws previous day's high and low as blue tracers on the chart. It is used in Steve Mauro's BTMM (Beat the Market Maker) method.
- What improvement does this indicator offer?
The original version provided by Steve Mauro was for MetaTrader4. This is the first adaptation for MetaTrader5.
Highly optimized for computing resources. It does not affect your computer's performance at all.

- What does this do?
This indicator show the ADR and 3xADR on the chart. It is used in Steve Mauro's BTMM (Beat the Market Maker) method.
It also mark the ADR High and ADR Low as vertical line segments.
- What improvement does this indicator offer?
The original version provided by Steve Mauro was for MetaTrader4. This is the first adaptation for MetaTrader5.
Highly optimized for computing resources. It does not affect your computer's performance at all.

A decision-support indicator for MetaTrader 5 that visualizes market structure using two complementary elements: adaptive Support/Resistance zones and a best-fit Trend Channel computed by regression. Zones scale with volatility (ATR and smoothed ATR) and update only after a pivot is validated, which helps filter noise. The channel shows prevailing slope and parallel boundaries based on average deviation; optional dotted alternatives provide additional confluence. The tool works on any symbol a

Super-Accurate ADR Scalping Machine for MT5
The 200 FREE download promotion has ended. The price has now been updated. Thank you, everyone! Checkout many example setups here, Happening Every Day : https://www.mql5.com/en/market/product/154469/comments
Love it? Hate it? Let me know in a review! Feature requests and ideas for new tools are highly appreciated. :) What It Does:
The ADR Lines Indicator automatically calculates the Average Daily Range (ADR) and plots dynamic support and resis

PICO RSI KF — RSI com Filtro de Kalman O PICO RSI KF foi desenvolvido especialmente para scalpers e day traders que precisam tomar decisões rápidas e precisas .
Ele utiliza um Filtro de Kalman 1D aplicado a um RSI ponderado por volume , produzindo um sinal suave e responsivo capaz de destacar os pontos reais de virada do mercado. Diferente dos osciladores tradicionais, o PICO RSI KF não atua sozinho .
Foi projetado para complementar outros indicadores e estratégias — como Wyckoff, Ondas de Ellio

Overview
The Ultimate RSI Indicator for MT5 is an advanced oscillator designed to provide a more adaptive and dynamic interpretation of market momentum compared to the traditional RSI. It incorporates range normalization, adaptive smoothing, and flexible averaging methods to enhance responsiveness and reduce lag. How It Works
Unlike the standard RSI, which only measures relative price strength, the Ultimate RSI dynamically adjusts to recent price range expansions and contractions. It calculate
Haven QQE PRO - Seu Guia Visual para Tendências em Todos os Timeframes Apresentando o Haven QQE PRO – uma ferramenta prática baseada no algoritmo QQE, criada para resolver a principal tarefa de um trader: identificar rapidamente a tendência atual e negociar em sua direção. O indicador analisa dados de vários timeframes simultaneamente e mostra claramente quem está dominando o mercado — compradores ou vendedores. Outros produtos -> AQUI . Esqueça a necessidade de alternar entre gráficos. To
This RSI, ADX, MA, ATR, CCI MTF Dashboard v1 – Professional Multi-Timeframe Consensus ========================================================================
Professional-grade Multi-Timeframe (MTF) Dashboard with Intelligent Weighted Consensus A powerful, clean, and CPU-optimized visual tool that combines RSI, ADX, EMA, ATR, and CCI across up to 6 timeframes (W1 to M5) with a dynamic consensus engine.
Key Features: • Real MTF analysis using native iRSI, iADX, iMA, iATR, iCCI – no repaint

Indicator Name: BreakingConfirmedLevel
Type: Professional indicator for detecting confirmed breakouts of strong price levels Description:
The BreakingConfirmedLevel indicator is an advanced tool designed to detect confirmed breakouts of strong price levels in the market. It relies on precise price action analysis and multi-layer confirmation logic before generating any signal. This ensures highly accurate entry points after a real breakout, minimizing false signals and increasing consistency in

Trend Regularity Adaptive Moving Average Indicator for MT5
TRAMA Indicator for MT5 Overview
The Trend Regularity Adaptive Moving Average (TRAMA) is an intelligent adaptive moving average that dynamically adjusts its sensitivity based on market structure and trend consistency. Unlike standard moving averages, TRAMA reacts to how frequently new highs or lows are formed within a defined period, providing an adaptive balance between trend-following precision and range stability. How It Works
TRAM

The Trend Force indicator is a professional analytical tool designed to accurately measure the strength of the overall market trend . It works on all currency pairs and timeframes , and is especially effective in highlighting strong and stable trends that traders can confidently act upon. Trend Force utilizes an advanced algorithm to gauge market momentum, clearly indicating the strength of bullish or bearish trends. This makes it easy to make informed trading decisions, either by relying on it
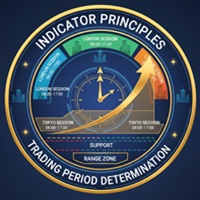
RangeZone Indicator General Overview: Global Exchange Trading from East to West World financial markets operate on the principle of continuous trading sessions, where activity moves with the sun from one financial center to another. Understanding this dynamic is key to successful trading! How Trading Moves Around the World: Asian Session (Sydney, Tokyo): Opens first, sets the tone for daily volatility Japanese yen, Australian dollar, Asian indices Often forms key support/resistance level

This system is very useful for trading because it solves several classic problems: 1. Objectivity & Precision Benefit: It eliminates the trader's personal bias. Every trader might draw a trendline slightly differently, but this indicator uses a precise mathematical logic (Fractals) to find the pivot points. The resulting lines are objective and consistent every time. 2. ️ Dynamic Updates Benefit: Your chart is always current. As soon as a new pivot is confirmed, the new trendline is drawn au

SMC Indicator for MT5 – Trade Like Institutions Unlock the power of institutional trading with the Smart Money Concepts (SMC) Indicator for MetaTrader 5 . Designed for traders who want to go beyond retail strategies, this advanced tool helps you identify market structure shifts, order blocks, liquidity zones, and fair value gaps with precision and clarity. Key Features: Automatic Market Structure Detection : Instantly spot Breaks of Structure (BOS), CHoCH, and trend shifts. Multi-Timeframe

Trendlines with Breaks Overview The Trendlines with Breaks indicator automatically detects and plots pivot-based trendlines, dynamically adjusting their slope and steepness to highlight significant breakout events. Designed for traders who rely on price action and market structure , this tool provides an automated, real-time way to track evolving momentum and breakout confirmations . How It Works The indicator identifies swing highs and swing lows , connecting them to form adaptive trendlines ba

Super Trend Entry Signal Indicator is a powerful trading tool designed to identify precise entry points based on market volatility. Using the Average True Range (ATR) as its core, this indicator dynamically adjusts to current market conditions — helping traders spot potential breakout or reversal opportunities with confidence. Key Features: - Volatility-Based Entries: Calculates entry zones using real-time ATR values for adaptive precision. - Multi-Timeframe Support: Works seamlessly on any time

The indicator is stable on noise fluctuations in price and quickly reacts to the trend. It is based on an algorithm from a system of hyperbolic functions that allows you to aggressively smooth the flat with minimal lag on the trend. It can be applied directly to the price chart, to itself, or to other indicators in order to eliminate false signals. The main purpose of the indicator is to smooth out small sawtooth price movements as much as possible. The higher the Hyperbolic parameter, the stron

BVCandleView is a fresh indicator designed to give discretionary traders a visual edge by rounding price data. Pair it with a free custom-symbol service to display Bob Volman–style tick charts right inside MetaTrader 5. Rounded candles with dynamic coloring make every tick movement instantly readable. Quick Manual Installation Place BVCandleView.mq5 in MQL5/Indicators . Restart MetaTrader 5 and attach the indicator to any chart.
Key Settings Rounding Settings : choose rounding mode (round/ce
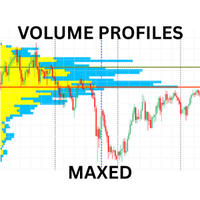
Advanced Volume Profile Indicator for MT5
Transform your trading with professional-grade volume analysis. This comprehensive volume profile indicator delivers institutional-quality market insights with multiple profile types, advanced alert system, and customizable display options. KEY FEATURES Multiple Profile Types Visible Range Profile: Analyzes volume within the current chart window Fixed Range Profile: Custom date range analysis with visual markers Session Profile: Automatic daily/week

O Price Compass é uma ferramenta de análise técnica projetada para funcionar como uma bússola de tendência nos mercados financeiros. Ele avalia a pressão direcional média do mercado, filtrando o ruído de curto prazo para identificar o movimento dominante com clareza. O indicador quantifica o quão afastado o preço atual está de sua "média central" histórica, fornecendo um sinal claro de orientação (Alta, Baixa ou Neutra). Interpretação (Os Três Estados do Compass) O indicador é exibido em uma jan
Here our more valuable tools
SMC Trend Trading , Easy SMC Trading , Institutional SMC Architect Volume Analysis Tools , Volume flow Profile , Market volume profile , FVG with Volume , Liquidity Heatmap Profile , Volume Spread Analysis
The Fractals_Price indicator is a technical analysis tool that identifies fractal patterns on price charts. Fractals are recurring patterns that signal potential trend reversals or continuation points. This indicator marks both upward and downward

Este indicador é usado principalmente para scalping no XAUUSD. Ele marca os preços de Abertura, Mínima e Máxima de: O dia atual O dia anterior A semana atual A semana anterior O mês atual O mês anterior Com base nesses níveis de preços, você pode identificar em quais níveis o preço provavelmente reagirá. Se tiver alguma dúvida ou solicitação, sinta-se à vontade para entrar em contato comigo pelo chat. Obrigado e tenha um ótimo dia!

IMPORTANT! After your purchase, please contact me. Overview: Trade Vision Panel is a premium, lightweight trading dashboard for MetaTrader 5 designed to display your key trading information directly on the chart.
It combines performance analytics, open-position monitoring, and a real-time news filter — all in one smart, elegant interface.
Perfect for traders who want to see everything

️ Power Moving Average Signals Visão geral: Power Moving Average Signals é uma estratégia de negociação baseada em tendência que utiliza o cruzamento de duas médias móveis — uma rápida e uma lenta — para gerar sinais claros de compra e venda : Compra : quando a média móvel rápida cruza acima da média lenta Venda : quando a média móvel rápida cruza abaixo da média lenta Otimizada para pares de moedas: Esta estratégia funciona especialmente bem em instrumentos do mercado Forex , princip

Comprehensive Multi-Timeframe Volume-Based Support and Resistance Indicator Overview VolumePoint Pro is a complete analytical tool built around the concept of Point of Control (POC) — the price level where the highest traded volume occurred during a specific session or period.
By tracking and displaying these price nodes over multiple timeframes, the indicator allows traders to clearly identify zones of high market participation, which often act as powerful support and resistance levels. The ind
Buy Sell Swing Indicator Adaptive Swing High/Low Detector Buy Sell Swing Indicator is a dynamic swing detection indicator designed to automatically adapt to different timeframes and market conditions. It identifies key swing highs and lows with precision, helping traders analyze market structure and potential turning points without manual adjustment. The indicator removes the need for constant parameter tuning by automatically optimizing its sensitivity based on the active chart timeframe. Core
DUAL-ENGINE ANALYSIS SYSTEM: Average Tick Size Indicator : Measures bid movement strength across 6 customizable lookback periods (36, 96, 369, 500, 1000, 2000 ticks) Multi Timeframe Tick Analyzer : Calculates buy/sell pressure percentages across 6 different timeframes (100.200,300,400,500,600 ticks) REAL-TIME SIGNAL GENERATION: Combined Buy/Sell Alerts : Only triggers when BOTH analytical engines confirm the same direction Visual Arrow Signals : Clear green up arrows for buy signals, red down

Dynamic Dollar Value Indicator - Know Your Risk Before You Trade! Stop guessing and start knowing exactly what every price move means in real dollar terms! The Dynamic Dollar Value Indicator is an essential tool for professional traders who want instant visibility into the monetary value of price movements for any trading instrument. KEY FEATURES: REAL-TIME DOLLAR CALCULATIONS: Instantly displays the dollar value of 1% price moves for any symbol Automatically adapts to Forex, Stocks, In
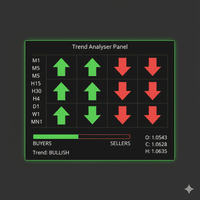
The Trend Analysis Dashboard is a powerful, all-in-one technical analysis tool designed for traders who need a clear, consolidated view of market momentum across multiple timeframes. Instead of cluttering your chart with numerous separate indicators, this tool aggregates signals from four key oscillators (Stochastic, RSI, and dual CCI) into a single, easy-to-read panel. It calculates the directional bias (Buy, Sell, or Neutral) for each enabled timeframe and provides a visual summary of over

Indicador AI Forecasts para MT5:
Sistema de Previsão Futura com Inteligência Artificial e Aprendizado Profundo (AI + ML)
_ Características Principais: Visão futura de até 20 candles à frente com base na análise dinâmica de dados Adequado para negociação scalping Gráficos de previsão multicoloridos refletindo níveis de confiança nas previsões com contador de pips branco ao lado do status atual de Compra/Venda Zonas de probabilidade mostrando trajetórias de preço esperadas com margem de mudanças

Aqui está a tradução para o português, mantendo o formato original e incluindo os termos em inglês entre parênteses, conforme solicitado: O Indicador de Posições de Entrada Média (The Average Entry Positions Indicator) O Indicador de Posições de Entrada Média (The Average Entry Positions Indicator) fornece aos traders uma clara representação visual de seus preços médios de entrada de compra e venda (average buy and sell entry prices) no gráfico. Esta poderosa ferramenta agora calcula e exibe inf

️ Ichimoku Kinko Hyo System Uma ferramenta inteligente para análise de mercado precisa e eficaz Este indicador é baseado no consagrado sistema Ichimoku Kinko Hyo , oferecendo uma visão completa da estrutura do mercado, sua dinâmica e possíveis movimentos de preço. Foi desenvolvido para ajudar traders a tomarem decisões rápidas com base em sinais visuais claros. Principais recursos: Alta precisão por meio de análise avançada do mercado em múltiplos períodos de tempo ️ Visão instantâ
≤§≥ The red magic channel Trend Indicator displays relevant highs and lows.
This allows you to easily spot reversals and trend continuation moves.
≤§≥ All red magic channel products come with a pdf manual in English.
Here is the link for the Trend Indicator : https://drive.google.com/file/d/1tPoyo7EUJghH5I8fQARzbqXYh_UOn67V/view?usp=sharing
≤§≥ If you encounter any issues with the Trend Indicator, contact us at redmagicchannel@gmail.com

≤§≥ The red magic channel Order Blocks Indicator scans the chart for order blocks using several filters
and displays horizontal lines at the high and low prices of the order block candle.
≤§≥ All red magic channel products come with a pdf manual in English.
Here is the link for the Order Blocks Indicator : https://drive.google.com/file/d/1tPoyo7EUJghH5I8fQARzbqXYh_UOn67V/view?usp=sharing
≤§≥ If you encounter any issues with the Order Blocks Indicator, contact us at redmagicchanne

≤§≥ The red magic channel Position Manager Indicator helps you build a trading plan from scratch
and shows all the parameters directly on the chart.
≤§≥ All red magic channel products come with a pdf manual in English.
Here is the link for the Position Manager Indicator : https://drive.google.com/file/d/1tPoyo7EUJghH5I8fQARzbqXYh_UOn67V/view?usp=sharing
≤§≥ If you encounter any issues with the Position Manager Indicator, contact us at redmagicchannel@gmail.com
O mercado MetaTrader é um espaço, sem precedentes, para negociar robôs e indicadores técnicos.
Leia o artigo Manual do usuário da MQL5.community para saber mais sobre os serviços exclusivos que oferecemos aos traders: cópia de sinais de negociação, aplicativos personalizados desenvolvidos por freelances, pagamentos automáticos através de sistema de pagamento e a rede em nuvem MQL5.

Você está perdendo oportunidades de negociação:
- Aplicativos de negociação gratuitos
- 8 000+ sinais para cópia
- Notícias econômicas para análise dos mercados financeiros
Registro
Login
Você concorda com a política do site e com os termos de uso
Se você não tem uma conta, por favor registre-se