 MetaTrader 5
 Experts
 Indicadores
 Bibliotecas
 Utilitários
 Widgets
 Regras
Conheça o Mercado MQL5 no YouTube, assista aos vídeos tutoriais
Como comprar um robô de negociação ou indicador?
Execute seu EA na
hospedagem virtual
hospedagem virtual
Teste indicadores/robôs de negociação antes de comprá-los
Quer ganhar dinheiro no Mercado?
Como apresentar um produto para o consumidor final?
Indicadores Técnicos para MetaTrader 5 - 163
 É com base nos sinais de indicadores técnicos que se aplicam as decisões para abertura ou fechamento de uma transação nos mercados de ações e Forex. A essência dos indicadores reside na previsão de mudanças de preço, com base na conversão matemática de preço e/ou volumes de um instrumento financeiro.
Teste os indicadores técnicos para prever melhor o comportamento do mercado e lucrar com isso.
This indicator is based on Fair Value Gap on higher timeframe and filtered by minimum RSI level with multiplier. The area is shown using Market Profile to look for better strong level for entry. How to use. When area is appeared wait for a price to touch nearest strong zone. Green is for buy and red is for sell. You can set preferable stop loss and take profit just to visualize. But it has to be not so far away from area. MinATRX - ATR multiplier to filter weak areas. MPRange - number of bars to
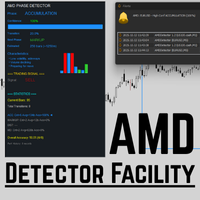
AMD Detector Facility MT5 Description Leading indicator that helps detect market structure phases — Accumulation, Markup, Distribution, Markdown — in real time. Designed for traders using Wyckoff or Smart Money Concepts methods. Features Automatic phase detection based on price dynamics and volume Multi-timeframe confirmation for higher accuracy Smart UI overlay with clear labels and tooltips Real-time alerts when a new phase starts Performance tracker (success rate & average move) Optimized
# Indicador de Confluência de Tendências
**Sistema de pontuação de confluência multiindicador para análise de tendências**
O Trend Confluence combina quatro indicadores técnicos populares (EMA, RSI, MACD e ADX) em uma única pontuação numérica de 0 a 100, ajudando os traders a identificar a direção do mercado e a força da tendência rapidamente.
## Visão Geral
Este indicador avalia as condições de mercado analisando a concordância entre quatro componentes técnicos. Quando os indicadores se al
STRUCTURAL TREND LINES - MT5 Indicator
Simple indicator that automatically draws trend lines based on market structure.
Features:
- 3 degrees of structure detection (short, medium, long term)
- Configurable swing strength for each degree
- Single color per degree for clean visualization
- Adjustable number of lines per degree
- Customizable colors and line widths
How it works:
The indicator identifies swing highs and lows based on the strength parameter,
then connects these points to create t
Trend Magic Indicator for MT5
To download All Of Our Products , you can click this link: LINK Are you interested in the Wei Wave Indicator Volume : LINK
Are you interested in the Chandelier Indicator : LINK Are you interested in the Wave Trend Oscillator : LINK Are you interested in the Support & Resistance Indicator : LINK Are you interested in the Alpha Trend Indicator : LINK Are you interested in the NRTR Indicator : LINK
Introduction The Trend Magic Indicator is a smart tool that blends

An all-in-one indicator that automatically plots all essential price levels for price action analysis, saving you time and enhancing your trading decisions. Tired of manually drawing dozens of lines on your charts every single day? B-Levels is the definitive solution for any trader who bases their strategy on modern price action and Smart Money Concepts (SMC). This powerful tool automates the plotting of all critical levels, keeping your charts clean and allowing you to focus solely on trading o

Volume Profile Rectangle Resumo Indicador interativo de perfil de volume que exibe uma análise horizontal do volume negociado em cada nível de preço dentro de uma área selecionada. Cria automaticamente um retângulo móvel e mostra barras coloridas que representam a distribuição do volume de compra (bullish) e de venda (bearish). O que faz: Exibe o volume horizontal : Visualiza a distribuição do volume em cada nível de preço em forma de barras horizontais Análise de alta/baixa : Colore as barras e
HTF Power of Three (ICT) - MT5 Indicator - Version 1.1 Overview The HTF Power of Three indicator is a professional implementation of the Inner Circle Trader's (ICT) Power of Three concept, inspired by Larry Williams. This indicator visualizes higher timeframe (HTF) candle development in real-time on any lower timeframe chart, making it an essential tool for ICT traders who study institutional price movement patterns. What is Power of Three (PO3)? Power of Three represents a three-staged Smart M
Spike Signal v1.2 — indicador MT5 que detecta picos explosivos Boom/Crash e gera sinais de scalping em tempo real. TF:
Funciona em todos os timeframes (recomendado M1–M15). Par:
Projetado para índices sintéticos Boom e Crash (Deriv), também aplicável a ativos voláteis. Configurações: SpikeSensitivity / MinSize – sensibilidade e tamanho mínimo do pico EMA (8/21) – cruzamentos de entrada RSI (14) – filtro de tendência TP/SL Points – níveis de lucro e perda Trailing Exit / Alerts – lógica de saíd
Reversal merchant is a powerful, non-repainting technical indicator designed for MetaTrader 5, delivering precise buy and sell signals for traders seeking reliable entry and exit points. Built with advanced filtering mechanisms, it combines multiple technical analysis tools to identify high-probability reversal opportunities in any market, making it ideal for forex, stocks, commodities, and indices trading. Non-Repainting Signals : Generates stable buy (lime arrows) and sell (red arrows) signa
Trend Strength Index Indicator for MT5 TSI Indicator for MT5
To download All Of Our Products , you can click this link: LINK Are you interested in the Wei Wave Indicator Volume : LINK
Are you interested in the Chandelier Indicator : LINK Are you interested in the Wave Trend Oscillator : LINK Are you interested in the Support & Resistance Indicator : LINK Are you interested in the Alpha Trend Indicator : LINK Are you interested in the NRTR Indicator : LINK
Introduction The Trend Strength Inde

**Statistic Signal - Indicador de Previsão por Velas MT5** Detecte sinais de compra e venda com precisão usando padrões de velas como engolfo, doji, martelo e estrela cadente. Apresenta blocos visuais (verde para compra, vermelho para venda) abaixo do gráfico, com parâmetros personalizáveis (período, altura, distâncias). Ideal para traders iniciantes e intermediários. Teste e otimize sua estratégia!

Ele desenha blocos em cada vela do gráfico, destacando Order Blocks (OB) válidos de alta e baixa com critérios avançados de price action. Ideal para traders de SMC (Smart Money Concepts).
**Principais Recursos:** - Renderiza retângulos em todas as velas analisadas (até 500 barras), com projeção futura e deslocamentos. - Detecta OBs: Bullish (azul, OB↑) e Bearish (vermelho, OB↓) baseados em pressão da vela, tamanho mínimo e quebras de estrutura. - Alertas personalizáveis: Popup, notificações pu
Hi Traders, ChartObjectsSync is a lightweight MT5 indicator that keeps drawing objects synchronized between two charts of the same symbol.
When you draw or modify an object on one chart, the indicator automatically mirrors it on the other — maintaining consistent visuals and levels. The indicator currently supports syncing the following objects: - Horizontal lines - Trendlines - Fibonacci retracements
- Rectangles - Text labels
1- Key Features : Two-chart synchronization: Works seamlessly bet
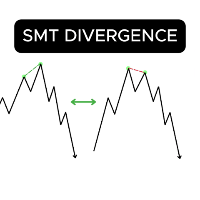
SMT Divergence Combo v5.0 – User Manual Purpose: The SMT Divergence Combo indicator automatically detects Smart Money Technique (SMT) divergences between two correlated assets across Weekly, Monthly, and Quarterly timeframes. It identifies divergence between swing highs/lows of the current chart and a correlated symbol, highlighting liquidity failures and potential reversal points. Detection Logic 1. The indicator scans each week, month, and quarter for swing highs/lows. 2. If one market mak
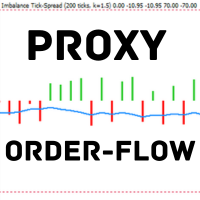
Indicador baseado no desequilíbrio do tick-spread. TF:
Funciona em todos os timeframes (de M1 a D1). Par:
Compatível com Forex, índices, ouro e CFDs (ajuste automático para instrumentos JPY, Ouro e CFD). Configurações: TickWindow (200) – janela de observação de ticks SpreadWeight (1.5) – peso do spread NormalizationPeriod (20) – período de normalização (z-score) Overbought / Oversold (±3.0) – níveis de alerta AlertCooldown (300s) – intervalo entre alertas Conclusão:
Proxy Order Flow – Imbalan

Manipulation Hunter — Identify Market Convergence with Algorithmic Precision Manipulation Hunter is an advanced indicator engineered to detect manipulation points, structural pivots, and price convergence zones before major directional moves occur.
Powered by a proprietary multi-variable algorithm based on AMD (Accumulation – Manipulation – Distribution) principles, it automatically analyzes price action to reveal key levels where structure, momentum, and institutional footprints align. Wh
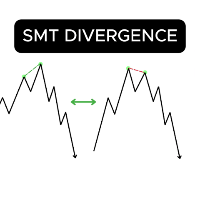
This indicator enhances traders, trend Bias by automatically detecting Smart money timing for you. It runs on historical data drawing and live detecting (OnTick).
One can set the detecting logic based on specific region/broker start hour of the day , it has color options for bullish and bearish smt and line style and width is added.
It is really effective for live trading for live detection during trade and/or trade analysis to confirm or add confluence.
More improved version are coming in fu

T3 Matrix Pro – Adaptive Trend Fusion EA T3 Matrix Pro is an advanced trend-following Expert Advisor that blends the power of T3 Moving Averages , Parabolic SAR , and Heikin-Ashi analysis into a single precision-driven system.
Designed for both scalping and swing trading, it identifies market structure shifts early and confirms them with multi-layered momentum logic. Core Logic T3 Fast & Slow Algorithm – Detects early trend transitions with exceptional smoothness. PSAR Confirmation Layer – Valid

Gann Fusion Activator Pro – Adaptive Trend Flow System Gann Fusion Activator Pro is a next-generation evolution of the classic Gann High–Low Activator , enhanced with multi-timeframe logic , visual trend zones , and a customizable signal engine .
It transforms traditional trend analysis into a modern, dynamic system that adapts to volatility, providing precise visual cues for trend shifts and momentum changes. Core Features Adaptive Gann Channel – Real-time dynamic high/low activation zones with

CRUDE OIL BUY/SELL (3 Min) Technical Overview The CRUDE OIL BUY/SELL indicator is designed for short-term traders focusing on crude oil price movements.
It identifies high-probability buying and selling opportunities based on a combination of RSI levels , SMA trend positioning , and candle structure analysis .
This tool is particularly effective on the 3-minute timeframe , providing clear visual signals and alerts for both momentum continuation and potential reversals. How It Works The indicator
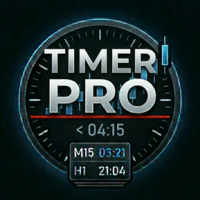
The Timer PRO indicator shows a countdown for the closing of the current candle on the main chart.
Main Features:
Main Timer: Shows the remaining time for the current candle. Changes to alert color (red) when there are 10 seconds or less remaining. It is activated/deactivated with the 'T' key. Multitemporal Panel (MTF): A floating panel that displays countdowns for multiple timeframes simultaneously. When you click on a timeframe in the panel, that specific chart opens. It is activated/deactiv

PulseZones MTF Support & Resistance PulseZones MTF Support & Resistance is a precision tool designed to identify and display key Support and Resistance levels from multiple timeframes directly on a single chart.
It helps traders understand market structure at a glance by showing how price interacts with major zones across M15, H1, H4, and D1 timeframes. This indicator is built for traders who value accuracy, structure, and clarity in their analysis — from scalpers looking for intraday reaction z

OrderFlow Vision – Institutional Market Structure Visualizer OrderFlow Vision is a Smart Money Concepts (SMC) indicator designed to automatically detect and display institutional price structure directly on the chart.
It identifies and marks Order Blocks , Fair Value Gaps (FVGs) , Break of Structure (BOS) , and Change of Character (CHOCH) in real time, helping traders understand how price moves in relation to liquidity, imbalances, and structural shifts.The indicator works across all symbols and

In the fast-paced world of trading, precision and reliability are everything. Traders know that a single false signal can mean the difference between profit and loss. That’s why Super Trend Ultimate X was created: a next-generation trading indicator that takes the proven foundation of the classic SuperTrend and elevates it to an entirely new level of accuracy, stability, and performance.
Unlike the traditional SuperTrend, which relies solely on ATR calculations, Super Trend Ultimate X integrat
Retraço de Fibonacci FTU Este indicador desenha níveis de Fibonacci para sistemas de entrada do tipo retração Uma versão aprimorada e mais precisa que o MT4 Estude o movimento do preço e use uma estratégia do tipo retração para entrada em níveis de Fibonacci ou próximos a eles Recursos: Múltiplos níveis de Fibonacci ajustáveis Altere a cor e a quantidade de barras do intervalo Uso: Objetivo: estudar ou medir a retração do preço Altere a cor e a quantidade de barras do intervalo. Use em qualquer

Mercury GUI Crypto v4.1 — Intelligent, Multifunctional Analytical Suite for Cryptocurrency and Forex Mercury GUI Crypto is a cutting-edge, next-generation indicator specifically engineered for traders active in cryptocurrency and traditional financial markets. It integrates more than 30 analytical modules, displaying critical insights directly on the chart through an intuitive graphical user interface (GUI). The indicator is ideally suited for both scalping and medium-term trading across time

Liquidity Map Overview The Liquidity Map indicator is an advanced visualization tool based on ICT Smart Money Concepts .
It automatically identifies daily Buy Zones , Sell Zones , and Liquidity Levels , showing where price is likely to reverse or continue based on institutional order flow.
It calculates key levels from the daily session — such as the previous day’s high, low, and midpoint — then derives a premium (sell bias) and discount (buy bias) structure. When price trades into these mapped

Liquidity Lens See the Market Through the Eyes of Smart Money. Liquidity Lens is a next-generation ICT-style market structure tool designed to reveal the hidden layers of institutional activity.
It automatically identifies support and resistance zones , Fair Value Gaps (FVGs) , session ranges , and market opens/closes — giving you a clean and intelligent view of how liquidity truly moves. This indicator isn’t just about drawing lines — it visualizes how liquidity forms, shifts, and gets taken ac
Ready Trade System — The All-in-One Dynamic Entry, Stop & Take-Profit Indicator
Ready Trade System is a complete trading framework designed for traders who demand clarity, precision, and confidence in every move. Built on advanced multi-filter logic, this indicator dynamically calculates and displays optimal Entry, Stop Loss, and Take-Profit levels directly on your chart — adapting instantly to market volatility and trend behavior.
This isn’t just another visual indicator — it’s a decision-ma

Channel Ultima – Indicateur multicanal dynamique
Auteur : KOUAME N'DA LEMISSA
Plateforme : MetaTrader 5 (MT5) Description: Channel Ultima est un indicateur de structure de marché avancé qui trace automatiquement trois canaux dynamiques multi-temporels.
Il permet une analyse précise de la structure des prix, des zones de support et de résistance, ainsi que des zones d'équilibre, offrant ainsi une vision claire et professionnelle du marché. Cet outil est conçu pour les traders techniques, le

NewYork_SilasFernandes: H1 Entry Killer. Green signal for buy, red for sell – no lag, no repainting. Uses real volume to filter noise, Bollinger Bands to catch perfect reversals. Advantages: enters before the move, exits at the top, works only on H1 but you can test other timeframes. Parameters: VolumeThreshold (adjusts sensitivity, default 50), BollingerPeriod (default 20, default 2 deviations), SignalColorBuy (green), SignalColorSell (red).
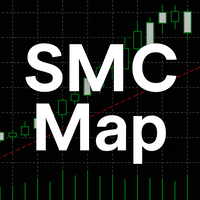
An indicator that puts SMC text below/above candles with green/red color for bullish/bearish candles, it finds order blocks, mitigation blocks, rejection blocks, fair value gaps, equal lows/highs, and break of structure. Text can be cluttered if multiple blocks are found, and future version might space the text from the candles a bit more. Message me if you got any requests.

Description — DS Weekly Percent The DS Weekly Percent indicator is designed to track the weekly performance of an asset, using the weekly opening price as its reference point. It automatically draws a percentage grid above and below the weekly open, creating levels that represent price variations in configurable increments (for example, ±1%, ±2%, ±3%, etc.). These levels help traders identify reaction zones and equilibrium areas in the market throughout the week. Main Features: Clear visua

Gold Flow Master — Institutional Flow Analyzer for XAUUSD Gold Flow Master reveals the hidden structure behind gold price movements by mapping institutional footprints such as Order Blocks, Fair Value Gaps, Liquidity levels, Support/Resistance, Kill Zones, and Fibonacci pockets.
It then scores the current price context to highlight the highest-probability trading zones based on real institutional behavior. Main Features Automatic Detection Bullish and Bearish Order Blocks Fair Value Gaps (FVG) L

Mapa de Liquidez Institucional Pro é um indicador para MetaTrader 5 que mapeia zonas de liquidez institucional usando máximas e mínimas mensais. Ele detecta automaticamente áreas de caça a stops, zonas de reversão e áreas de acumulação/distribuição institucional. Segue dinamicamente até 3 níveis de liquidez de compra e venda em tempo real. Principais funcionalidades: Detecção automática de máximas e mínimas mensais Zonas de liquidez institucional em tempo real Rastreamento de 3 níveis de liquide
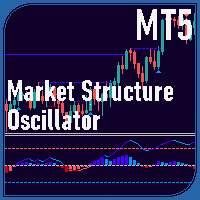
Market Structure Oscillator Overview The Market Structure Oscillator is a technical indicator designed for MetaTrader platforms to analyze market trends across multiple timeframes. It provides a clear visualization of short-term, intermediate-term, and long-term market structures through an oscillator and histogram display in a separate window. The indicator also supports optional chart objects to highlight key market structure points. Features Displays a composite oscillator combining short-ter

DailyPOC 4X — Enxergue o mercado como nunca antes! Se você está cansado de operar no escuro, o DailyPOC 4X é o indicador que pode mudar sua visão do mercado.
Ele revela as zonas mais importantes de decisão dos grandes players , destacando: POC diária (Point of Control) — o verdadeiro “ímã” do preço, onde ocorre o maior volume negociado do dia. Áreas de Valor Superior e Inferior (HVA e LVA) — regiões estratégicas que delimitam o campo de batalha entre compradores e vendedores. POCs de dias anteri
Simple Smart Signal é um indicador adaptativo de tendência e momento projetado para fornecer sinais de entrada mais precisos e confiáveis. Ele combina a análise de médias móveis internas com uma confirmação de expansão (widening), mostrando apenas sinais quando há real aumento da força direcional.
Dessa forma, o indicador evita entradas falsas durante períodos de consolidação e ajuda o trader a identificar momentos em que o preço realmente ganha impulso. Você pode ativar a opção para avaliar ape
THE DAILY DECIDER BUYSELL PRO INDICATOR OVERVIEW Unlock the Market's Daily Secret: The Daily Decider BuySell Indicator is Here!
Tired of analysis paralysis? Struggling with false signals and noisy markets? What if you could know the market's primary intention within the first few hours of the day and trade with unwavering confidence?
Introducing the Daily Decider BuySell Indicator for MetaTrader 5. Pro Tip: Never Miss the first signal of the day This isn't just another indicator cluttering yo

ProxyFootprint — Visão geral ProxyFootprint Advanced é um indicador de visualização de fluxo de ordens para o MetaTrader 5 que oferece informações sobre a pressão de compra e venda em diferentes níveis de preço. O que é (e o que não é) Importante: Isto não é um gráfico footprint real. Os gráficos footprint verdadeiros exigem acesso aos dados reais do livro de ordens (volume de compra/venda em cada nível de preço) de bolsas ou provedores especializados.
Este indicador cria uma aproximação visual
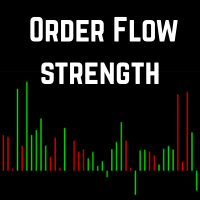
Order Flow Strength (OFS) Descrição:
Indicador que mede a força do fluxo de ordens , analisando onde o fechamento se encontra dentro da faixa de cada vela, ponderado pelo volume . Exibe a pressão compradora (verde) e a pressão vendedora (vermelha) em um painel separado. Fórmula Order Flow Strength = Close − Low High − Low × Volume \text{Order Flow Strength} = \frac{\text{Close} - \text{Low}}{\text{High} - \text{Low}} \times \text{Volume} Order Flow Strength = High − Low Close − Low × Volume C
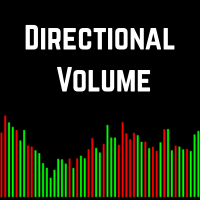
Directional Volume — Visualize a pressão compradora e vendedora Directional Volume é um indicador de volume leve, porém poderoso, que separa a pressão de compra e de venda em um formato visual intuitivo.
Em vez de mostrar apenas o volume total, ele destaca quanto da atividade vem dos compradores e quanto dos vendedores — ajudando os traders a avaliar instantaneamente o sentimento e a força do momentum do mercado. Diferenças em relação ao volume tradicional Ao contrário das barras de volume padrã

A Maneira Inteligente de Acompanhar o Mercado Negocie com clareza, precisão e confiança usando o Big Mindset Session Finder EA — sua ferramenta completa para identificar automaticamente as sessões de negociação Asiática, de Londres e de Nova York diretamente no gráfico do MT5. Chega de adivinhar onde estão as máximas e mínimas das sessões — este Expert Advisor faz tudo por você! Principais Recursos Detecção Automática de Sessões
Destaca instantaneamente as sessões Asiática, de Londres e
Indicador de Reatividade – Medição da resposta do mercado a eventos econômicos para MT5 O Indicador de Reatividade analisa e quantifica em tempo real a reação do mercado a eventos do calendário econômico. Mede automaticamente o movimento do preço (em pips) após 10, 30 e 60 segundos de cada anúncio econômico importante. Principais recursos Obtenção automática de eventos
Integração direta com a API nativa do Calendário do MT5, sem necessidade de configuração externa. Medição precisa da volatili

Heikin Ashi RSI Indicator for MT5 (HARSI) Overview
The Heikin Ashi RSI (HARSI) indicator combines Heikin Ashi candle smoothing with RSI momentum analysis, providing a dual-layer view of price action and relative strength. It offers a clear visualization of market direction, RSI-based overbought and oversold conditions, and optional backtesting and alert systems for strategy validation and trade signal automation. How It Works
The indicator applies RSI values to Heikin Ashi calculations, creati

FiboCircles Zones — Fibonacci Circles, Fan, Zones & Time Analysis Suite An all-in-one Fibonacci indicator for MT5. It combines the most widely used Fibonacci tools into a single indicator — Circles, Fan, Zones, HLines, Time Period Wave, and Time Zones — with draggable, persistent anchor lines that remember their position permanently. No need to redraw anything every time you reopen the chart. Built for traders who rely on Fibonacci as a core tool for finding support/resistance, reversal points,

Indicator: Color MACD Description:
The Color MACD Indicator is an enhanced version of the classic MACD, designed to give traders a clearer and more intuitive visual signal of market momentum and trend changes.
Unlike the standard MACD, this version adds color-coded bars and signal lines to help you identify bullish and bearish momentum instantly — without having to interpret raw histogram data. Key Features: Color-coded histogram and signal line for quick visual analysis. Detects trend

TrapSniper Pro is a professional-grade indicator built to detect genuine price action setups while identifying potential market manipulation zones.
It combines advanced candlestick pattern recognition with smart filtering logic to highlight areas where institutional players may be trapping liquidity before major price reversals or continuations. This tool is designed for traders who rely on price action, smart money concepts, and clean chart analysis without unnecessary noise. It provides visual
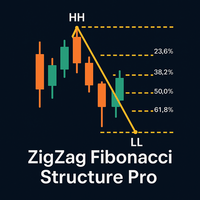
Trade smarter with ZigZag Fibonacci Structure Pro — a professional indicator that dynamically detects Higher Highs (HH), Higher Lows (HL), Lower Highs (LH), and Lower Lows (LL) in real time.
Each structural swing automatically maps a precise Fibonacci retracement , drawn only from true impulses — not minor corrections. With its elegant design, smooth visuals, and intuitive input settings, this indicator turns complex structure reading into a simple, visual process. Key features: Auto-detectio

AI SuperTrend Final – Adaptive Intelligence for Smarter Trading
The AI SuperTrend Final is not just another trend indicator—it is a next‑generation trading tool powered by adaptive intelligence. Designed for MetaTrader, this indicator combines the proven logic of SuperTrend with advanced filters such as Moving Average (MA), Average Directional Index (ADX), and a unique self‑learning mechanism. The result is a smart, evolving system that adapts to market conditions and continuously improves its
The Strat Dashboard – Scanner de Padrões Multi-Símbolo para a Estratégia Strat de Rob Smith
Transforme Seu Trading com Análise Strat Multi-Símbolo em Tempo Real
O The Strat Dashboard é um indicador poderoso, de nível profissional, projetado especificamente para traders que utilizam a renomada metodologia “Strat” de Rob Smith. Monitore símbolos ilimitados em múltiplos prazos simultaneamente, identifique configurações de alta probabilidade instantaneamente e nunca perca outro padrão acionável. M
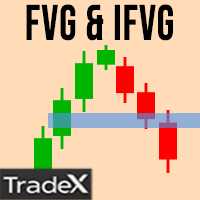
Click the link to view our products: LINK Click the link to view my best tool: LINK Description: Smart FVG & iFVG Zones Indicator MT5 accurately detects Fair Value Gaps and Inverse Fair Value Gaps based on ICT Smart Money Concepts . It automatically plots imbalance zones to reveal liquidity voids , mitigation areas , and institutional trading levels . Designed for professional traders, this tool helps you identify premium and discount zones with real-time updates. The indicator supports both bu

Symbol Changer Indicator
This is a simple yet intuitive indicator.
The indicator provide easy navigation across various symbols and across different time frames all in a chart.
The buttons are displayed on the main chart.
It is flexible and easy to use with fast response speed.
FEATURES
Use Custom Pairs : If set to true, load all the available symbols in the Market Watch. No means it loads the pairs selected below.
Pairs (Separated by Comma) : This enables selected pairs
BigMindset Liquidity & Volatility Indicator – $120 Price: $120 USD Overview:
The BigMindset Liquidity & Volatility Indicator is a powerful stand-alone tool for MetaTrader 5 that visually identifies low liquidity, high liquidity, and consolidation zones in the market. It provides traders with actionable insights to help avoid whipsaws, recognize strong momentum, and make smarter trading decisions—all without cluttering the chart. Why You Need This Indicator: Instant Market Clarity Quickly see th

Scanner Intelligence Hub - Multi-Active Monitoring 28+ Pairs Stop jumping from one chart to another. Scanner Intelligence Hub is the ultimate command center for the professional trader. Monitor dozens of assets and multiple timeframes from a single dashboard.
Technical Capabilities:
Real-time scanning: It detects candlestick patterns, mean crossovers, and RSI levels in 28 pairs simultaneously.
Customizable Panel: Choose which indicators and timeframes you want the Scanner to monitor f

Haven Fibonacci Volume Profiles — Seu Analista Automático de Faixas de Mercado Apresentando o Haven Fibonacci Volume Profiles — uma ferramenta poderosa que leva a análise de mercado para o próximo nível. Este indicador identifica automaticamente as principais faixas de preço, construídas em pontos de pivô significativos, e sobrepõe em cada uma delas um Perfil de Volume detalhado juntamente com os níveis de Fibonacci. Isso permite que os traders vejam instantaneamente onde a liquidez está concent

VolumeTracker 4X – Candle de Maior Volume e VWAP Descrição principal: O VolumeTracker 4X identifica automaticamente o candle de maior volume do dia no mercado Forex e calcula o preço médio ponderado pelo volume (VWAP) a partir deste candle. Ele desenha canais dinâmicos com base nos preços high e low desde o candle de maior volume até o candle atual , ajudando você a visualizar áreas importantes de suporte e resistência . Criado para traders que desejam decisões mais precisas usando volume real c

SmartCandle 4X – Candles Coloridos por Volume Descrição principal: O SmartCandle 4X pinta automaticamente cada candle de acordo com o volume detectado . Candles de baixo volume começam com tons suaves de azul, evoluindo para branco, amarelo, laranja, vermelho e roxo à medida que o volume aumenta. Isso permite ao trader identificar rapidamente se o mercado está calmo ou agitado , facilitando decisões mais estratégicas no Forex. Principais benefícios: Visualização imediata do nível de atividade do
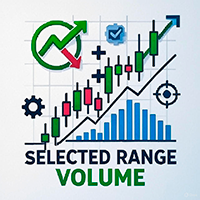
Selected Range Volume — Buyers and Sellers Balance + Volume Levels Selected Range Volume is an advanced indicator for analyzing volumes and the imbalance between buyers and sellers. It doesn't just show where the volume was—it highlights who exactly dominated: buyers or sellers, and where the market might stop in the future. You select any section of the chart, and the indicator instantly calculates the volume activity within the range, builds a volume profile by prices, and displays the balance

Média Móvel Adaptativa AMD (AAMA)
AAMA é um indicador de média móvel adaptativa para MetaTrader 4 que ajusta automaticamente sua sensibilidade de acordo com as condições do mercado. Principais recursos: Média móvel adaptativa baseada na razão de eficiência de Kaufman – reage rapidamente em tendências e filtra o ruído em mercados laterais Detecção automática das 4 fases do mercado AMD: Acumulação, Markup (alta), Distribuição, Markdown (baixa) Adaptação à volatilidade via ATR – ajusta a sensibili
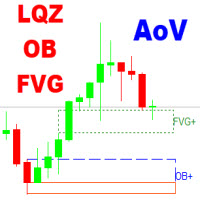
The Area of Value Detection indicator automatically identifies and highlights key institutional price zones, including Liquidity areas, Order Blocks, and Fair Value Gaps (FVG). It is designed to help traders visualize market imbalances and potential points of interest (POIs) used by smart money participants.
Main Features Liquidity Zones: Detects clusters of equal highs/lows and liquidity pools where stop orders are likely accumulated.
Order Blocks: Highlights potential bullish and bearish or
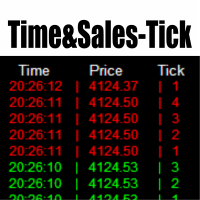
O Time & Sales Tick Indicator é um indicador para MetaTrader 5 que exibe informações de ticks em tempo real.
Ele mostra preço, volume e horário diretamente no gráfico, permitindo análise precisa da atividade do mercado.
Funcionalidades Exibe dados de ticks (preço, volume e hora) em um painel sobre o gráfico. Agrupa os ticks em intervalos definidos pelo usuário, com cores diferentes (verde para alta, vermelho para baixa). O painel pode ser posicionado em qualquer canto do gráfico, com ajuste de t
O True Range Normalized Momentum (TRNM) é um oscilador de volatilidade e momentum projetado para identificar mudanças reais de intensidade no movimento do preço , eliminando o ruído causado por oscilações aleatórias do mercado.
Ele combina a variação real do preço ( True Range ) com técnicas de normalização estatística , gerando um sinal claro e responsivo sobre a força e direção do momentum atual . ️ Conceito e Funcionamento O TRNM mede a volatilidade efetiva de um ativo at

Z-Corr — это инструмент, разработанный для анализа корреляции между двумя валютными парами. Индикатор в реальном времени отображает отклонения в движении инструментов, помогая трейдеру определить моменты, когда валютные пары начинают расходиться, и своевременно открыть позицию для получения прибыли на их последующем схождении. Основные возможности: Отображает два инструмента и сравнивает их движение. Линии и гистограммы показывают текущую динамику отклонения пар. Жёлтая гистограмма сигнализирует

MARKET SENTIENCE PRO - INSTITUTIONAL GRADE MARKET INTELLIGENCE INDICATOR Copyright 2025, Amuyunzu OVERVIEW Market Sentience Pro is a comprehensive, institutional-grade trading indicator designed to decode market behavior by combining smart money concepts, market structure analysis, liquidity zone detection, and trend confirmation into a unified system. This all-in-one solution helps traders anticipate market movements before they occur by displaying a clear, layered view of institutional footpri

Simple Delta - Client Description
Simple Delta is a clean and efficient volume delta indicator for MetaTrader 5 that displays normalized buying and selling pressure above each candle.
What You Get
The indicator analyzes real-time tick data to calculate the delta (buy volume minus sell volume) and displays a single normalized value (-10 to +10) above each candle. **Positive values** indicate buying dominance (displayed in your chosen buy color), while **negative values** show selling pressu

LiquidX Pro - Precision Reversal Engine "Professional multi-confluence reversal detector that identifies high-probability tops and bottoms using institutional liquidity sweeps, volume exhaustion, and momentum divergence" Overview LiquidX Pro - Precision Reversal Engine is a sophisticated, professional-grade indicator designed for serious traders who want to catch high-probability market reversals with institutional precision. Stop chasing breakouts that fail—start trading reversals that pay. Thi
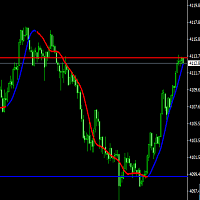
This is a professional trader's breakthrough system indicator that can be used for trading in various categories. Using the Hull moving average to create trend charts and provide price pressure and support positions, it provides traders with trading references for each cycle. Welcome to use it, if you have any questions, please contact us. The last 50 candlesticks for price pressure and support settings can be reset according to your needs
FVG Box– The Ultimate Fair Value Gap Indicator for MetaTrader 5
Developed by LiquidWave | Mohd Firuz Fahmi (Moff17) Precision Trading with Automated Fair Value Gaps
FVG Box is the next-generation Fair Value Gap (FVG) detection indicator designed for serious traders who rely on smart money concepts and institutional imbalance zones . With ultra-smooth performance and real-time updates, it automatically scans your chart to highlight potential liquidity gaps and trading opportunities wi
O Mercado MetaTrader é a única loja onde você pode baixar um robô demonstração de negociação gratuitamente para testes e otimização usando dados históricos.
Leia a visão geral e opiniões de outros clientes sobre os aplicativos, faça o download para o seu terminal e teste um robô de negociação antes de comprá-lo. Apenas no Mercado MetaTrader você pode testar um aplicativo de forma absolutamente gratuita.

Você está perdendo oportunidades de negociação:
- Aplicativos de negociação gratuitos
- 8 000+ sinais para cópia
- Notícias econômicas para análise dos mercados financeiros
Registro
Login
Você concorda com a política do site e com os termos de uso
Se você não tem uma conta, por favor registre-se