 MetaTrader 5
 Experts
 지표
 라이브러리
 유틸리티
 위젯
 규칙
MetaTrader 5용 기술 지표 - 164
 기술 지표의 시그널은 주식 및 외환 시장에서 거래를 개시 및 종료하는 데 중요한 역할을 합니다. 지표의 본질은 미래의 가격 변화를 예측하기 위한 금융 시그널 값의 수학적 변형입니다.
기술 지표를 테스트하여 시장 행동과 그로 인한 이익을 더 잘 예측할 수 있습니다.

Manipulation Hunter — Identify Market Convergence with Algorithmic Precision Manipulation Hunter is an advanced indicator engineered to detect manipulation points, structural pivots, and price convergence zones before major directional moves occur.
Powered by a proprietary multi-variable algorithm based on AMD (Accumulation – Manipulation – Distribution) principles, it automatically analyzes price action to reveal key levels where structure, momentum, and institutional footprints align. Wh
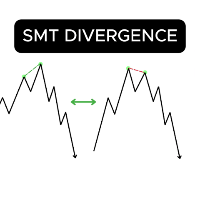
This indicator enhances traders, trend Bias by automatically detecting Smart money timing for you. It runs on historical data drawing and live detecting (OnTick).
One can set the detecting logic based on specific region/broker start hour of the day , it has color options for bullish and bearish smt and line style and width is added.
It is really effective for live trading for live detection during trade and/or trade analysis to confirm or add confluence.
More improved version are coming in fu

T3 Matrix Pro – Adaptive Trend Fusion EA T3 Matrix Pro is an advanced trend-following Expert Advisor that blends the power of T3 Moving Averages , Parabolic SAR , and Heikin-Ashi analysis into a single precision-driven system.
Designed for both scalping and swing trading, it identifies market structure shifts early and confirms them with multi-layered momentum logic. Core Logic T3 Fast & Slow Algorithm – Detects early trend transitions with exceptional smoothness. PSAR Confirmation Layer – Valid

Gann Fusion Activator Pro – Adaptive Trend Flow System Gann Fusion Activator Pro is a next-generation evolution of the classic Gann High–Low Activator , enhanced with multi-timeframe logic , visual trend zones , and a customizable signal engine .
It transforms traditional trend analysis into a modern, dynamic system that adapts to volatility, providing precise visual cues for trend shifts and momentum changes. Core Features Adaptive Gann Channel – Real-time dynamic high/low activation zones with

CRUDE OIL BUY/SELL (3 Min) Technical Overview The CRUDE OIL BUY/SELL indicator is designed for short-term traders focusing on crude oil price movements.
It identifies high-probability buying and selling opportunities based on a combination of RSI levels , SMA trend positioning , and candle structure analysis .
This tool is particularly effective on the 3-minute timeframe , providing clear visual signals and alerts for both momentum continuation and potential reversals. How It Works The indicator

The Timer PRO indicator shows a countdown for the closing of the current candle on the main chart.
Main Features:
Main Timer: Shows the remaining time for the current candle. Changes to alert color (red) when there are 10 seconds or less remaining. It is activated/deactivated with the 'T' key. Multitemporal Panel (MTF): A floating panel that displays countdowns for multiple timeframes simultaneously. When you click on a timeframe in the panel, that specific chart opens. It is activated/deactiv

PulseZones MTF Support & Resistance PulseZones MTF Support & Resistance is a precision tool designed to identify and display key Support and Resistance levels from multiple timeframes directly on a single chart.
It helps traders understand market structure at a glance by showing how price interacts with major zones across M15, H1, H4, and D1 timeframes. This indicator is built for traders who value accuracy, structure, and clarity in their analysis — from scalpers looking for intraday reaction z

OrderFlow Vision – Institutional Market Structure Visualizer OrderFlow Vision is a Smart Money Concepts (SMC) indicator designed to automatically detect and display institutional price structure directly on the chart.
It identifies and marks Order Blocks , Fair Value Gaps (FVGs) , Break of Structure (BOS) , and Change of Character (CHOCH) in real time, helping traders understand how price moves in relation to liquidity, imbalances, and structural shifts.The indicator works across all symbols and

In the fast-paced world of trading, precision and reliability are everything. Traders know that a single false signal can mean the difference between profit and loss. That’s why Super Trend Ultimate X was created: a next-generation trading indicator that takes the proven foundation of the classic SuperTrend and elevates it to an entirely new level of accuracy, stability, and performance.
Unlike the traditional SuperTrend, which relies solely on ATR calculations, Super Trend Ultimate X integrat
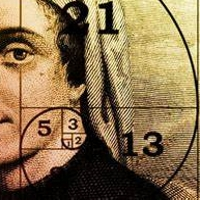
FTU Fibonacci Retrace
This indicator draws fib levels for retracement type entry systems An improved and more accurate version than the mt4 Study price movement, and use a retracement type strategy for entry at or near fib levels
Features: Multiple Fibo levels adjustable Change color and amount of bars from range
Usage : Purpose is to study or measure price retracement Change color and amount of bars from range. Use on any timeframe, product/pair, non repaint, fast loading

Mercury GUI Crypto v4.1 — Intelligent, Multifunctional Analytical Suite for Cryptocurrency and Forex Mercury GUI Crypto is a cutting-edge, next-generation indicator specifically engineered for traders active in cryptocurrency and traditional financial markets. It integrates more than 30 analytical modules, displaying critical insights directly on the chart through an intuitive graphical user interface (GUI). The indicator is ideally suited for both scalping and medium-term trading across time

Liquidity Map Overview The Liquidity Map indicator is an advanced visualization tool based on ICT Smart Money Concepts .
It automatically identifies daily Buy Zones , Sell Zones , and Liquidity Levels , showing where price is likely to reverse or continue based on institutional order flow.
It calculates key levels from the daily session — such as the previous day’s high, low, and midpoint — then derives a premium (sell bias) and discount (buy bias) structure. When price trades into these mapped

Liquidity Lens See the Market Through the Eyes of Smart Money. Liquidity Lens is a next-generation ICT-style market structure tool designed to reveal the hidden layers of institutional activity.
It automatically identifies support and resistance zones , Fair Value Gaps (FVGs) , session ranges , and market opens/closes — giving you a clean and intelligent view of how liquidity truly moves. This indicator isn’t just about drawing lines — it visualizes how liquidity forms, shifts, and gets taken ac
Ready Trade System — The All-in-One Dynamic Entry, Stop & Take-Profit Indicator
Ready Trade System is a complete trading framework designed for traders who demand clarity, precision, and confidence in every move. Built on advanced multi-filter logic, this indicator dynamically calculates and displays optimal Entry, Stop Loss, and Take-Profit levels directly on your chart — adapting instantly to market volatility and trend behavior.
This isn’t just another visual indicator — it’s a decision-ma

Channel Ultima – Indicateur multicanal dynamique
Auteur : KOUAME N'DA LEMISSA
Plateforme : MetaTrader 5 (MT5) Description: Channel Ultima est un indicateur de structure de marché avancé qui trace automatiquement trois canaux dynamiques multi-temporels.
Il permet une analyse précise de la structure des prix, des zones de support et de résistance, ainsi que des zones d'équilibre, offrant ainsi une vision claire et professionnelle du marché. Cet outil est conçu pour les traders techniques, le

NewYork_SilasFernandes: H1 Entry Killer. Green signal for buy, red for sell – no lag, no repainting. Uses real volume to filter noise, Bollinger Bands to catch perfect reversals. Advantages: enters before the move, exits at the top, works only on H1 but you can test other timeframes. Parameters: VolumeThreshold (adjusts sensitivity, default 50), BollingerPeriod (default 20, default 2 deviations), SignalColorBuy (green), SignalColorSell (red).
An indicator that puts SMC text below/above candles with green/red color for bullish/bearish candles, it finds order blocks, mitigation blocks, rejection blocks, fair value gaps, equal lows/highs, and break of structure. Text can be cluttered if multiple blocks are found, and future version might space the text from the candles a bit more. Message me if you got any requests.

Description — DS Weekly Percent The DS Weekly Percent indicator is designed to track the weekly performance of an asset, using the weekly opening price as its reference point. It automatically draws a percentage grid above and below the weekly open, creating levels that represent price variations in configurable increments (for example, ±1%, ±2%, ±3%, etc.). These levels help traders identify reaction zones and equilibrium areas in the market throughout the week. Main Features: Clear visua

Gold Flow Master — Institutional Flow Analyzer for XAUUSD Gold Flow Master reveals the hidden structure behind gold price movements by mapping institutional footprints such as Order Blocks, Fair Value Gaps, Liquidity levels, Support/Resistance, Kill Zones, and Fibonacci pockets.
It then scores the current price context to highlight the highest-probability trading zones based on real institutional behavior. Main Features Automatic Detection Bullish and Bearish Order Blocks Fair Value Gaps (FVG) L

Institutional Liquidity Map Pro is a professional MetaTrader 5 indicator designed to map institutional liquidity zones using monthly highs and lows. It automatically detects stop-hunt areas, potential reversal zones, and institutional accumulation/distribution levels. The indicator dynamically tracks up to three liquidity levels on both buy and sell sides, updated in real time. Key Features: Automatic detection of monthly high/low levels Real-time institutional liquidity zones (buy/sell) Dynamic
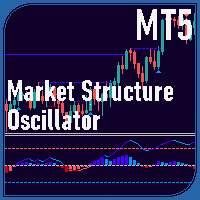
Market Structure Oscillator Overview The Market Structure Oscillator is a technical indicator designed for MetaTrader platforms to analyze market trends across multiple timeframes. It provides a clear visualization of short-term, intermediate-term, and long-term market structures through an oscillator and histogram display in a separate window. The indicator also supports optional chart objects to highlight key market structure points. Features Displays a composite oscillator combining short-ter

DailyPOC 4X — See the Market Like Never Before! If you’re tired of trading in the dark, DailyPOC 4X is designed to change the way you read price action.
This indicator highlights the most important decision zones of institutional traders, including: Daily POC (Point of Control) — the true “magnet” of price, where the highest trading volume of the day occurs. Value Area High and Low (VAH / VAL) — key regions defining the balance between buyers and sellers. Previous Days’ POCs — track how price r
Simple Smart Signal은 가격 모멘텀과 추세의 확장을 감지하도록 설계된 적응형 트렌드 지표입니다.
내부 이동 평균선 간의 간격이 신호 방향으로 확대될 때만 매수/매도 신호를 생성하며, 이를 통해 시장의 노이즈와 잘못된 진입 신호를 줄입니다. 닫힌 봉 기준으로 신호를 평가하도록 설정하면 신호는 재도(리페인트) 없이 확정되며, 차트에 안정적으로 표시됩니다.
또한 사용자는 확장을 확인할 봉 수, 분석할 최대 히스토리, 민감도를 AggressiveMode를 통해 조정할 수 있습니다. 주요 설정: arrow size (px): 화살표 크기 설정. evaluated only on closed bars: 종가 기준으로 신호를 확정. number of closed bars to verify widening: 확장 확인용 봉 수. MaxScanBars: 분석할 최대 봉 수. AggressiveMode: 민감도 (Low, Medium, High). 특징: 재도 없는 안정적인 신호. 실제
THE DAILY DECIDER BUYSELL PRO INDICATOR OVERVIEW Unlock the Market's Daily Secret: The Daily Decider BuySell Indicator is Here!
Tired of analysis paralysis? Struggling with false signals and noisy markets? What if you could know the market's primary intention within the first few hours of the day and trade with unwavering confidence?
Introducing the Daily Decider BuySell Indicator for MetaTrader 5. Pro Tip: Never Miss the first signal of the day This isn't just another indicator cluttering yo

ProxyFootprint — 개요 ProxyFootprint Advanced 는 MetaTrader 5용 주문 흐름 시각화 지표로, 다양한 가격 수준에서의 매수 및 매도 압력을 분석하여 보여줍니다. 이것이 무엇이며 (그리고 무엇이 아닌가) 중요: 이것은 실제 풋프린트 차트(footprint chart) 가 아닙니다.
실제 풋프린트 차트는 거래소나 전문 데이터 공급자로부터 각 가격 수준의 실제 호가 데이터(Bid/Ask 거래량)에 대한 접근이 필요합니다.
이 지표는 공개적으로 제공되는 틱 데이터를 기반으로 한 시각적 근사치 를 통해 풋프린트 차트에서 영감을 받은 형태로 제작되었습니다. 작동 방식 이 지표는 틱 단위의 가격 움직임을 분석하여 매수 및 매도 압력을 추정합니다: 상승 틱은 매수 압력으로 분류됩니다. 하락 틱은 매도 압력으로 분류됩니다. 각 캔들 내 여러 가격 수준에서 매수량과 매도량의 차이(델타, Delta)가 계산 및 표시됩니다. 주요 기능 다중 가격 수준 분석: 각 캔
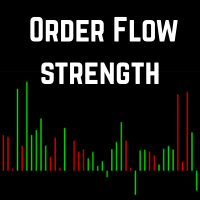
한국어 (Korean) 주문 흐름 강도 (Order Flow Strength, OFS) 설명:
이 지표는 각 캔들의 종가가 범위 내에서 어디에 위치하는지를 분석하고, 거래량으로 가중 하여 주문 흐름의 강도 를 측정합니다. 별도 창에 **매수 압력(녹색)**과 **매도 압력(빨강)**을 표시합니다. 공식 Order Flow Strength = Close − Low High − Low × Volume \text{Order Flow Strength} = \frac{\text{Close} - \text{Low}}{\text{High} - \text{Low}} \times \text{Volume} Order Flow Strength = High − Low Close − Low × Volume Close : 캔들 종가 High : 캔들 최고가 Low : 캔들 최저가 Volume : 해당 캔들의 거래량 종가의 상대적 위치(고가 근처 또는 저가 근처)와 거래량을 결합하여 시장 움직임의 강도를
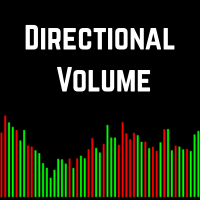
Directional Volume — 매수·매도 압력을 시각화 Directional Volume(방향성 거래량) 은 매수세와 매도세를 구분하여 직관적으로 보여주는 가볍지만 강력한 거래량 지표입니다.
단순히 총 거래량만 표시하는 대신, 매수자와 매도자 중 누가 주도하는지를 강조하여 트레이더가 시장 심리와 모멘텀의 강도를 즉시 파악할 수 있게 합니다. 기존 거래량과의 차이점 일반적인 거래량 막대가 각 캔들의 총 거래량만 표시하는 반면, Directional Volume 은 캔들의 방향에 따라 활동을 구분합니다: 초록색 히스토그램 – 강세 거래량 (종가 > 시가인 캔들) 빨간색 히스토그램 – 약세 거래량 (종가 < 시가인 캔들) 이 구분을 통해 시장이 매수세 또는 매도세 중 어느 쪽에 의해 지배되고 있는지, 그리고 모멘텀이 언제 전환되기 시작하는지를 쉽게 확인할 수 있습니다. 사용 방법 모든 차트에 지표를 추가하세요 (모든 시간대 및 종목에 호환됨) 초록색과 빨간색 히스토그램을 보며 매수

시장을 스마트하게 추적하는 방법 Big Mindset Session Finder EA 를 사용하여 명확하고 정확하며 자신감 있게 거래하세요 — MT5 차트에서 아시아, 런던, 뉴욕 세션 을 자동으로 식별하는 올인원 도구입니다. 더 이상 세션의 최고점과 최저점을 추측할 필요가 없습니다 — 이 전문가 어드바이저가 모든 것을 대신합니다! 주요 기능 자동 세션 감지
아시아, 런던, 뉴욕 세션을 차트에 즉시 색상 코드로 표시하는 수직선으로 강조하여 시장 구조를 깔끔하게 시각화합니다. 완전히 조정 가능한 시간 설정
세션 시작 및 종료 시간을 브로커 서버 시간이나 원하는 거래 시간에 맞게 쉽게 변경할 수 있습니다.
브로커가 GMT+2든 GMT-5든, 모든 설정을 완전히 제어할 수 있습니다. 아시아 및 런던 세션의 고점과 저점 빠른 확인
EA가 자동으로 아시아 및 런던 세션의 최고점과 최저점을 표시하여, 유동성 구역, 돌파 지점, 주요 반전 포인트를 정확하게 식별할 수
반응성 지표 – MT5용 경제 이벤트 시장 반응 측정 반응성 지표 는 경제 캘린더 이벤트에 대한 시장 반응을 실시간으로 분석하고 정량화합니다. 주요 경제 발표 후 10초, 30초, 60초 시점의 가격 변동(핍 단위)을 자동으로 측정합니다. 주요 기능 이벤트 자동 수집
MT5 기본 캘린더 API와 통합되어 외부 설정이 필요 없음. 뉴스 후 변동성 정밀 측정
뉴스 발표 후 가격 움직임 속도(핍/분)를 계산. 비교 분석
국가 및 이벤트 유형별로 유사 이벤트의 과거 시장 반응과 비교.
사전 시장 평가
이벤트 15분 전 시장 상태(스프레드, 변동성, 예상 영향)를 분석. 사용자 정의 알림 시스템
사운드, 팝업, 이메일, 푸시 알림 지원. 데이터 저장
모든 측정값을 CSV 형식으로 자동 저장하여 후속 분석 가능. 지능형 필터링
중요도(1~3성) 및 관련 통화별 이벤트 필터링 가능. 실용성 이 지표는 트레이더가 경제 뉴스에 대한 시장 반응을 객관적으로 정량화 하고, 역사

Heikin Ashi RSI Indicator for MT5 (HARSI) Overview
The Heikin Ashi RSI (HARSI) indicator combines Heikin Ashi candle smoothing with RSI momentum analysis, providing a dual-layer view of price action and relative strength. It offers a clear visualization of market direction, RSI-based overbought and oversold conditions, and optional backtesting and alert systems for strategy validation and trade signal automation. How It Works
The indicator applies RSI values to Heikin Ashi calculations, creati

FiboCircles Zones — Fibonacci Circles, Fan, Zones & Time Analysis Suite An all-in-one Fibonacci indicator for MT5. It combines the most widely used Fibonacci tools into a single indicator — Circles, Fan, Zones, HLines, Time Period Wave, and Time Zones — with draggable, persistent anchor lines that remember their position permanently. No need to redraw anything every time you reopen the chart. Built for traders who rely on Fibonacci as a core tool for finding support/resistance, reversal points,

Indicator: Color MACD Description:
The Color MACD Indicator is an enhanced version of the classic MACD, designed to give traders a clearer and more intuitive visual signal of market momentum and trend changes.
Unlike the standard MACD, this version adds color-coded bars and signal lines to help you identify bullish and bearish momentum instantly — without having to interpret raw histogram data. Key Features: Color-coded histogram and signal line for quick visual analysis. Detects trend

TrapSniper Pro is a professional-grade indicator built to detect genuine price action setups while identifying potential market manipulation zones.
It combines advanced candlestick pattern recognition with smart filtering logic to highlight areas where institutional players may be trapping liquidity before major price reversals or continuations. This tool is designed for traders who rely on price action, smart money concepts, and clean chart analysis without unnecessary noise. It provides visual
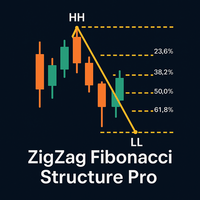
Trade smarter with ZigZag Fibonacci Structure Pro — a professional indicator that dynamically detects Higher Highs (HH), Higher Lows (HL), Lower Highs (LH), and Lower Lows (LL) in real time.
Each structural swing automatically maps a precise Fibonacci retracement , drawn only from true impulses — not minor corrections. With its elegant design, smooth visuals, and intuitive input settings, this indicator turns complex structure reading into a simple, visual process. Key features: Auto-detectio

AI SuperTrend Final – Adaptive Intelligence for Smarter Trading
The AI SuperTrend Final is not just another trend indicator—it is a next‑generation trading tool powered by adaptive intelligence. Designed for MetaTrader, this indicator combines the proven logic of SuperTrend with advanced filters such as Moving Average (MA), Average Directional Index (ADX), and a unique self‑learning mechanism. The result is a smart, evolving system that adapts to market conditions and continuously improves its
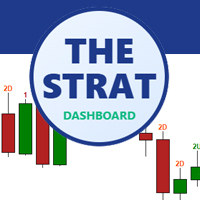
The Strat Dashboard - Rob Smith의 Strat 전략용 다중 심볼 패턴 스캐너 실시간 다중 심볼 Strat 분석으로 트레이딩을 혁신하세요 The Strat Dashboard는 Rob Smith의 유명한 “Strat” 트레이딩 방법론을 사용하는 트레이더를 위해 특별히 설계된 강력하고 전문적인 인디케이터입니다.
여러 종목을 여러 타임프레임에서 동시에 모니터링하고, 고확률 패턴을 즉시 식별하며, 중요한 매매 기회를 놓치지 마세요. MT4 Version :- https://www.mql5.com/en/market/product/153375/
“The Strat”이란 무엇인가? The Strat은 Rob Smith가 개발한 혁신적인 프라이스 액션 기반 트레이딩 전략으로, 캔들스틱 패턴과 타임프레임 간의 관계를 분석합니다.
각 캔들은 이전 캔들과의 관계에 따라 번호로 분류되어, 모든 시장, 모든 시간대 에 적용 가능한 보편적인 가격 해석 언어를 제공합니다.
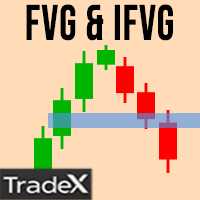
Click the link to view our products: LINK Click the link to view my best tool: LINK Description: Smart FVG & iFVG Zones Indicator MT5 accurately detects Fair Value Gaps and Inverse Fair Value Gaps based on ICT Smart Money Concepts . It automatically plots imbalance zones to reveal liquidity voids , mitigation areas , and institutional trading levels . Designed for professional traders, this tool helps you identify premium and discount zones with real-time updates. The indicator supports both bu

Symbol Changer Indicator
This is a simple yet intuitive indicator.
The indicator provide easy navigation across various symbols and across different time frames all in a chart.
The buttons are displayed on the main chart.
It is flexible and easy to use with fast response speed.
FEATURES
Use Custom Pairs : If set to true, load all the available symbols in the Market Watch. No means it loads the pairs selected below.
Pairs (Separated by Comma) : This enables selected pairs
BigMindset Liquidity & Volatility Indicator – $120 Price: $120 USD Overview:
The BigMindset Liquidity & Volatility Indicator is a powerful stand-alone tool for MetaTrader 5 that visually identifies low liquidity, high liquidity, and consolidation zones in the market. It provides traders with actionable insights to help avoid whipsaws, recognize strong momentum, and make smarter trading decisions—all without cluttering the chart. Why You Need This Indicator: Instant Market Clarity Quickly see th

Scanner Intelligence Hub - Multi-Active Monitoring 28+ Pairs Stop jumping from one chart to another. Scanner Intelligence Hub is the ultimate command center for the professional trader. Monitor dozens of assets and multiple timeframes from a single dashboard.
Technical Capabilities:
Real-time scanning: It detects candlestick patterns, mean crossovers, and RSI levels in 28 pairs simultaneously.
Customizable Panel: Choose which indicators and timeframes you want the Scanner to monitor f

Haven Fibonacci Volume Profiles — 자동 시장 범위 분석기 Haven Fibonacci Volume Profiles 를 소개합니다. 이는 시장 분석을 한 차원 높여주는 강력한 도구입니다. 이 지표는 중요한 피봇 포인트를 기반으로 구축된 핵심 가격 범위를 자동으로 식별하고, 각 범위에 상세한 볼륨 프로파일과 피보나치 레벨을 겹쳐 표시합니다. 이를 통해 트레이더는 유동성이 어디에 집중되어 있는지, 그리고 진정한 지지 및 저항 레벨이 어디에 위치하는지 즉시 파악할 수 있습니다. 다른 제품 -> 여기 . 어떤 범위가 유효한지 더 이상 추측할 필요가 없습니다. 이 지표는 과거 및 현재 가격 범위를 모두 표시하여 시장 상황에 대한 완전한 이해를 제공하며, 모든 복잡한 작업을 대신 처리해 줍니다. 주요 지표 기능 자동 범위 감지: 지표가 중요한 고점과 저점(피봇)을 자동으로 찾아 그 사이에 가격 범위를 구성합니다. 상세한 볼륨 프로파일: 각 범위에 대해 볼륨 프로파일이

VolumeTracker 4X – High-Volume Candle & VWAP Main Description: VolumeTracker 4X automatically identifies the highest-volume candle of the day in the Forex market and calculates the volume-weighted average price (VWAP) from that candle. It draws dynamic channels based on the high and low prices from the highest-volume candle to the current candle , helping you visualize key support and resistance areas . Created for traders who want more precise decisions using real trading volume as a reference.

SmartCandle 4X – Volume-Based Candles Main Description: SmartCandle 4X automatically colors each candle based on the detected volume . Low-volume candles start with soft blue tones , progressing to white, yellow, orange, red, and purple as volume increases. This allows traders to quickly identify whether the market is calm or active , supporting more strategic decisions in Forex trading. Key Benefits: Instant visualization of market activity levels . Candles colored intuitively, from low to high
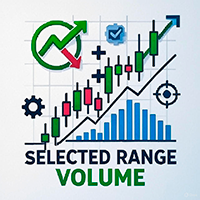
Selected Range Volume — Buyers and Sellers Balance + Volume Levels Selected Range Volume is an advanced indicator for analyzing volumes and the imbalance between buyers and sellers. It doesn't just show where the volume was—it highlights who exactly dominated: buyers or sellers, and where the market might stop in the future. You select any section of the chart, and the indicator instantly calculates the volume activity within the range, builds a volume profile by prices, and displays the balance

AMD 적응형 이동평균 (AAMA)
AAMA는 MetaTrader 4용 적응형 이동평균 지표로, 시장 상황에 따라 반응 속도를 자동으로 조정합니다. 주요 기능: 카우프만 효율 비율(Kaufman Efficiency Ratio)을 기반으로 한 적응형 이동평균 – 강한 추세에서는 빠르게 반응하고, 횡보장에서는 노이즈를 필터링 AMD의 4가지 시장 단계 자동 감지: 축적기(Accumulation), 상승기(Markup), 분배기(Distribution), 하락기(Markdown) ATR을 통한 변동성 적응 – 현재 시장 조건에 따라 민감도를 자동 조정 실시간 정보 패널: 감지된 시장 단계, 신뢰 수준, 적응 속도 표시 다중 지표 통합 시스템: ADX, RSI, MACD를 활용하여 시장 단계를 정확히 식별 빠름/느림(Fast/Slow) 참조 구역을 통해 적응 행동 시각화 사용법:
이 지표는 시장 상황에 따라 자동으로 적응 속도를 조정합니다. 강한 추세에서는 빠르게, 횡보 구간에서는 느리
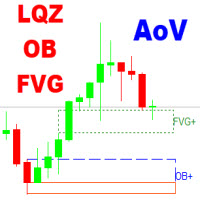
The Area of Value Detection indicator automatically identifies and highlights key institutional price zones, including Liquidity areas, Order Blocks, and Fair Value Gaps (FVG). It is designed to help traders visualize market imbalances and potential points of interest (POIs) used by smart money participants.
Main Features Liquidity Zones: Detects clusters of equal highs/lows and liquidity pools where stop orders are likely accumulated.
Order Blocks: Highlights potential bullish and bearish or
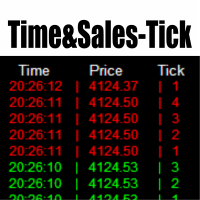
Time & Sales Tick Indicator 는 MetaTrader 5 차트에서 실시간 거래 틱 정보를 표시하는 지표입니다.
가격, 틱 거래량 및 시간을 시각적으로 보여주며, 사용자가 시장 미세 구조를 분석할 수 있도록 도와줍니다.
기능 설명 가격, 거래량 및 시간을 포함한 틱 데이터를 차트 내 패널에 실시간으로 표시합니다. 틱 데이터를 사용자가 지정한 시간 또는 수량 간격으로 그룹화하고, 상승 틱은 녹색, 하락 틱은 빨간색으로 구분하여 표시합니다. 패널은 차트의 네 모서리 중 원하는 위치로 자유롭게 이동할 수 있으며, 표시 크기와 글꼴도 사용자 설정이 가능합니다. 모든 통화쌍 및 상품에 대응하며 MetaTrader 5 플랫폼 내에서 안정적으로 작동합니다. 이 인디케이터는 스캘핑 및 틱 기반 전략을 사용하는 트레이더에게 유용합니다.

True Range Normalized Momentum ( TRNM) The TRNM is a volatility and momentum oscillator designed to identify real shifts in price strength , filtering out random market noise.
It combines the True Range with statistical normalization techniques to provide a clear, responsive signal of the current momentum strength and direction . ️ Concept and Functionality TRNM measures the effective volatility of an asset using the True Range and transforms these values into a normalized momentum indicator ,

Z-Corr — это инструмент, разработанный для анализа корреляции между двумя валютными парами. Индикатор в реальном времени отображает отклонения в движении инструментов, помогая трейдеру определить моменты, когда валютные пары начинают расходиться, и своевременно открыть позицию для получения прибыли на их последующем схождении. Основные возможности: Отображает два инструмента и сравнивает их движение. Линии и гистограммы показывают текущую динамику отклонения пар. Жёлтая гистограмма сигнализирует

MARKET SENTIENCE PRO - INSTITUTIONAL GRADE MARKET INTELLIGENCE INDICATOR Copyright 2025, Amuyunzu OVERVIEW Market Sentience Pro is a comprehensive, institutional-grade trading indicator designed to decode market behavior by combining smart money concepts, market structure analysis, liquidity zone detection, and trend confirmation into a unified system. This all-in-one solution helps traders anticipate market movements before they occur by displaying a clear, layered view of institutional footpri

Simple Delta – 클라이언트 설명 Simple Delta는 MetaTrader 5용 깨끗하고 효율적인 거래량 델타 지표로, 각 캔들 위에 정규화된 매수 및 매도 압력을 표시합니다. 제공 내용 이 지표는 실시간 틱 데이터를 분석하여 델타(매수량 − 매도량)를 계산하고, 각 캔들 위에 단일 정규화 값(-10에서 +10)을 표시합니다. 양수 값 은 매수 우위를 나타내며(선택한 매수 색상으로 표시), 음수 값 은 매도 압력을 나타냅니다(선택한 매도 색상으로 표시). 주요 특징 즉각적인 시각적 명확성: 캔들당 하나의 숫자 — 복잡함 없이 바로 활용 가능한 데이터 제공 6가지 전문 색상 테마 + 완전히 사용자 정의 가능 현재 캔들 2초마다 실시간 업데이트 차트 레이아웃에 맞게 텍스트 위치 조정 가능 M5 및 M15 시간 프레임에 최적화 복잡한 지표로 차트를 혼잡하게 만들지 않고, 깔끔하고 집중할 수 있는 주문 흐름 분석을 원하는 트레이더에게 완벽합니다.

LiquidX Pro - Precision Reversal Engine "Professional multi-confluence reversal detector that identifies high-probability tops and bottoms using institutional liquidity sweeps, volume exhaustion, and momentum divergence" Overview LiquidX Pro - Precision Reversal Engine is a sophisticated, professional-grade indicator designed for serious traders who want to catch high-probability market reversals with institutional precision. Stop chasing breakouts that fail—start trading reversals that pay. Thi
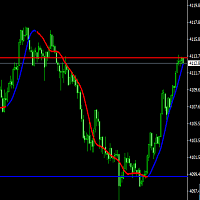
This is a professional trader's breakthrough system indicator that can be used for trading in various categories. Using the Hull moving average to create trend charts and provide price pressure and support positions, it provides traders with trading references for each cycle. Welcome to use it, if you have any questions, please contact us. The last 50 candlesticks for price pressure and support settings can be reset according to your needs
FVG Box– The Ultimate Fair Value Gap Indicator for MetaTrader 5
Developed by LiquidWave | Mohd Firuz Fahmi (Moff17) Precision Trading with Automated Fair Value Gaps
FVG Box is the next-generation Fair Value Gap (FVG) detection indicator designed for serious traders who rely on smart money concepts and institutional imbalance zones . With ultra-smooth performance and real-time updates, it automatically scans your chart to highlight potential liquidity gaps and trading opportunities wi

The Current Price Line indicator displays the current price as a real-time horizontal line on the chart. Features of the Current Price Line Unlike standard buy/sell lines, it is unaffected by spreads, enabling precise price identification. It instantly identifies reactive price zones (such as resistance/support lines), facilitating high-precision entries. It delivers high performance for scalping and day trading. Simultaneous display of lines across multiple timeframes supports multi-timeframe a
Multiple Divergence Detection System for MT5
다중 지표 ‘다이버전스’ 감지 및 시각화 도구 (Regular / Hidden, 10가지 지표 소스, 경량·고효율)
핵심 가치
• 한눈에 파악 가능한 통합 표시 – 가격과 보조지표 간의 일반 다이버전스(Regular) 및 히든 다이버전스(Hidden) 를 자동으로 감지하고, 선과 라벨로 명확하게 표시합니다. • 다중 지표 공명 분석 – MACD / MACD 히스토그램 / RSI / 스토캐스틱 / CCI / 모멘텀 / OBV / VWMACD / CMF / MFI 등 주요 보조지표를 동시에 계산합니다. 최소 공명 수(showlimit)를 설정하여 약한 신호를 제거하고 강한 다이버전스에 집중할 수 있습니다. • 유연한 표시 제어 – 라인 및 피벗 표시 여부, 지표 이름 형식(전체 / 약어 / 숨김), 최신 신호만 표시 등 다양한 시각 설정이 가능합니다. • 가볍고 효율적 – 최대 탐색 바 수, 라인 수

DS Candle Percent Panel – 한눈에 보는 시장 통합 뷰 DS Candle Percent Panel 은 각 캔들의 시가 대비 가격 변동률 을 실시간 으로 표시하는 고급형 인디케이터입니다. M1부터 D1 까지의 주요 타임프레임은 물론, H2 와 H6 같은 사용자 지정 시간대도 지원합니다. 이 도구를 사용하면 여러 차트를 전환할 필요 없이, H1에서는 상승하고 M1에서는 하락 중인지 를 즉시 확인할 수 있습니다. 모든 정보가 명확하고 일관성 있게 , 세련되고 컴팩트한 패널 로 차트에 표시됩니다. 주요 기능 각 타임프레임 (M1, M5, M10, M15, M30, H1, H2, H4, H6, D1)의 가격 변동률 (%) 표시 1초마다 자동 업데이트 되어 시장 움직임을 실시간 반영 반투명 패널 과 동적 색상 표시 (상승 = 녹색, 하락 = 분홍색) 현재 종목 및 타임프레임 을 자동 표시하는 스마트 헤더 가볍고 빠른 최적화된 디자인 트레이더를 위한 장점 멀티

Here our more valuable tools
SMC Trend Trading , Easy SMC Trading , Institutional SMC Architect Volume Analysis Tools , Volume flow Profile , Market volume profile , FVG with Volume , Liquidity Heatmap Profile , Volume Spread Analysis Purpose : Measures market pressure by analyzing tick movements, volume, and speed within a time window. How it works : Calculates weighted price changes, considers tick velocity and volatility, and applies EMA smoothing. Trading use : Strong po

Instantly identify key price action signals with an intuitive visualization indicator:
Pin Bar: The Rejection Candle. Green for a bullish close, red for a bearish close. Defined by a long wick and a small body, signaling a strong price rejection.
Inside Bar: The Consolidation Candle. Highlighted in blue, this pattern occurs when a candle trades entirely within the range of the previous one. It represents a period of market indecision and compression.
Fakey Bar: The Failed Breakout

OrderFlow Pro - Institutional Order Flow Detector Professional Order Flow Analysis for MT5 OrderFlow Pro is an advanced technical indicator designed to detect and analyze institutional order flow in real-time. The indicator provides traders with comprehensive insights into market dynamics by identifying buying and selling pressure, volume imbalances, absorption zones, trapped traders, and delta divergences. KEY FEATURES Order Flow Detection: Real-time buy and sell pressure calculation with perce

MA MTF Fijo: Smooth Curves, Clean Charts
Eliminates the visual "steps" of multi-timeframe moving averages.
Fixed MA MTF: It offers a smooth and professional line of any higher timeframe directly on your current chart.
Key Points:
No Steps: Real and smooth curve between candles (Goodbye to rough straight lines). High Performance: Optimized code; does not slow down your MetaTrader 5. Maximum Versatility: Supports all 21 timeframes and all methods (SMA, EMA, SMMA, LWMA). Multi-Market: Ideal fo

Swing and Liquidity Sweep Finder is a powerful tool designed to automatically detect swing points and liquidity sweeps on your chart.
It helps traders identify where the market is likely to grab liquidity before reversing, showing both internal and external liquidity zones with high accuracy.
This indicator is ideal for ICT and Smart Money Concept traders who rely on swing structure and liquidity manipulation for their entries and exits.
Our Team Services: If you are want to see our products cl

Composite MA Indicator - Comprehensive Guide Description:
The Composite MA indicator is a sophisticated multi-timeframe trend analysis tool that calculates the average value of multiple moving averages across a user-defined period range. It provides comprehensive market trend visualization through both a color-coded composite moving average line on the chart and an Excel-style panel displaying trend direction across 21 different timeframes. The indicator uses canvas technology for smooth GUI r

Magic History is a detailed trade visualization indicator designed to bring the full story of your trading activity directly onto the chart. If you’re a developer or trader who uses magic numbers, this is made for you. Smart pagination - never lose track of your trades again. Pagination means dividing content into separate pages instead of showing everything all at once.
In the context of your Magic History indicator:
Pagination is a system that lets you view your trades in sections (pages) — f
Advanced ZigZag Histogram with Divergence Detection and Order Flow Simulation ZigDeltaSwingPro is a comprehensive technical analysis indicator for MetaTrader 5, built on the classic ZigZag algorithm and enhanced with modern features such as divergence detection, dynamic histogram visualization, swing pattern recognition, and simulated order flow insights. Designed for scalpers and swing traders alike, it leverages MT5’s internal tick volume to deliver actionable signals—no external data feeds r
Trade Like a Serpent — Calm, Precise, Lethal. The Serpent Strategy equips you with a visual edge — clarity in confusion, precision in volatility, and confidence in timing.
Let your trades strike like a serpent — swift, silent, and accurate. Overview The Serpent Strategy is a powerful custom-built MetaTrader 5 indicator designed to identify high-probability trade zones using a unique combination of market volatility, trend direction, and momentum confirmation.
It visualizes price action in th
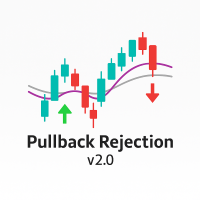
Overview Pullback Rejection v2.0 is a professional-grade visual indicator that spots continuation setups after pullbacks using Heiken Ashi logic and multi-EMA trend bias.
It is designed for scalpers and intraday traders who want clean, rule-based BUY and SELL signals aligned with trend direction only — no repainting, no noise, no counter-trend traps. Trading Concept The indicator combines EMA 7, EMA 50, and EMA 200 to define directional bias: Bias Condition Trades Allowed Bullish EMA7 > EMA200

İşte Korece çevirisi: 반전이 일어나기 전에 포착하세요 이 지표가 하지 않는 것 이것은 매수/매도 신호 생성기가 아닙니다. 거래에 언제 진입하거나 청산할지 자동으로 알려주지 않습니다. 이 지표가 하는 것 Early Reversal Detector는 가격 행동의 변화를 식별하여 최적의 진입점을 정확하게 찾아냅니다. 작동 원리 이 지표는 메인 차트의 가격 캔들과 유사한 캔들을 별도의 패널에 생성하지만 중요한 차이점이 있습니다: 일반 차트 캔들 은 모든 틱 움직임마다 형성됩니다. Early Reversal Detector 캔들 은 가격이 지정한 임계값만큼 점프할 때만 형성됩니다. 예를 들어: EURUSD에서 임계값을 "5"로 설정하면, 지표는 틱 사이에 가격이 0.00005 이상 움직일 때만 틱을 기록합니다. 더 작은 움직임은 완전히 필터링됩니다. 왜 이것이 중요한가? 노이즈를 필터링하고 중요한 가격 움직임에만 집중함으로써 가격 행동 뒤의 진짜 압력을 볼 수 있습니다. 이

ICT Unicorn Hunter – Multi-Timeframe Smart Setup Detector IMPORTANT: This is a Multi-Timeframe Scanner, looking for 'Unicorn' setups. A Unicorn in this definition is a liquidity sweep, market structure shift and creation of a Fair Value Gap overlapping with the last opposite-close candle before the liquidity sweep (breaker). This scanner does NOT provide visualisation of the Unicorn on the chart.
For visualisation, use the Unicorn Tracker indicator, which is designed to work with the Unicorn

# 랠리 하락 & 베이스 캔들 - 전문적인 패턴 인식
## 개요
랠리 하락 & 베이스 캔들은 트레이더들이 높은 확률의 수요 및 공급 구간을 파악할 수 있도록 설계된 전문적인 캔들 패턴 식별 시스템입니다. 이 지표는 기관 거래 전략의 기반이 되는 세 가지 주요 캔들 유형, 즉 랠리 캔들(강력한 매수 압력), 하락 캔들(강력한 매도 압력), 베이스 캔들(강화 구간)을 자동으로 식별하고 강조합니다.
## 주요 기능
**자동 패턴 인식** - 강력한 상승 모멘텀을 나타내는 랠리 캔들 식별 - 강력한 하락 압력을 나타내는 하락 캔들 감지 - 횡보 및 잠재적 반전 구간을 나타내는 베이스 캔들 강조 표시 - RBD, DBR, RBR 패턴을 사용한 실시간 라벨링 시스템
**완벽한 사용자 정의 설정** - 각 캔들 유형에 대한 조정 가능한 백분율 임계값 - 시각적 명확성을 위한 사용자 정의 색상 구성표 - 구성 가능한 라벨 표시 옵션 - 거래 스타일에 맞게 매개변수 미세 조정
**다중
MetaTrader 마켓은 거래 로봇과 기술 지표들의 독특한 스토어입니다.
MQL5.community 사용자 메모를 읽어보셔서 트레이더들에게 제공하는 고유한 서비스(거래 시그널 복사, 프리랜서가 개발한 맞춤형 애플리케이션, 결제 시스템 및 MQL5 클라우드 네트워크를 통한 자동 결제)에 대해 자세히 알아보십시오.
