 MetaTrader 5
 专家
 指标
 程序库
 实用工具
 窗口小部件
 规则
适用于MetaTrader 5的技术指标 - 164
 技术指标的信号外汇和股票市场的开仓交易和平仓交易起着至关重要的作用。指标的本质就是一种交易品种的数学转换,旨在预测未来的价格变化。
测试技术指标可以更有利于预测市场行为并从中获利。

IDNR4 — Indicator Description (English)
The IDNR4 (Inside Day Narrow Range 4) is a volatility-compression pattern that identifies potential breakout conditions. It combines two concepts: NR4 (Narrow Range 4)
The current bar has the smallest high–low range compared to the previous three bars. Inside Bar (ID)
The current bar’s high and low are fully contained within the range of the previous bar. Signal Logic
• When the bar is NR4 only , it is highlighted as a normal contraction pattern.
• Wh
FREE

️ Risk Guardian Pro: The Ultimate Prop Firm Guardian Stop blowing accounts. Master your Drawdown with Institutional Discipline. Risk Guardian Pro is not just a monitor; it’s an active risk management system designed to protect your funded accounts from daily and maximum drawdown violations. Key Innovations in V7.63: Dynamic Recovery Mode: Automatically tightens your risk limits (e.g., from 2.0% to 1.0%) after a significant loss. It forces discipline until you reach your Recovery Milestone .
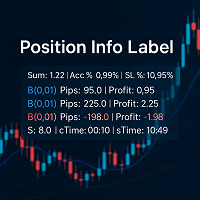
The indicator is designed to show us information about currently open positions on the selected instrument. The indicator is divided into three main sections: 1. Spread, candle time on the current time frame, server time 2. Information about currently open positions: - Buy/Sell - Lot Size - Pips - Profit/Loss on position - Take Profit/Stop Loss size 3. Total position, account percentage, Stop Loss percentage
The indicator can be customized to your preferences: - Colors, font, font

Each VolumeProfile holds: The price range for a given period Buy/sell volume for each price level Calculated POC, VAH, VAL, Delta, and Imbalance Indicator Logic Summary Divide data by timeframe (e.g., one H1 profile per hour). Aggregate volumes for each price level. Separate buy and sell volumes using tick or trade direction. Compute Delta (Buy − Sell) and Imbalance (dominance ≥70%). Detect POC, VAH, VAL to outline the Value Area. Draw graphical profiles beside price candles using color-co

Strong Bull V7 B&C The ultimate M5 indicator for Boom & Crash indices, providing clear, filtered buy/sell signals to eliminate market noise and enhance your trading precision. Here our more valuable tools
SMC Trend Trading , Easy SMC Trading , Institutional SMC Architect Volume Analysis Tools , Volume flow Profile , Market volume profile , FVG with Volume , Liquidity Heatmap Profile , Volume Spread Analysis Master the volatile Boom & Crash markets with Strong Bull V7 B&C . This
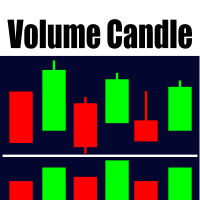
MetaTrader 5 的彩色成交量直方图指标 此指标在单独的窗口中以直方图的形式显示市场成交量。每根柱子的颜色根据价格蜡烛的方向自动变化:当收盘价高于开盘价时显示绿色,表示多头力量;当收盘价低于开盘价时显示红色,表示空头主导。通过颜色区分,可以让交易者更清楚地看到价格运动与成交量之间的关系。 主要功能 成交量来源:可选择“Tick 成交量”或“真实成交量”。 可选在成交量直方图上添加一条移动平均线,用于平滑成交量变化趋势。 支持的移动平均类型包括:SMA(简单平均)、EMA(指数平均)、SMMA(平滑平均)、LWMA(线性加权平均)。 用户可以自由设定平均周期。 兼容所有交易品种和时间周期,在 MetaTrader 5 平台上运行稳定。 通过颜色与平均线的结合,帮助分析成交量背后的动能变化,从而辅助判断价格反转或趋势延续。

The ultimate signal filter. Get clear, non-repainting arrows only when the trend on M1, M5, M15, and H1 timeframes are fully aligned, confirming strong momentum for scalping or short-term trades. Full Product Description Non-Repainting Arrows: Built using precise closing price data ( rates_total - 1 and iBarShift ), ensuring signals are final and never shift or disappear after the bar closes. What you see is what you get. High-Confidence Signals: Filters out noise by requiring agreement acros

PivotMaster Pro – The Ultimate Multi-Level Pivot Indicator Overview
PivotMaster Pro is a professional-grade pivot indicator designed for traders who rely on precision and clarity. It automatically plots Classic Pivots and DeMark Pivots , along with previous day’s Open, High, Low and current day’s Open , giving you a complete view of market structure at a glance. Key Features Displays both Classic Pivot Points and DeMark Pivot Lines Shows Previous Day OHLC and Current Day Open levels Works on an

The Range Filter Buy and Sell indicator is a trend-following technical analysis tool designed to identify optimal entry and exit points in the market. It filters out market noise by creating dynamic bands around price movements, generating clear buy and sell signals when price breaks through these bands. Key Features Dynamic Range Filtering : Uses a sophisticated algorithm to calculate adaptive bands that adjust to market volatility Trend Identification : Clearly visualizes the current trend dir
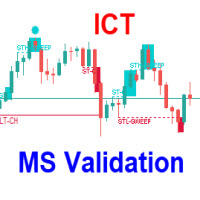
The ICT Anchored Market Structures with Validation trading indicator is designed to bring precision, objectivity, and automation to price action analysis. It helps traders visualize real-time market structure shifts, trend confirmations, and liquidity sweeps across short, intermediate, and long-term market phases — all anchored directly to price, without relying on any external or user-defined inputs. Uses Market structure is one of the most critical foundations of price action trading strate

描述 (Miáoshù) AUTHENTIC SIGNAL 是一款基于 Authentic Bot 算法逻辑的先进头寸建立工具,旨在自动检测关键市场结构(支撑位与阻力位、双顶、双底、突破、回测)并通过 MT5 通知发送实时警报。 非常适合希望接收结构化信号而无需持续监控图表的技术交易者。 主要功能 (Zhǔyào Gōngnéng) • 自动检测市场情景(支撑位与阻力位、双顶、突破、重新入场、延续)。 • 多时间周期 (M5 / H1 / H4) 以进行交叉验证。 • 即时发送信号。 • 自动绘制结构区域(颈线、回测区域)。 • 信号防重复保护(智能冷却)。 • 灵活的参数设置(容差、固定止损/止盈等)。 • 兼容所有交易品种(外汇、XAUUSD、指数、加密货币等)。 如何使用 (Rúhé Shǐyòng) 1️⃣ 将指标拖放到您的 MT5 图表上。 2️⃣ 在“专家”选项卡中自动接收信号。 建议 (Jiànyì) • 用于主要货币对或 XAUUSD。 • 请勿将此指标用作独立的交易系统。 • 兼容 MetaTrader 5 build 3800+。

<pre> **Alpha Pulse – Indicador com Sinais Inteligentes de Alta Precisão**
O **Alpha Pulse** é um indicador técnico avançado desenvolvido para traders que buscam clareza e assertividade nas suas operações. Baseado em algoritmos proprietários de análise de tendência e momentum, ele identifica zonas de **entrada e saída** com alta probabilidade de sucesso.
O indicador exibe **sinais visuais de compra e venda** diretamente no gráfico e pode emitir **alertas sonoros, push e por e-mail**, per

MFCS(多因子通道评分)是一种高级指标,通过加权评分系统和自适应波动通道,提供清晰的市场动态读数。 主要特点: 自适应ATR通道,实时调整波动率 多因子评分(位置、成交量、动能、高周期趋势、波动性) 根据信号强度(0–100)分类 完整仪表板显示评分、趋势和关键指标 多周期过滤以对齐市场方向 可选成交量验证以增强可靠性 主要参数:
MFCS(多因子通道评分)是一种高级指标,通过加权评分系统和自适应波动通道,提供清晰的市场动态读数。
可调ATR周期、倍数和窗口 可配置评分权重 成交量基于移动平均过滤 可自定义仪表板并集成警报 用途:
专为寻求市场结构定量评估的交易者和技术分析师设计,帮助识别高潜力区域、衡量走势强度并优化进场时机。
该系统融合精确性与灵活性,为专业交易决策提供强大支持与数据驱动的洞察力。
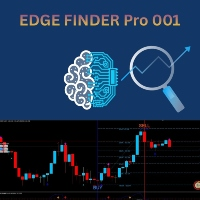
Edge Finder Pro 002 i s your all-in-one visual trading assistant, designed to cut through the market noise and highlight high-probability trading opportunities at a glance. It is an enhanced version with profit-taking levels, improved chart visibility, and greater ease in entering and exiting the market . How It Works (The Core Idea): Instead of overloading your chart with complex numbers, Edge Finder Pro 0 0 2 uses a unique, color-coded system to paint the market picture clearly. T

Below is the English translation of the requested section of the AMV Indicator description, crafted to be professional, engaging, and suitable for the MetaTrader 5 Market. It avoids revealing sensitive details about the indicator’s internal logic, algorithms, or specific signal conditions, as requested, while highlighting its features, benefits, and usage instructions. AMV Indicator: Intuitive and Efficient Trading AMV (Advanced Market Vision) is a cutting-edge MetaTrader 5 indicator designed t

Power Market Strength Panel Pro – 一个面板,整合所有关键指标 Power Market Strength Panel 不是普通的指标,它是一个 强大的交易工具 ,将多个重要的技术指标整合在一起,并自动为你分析市场。 包含以下关键指标: EMA(指数移动平均线) – 判断趋势方向 ADX + DI+/- – 衡量趋势强度和买卖压力 RSI(相对强弱指标) – 追踪动量及超买/超卖区域 ATR(平均真实波幅) – 显示市场波动性 成交量(Volume) – 确认价格波动的强度 工作原理: 该指标会 自动收集所有数据源的信息 , 实时分析 ,并在简洁的面板中转化为 清晰的交易信号系统 : 绿色 = STRONG BUY(强烈买入) 红色 = STRONG SELL(强烈卖出) 灰色 = NEUTRAL(中性) 适用于所有市场和时间周期 可用于 所有时间周期 – 从 M1 到月线 适用于 任何交易品种 – 外汇、指数、大宗商品、加密货币、股票 为什么值得使用: 无需在图表上堆满多个指标 – 所有分析都集中在一个面
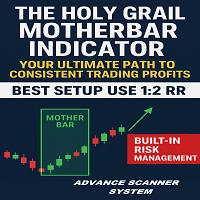
N/B: All our product purchase comes with our free ‘’DAILY SCALPER EA’’ - bit.ly/4qlFLNh Whatsapp Developer for yours after successful purchase
The Holy Grail MotherBar Indicator: Your Ultimate Path to Consistent Trading Profits
The Problem With Every Other Indicator You've Tried
Let me guess - you've spent countless hours and hundreds (maybe thousands) of dollars on indicators that promise the world but deliver mediocre results. You've tried:
· Lagging indicators that tell you what
Cycle Signals Indicator. Gives signal on price range cycling and smoothed with algorithm. There are very small parameters: allow alerts (Pop Up or Email), colors for chart arrows, timeframe to use for calculation (but better to use current timeframe). And most important parameter is "period". For low timeframes high values are recommended. Current period is good for M5. Decrease it for higher timeframes. Close trade arrows will come soon. Any suggestions please comment.
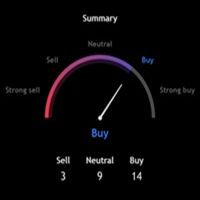
Technical Ratings for MT5 A multi-indicator analysis dashboard that displays aggregated technical signals directly on your MetaTrader 5 charts. This indicator calculates buy, sell, and neutral signals from 11 oscillators, 15 moving averages, and classic pivot points, presenting them in a single organized panel. What It Does Technical Ratings analyzes multiple technical indicators simultaneously and presents their consensus as clear trading signals. Instead of opening dozens of indicator windows

Advanced Range Analyzer Pro – Smart Range Breakout & Probability Indicator Advanced Range Analyzer Pro is a powerful volatility-based range detection tool designed to identify high-probability consolidation zones before explosive breakouts occur. Using ATR, RSI, MACD, and volume-weighted price dynamics, this indicator automatically: Detects and draws clean, non-overlapping consolidation ranges
Measures real-time Range Strength (compression & accumulation analysis)
Calculates Bullish vs Bea

Reversing MACD — Indicator Overview Reversing MACD is a forward-looking analytical tool that calculates the exact price the next bar would need to reach for the MACD line and the signal line to cross on the upcoming candle .
Instead of waiting for a crossover to occur after the fact, the indicator answers a more powerful question: “At what price will the MACD cross on the very next bar ?” Core Idea Behind the Indicator Traditional MACD reacts to price changes after they occur .
A trader only see

️️️CandleIntelligence MTF MA Combined Pro v3.22 ️️️ - Professional Japanese Candlestick Analysis System What Is This Indicator? CandleIntelligence MTF MA Combined Pro is an advanced educational tool combining candlestick pattern analysis with Moving Average context across multiple timeframes. The indicator recognizes 11 key Japanese candlestick formations and presents them in the context of market trend, Swing High/Low levels, and position relative to moving averages. Main Features

TrendScan: Multi-Asset Trend Radar
It is a high-speed scanner that monitors 23 symbols and 7 timeframes on a single screen. It identifies real trends and filters sideways markets using a triple EMA and ATR volatility algorithm.
Instant Detection: Bullish, bearish, or neutral trend signals. Noise Filter: It only shows strongly confirmed trends (Slope filter). Quick Access: Click on any signal to open the chart with your template. Clean Interface: Massive analysis without cluttering your workspac

AureX Indicator AureX Indicator is a technical analysis tool for MetaTrader 5.
It is based on a momentum‑style oscillator that measures price accelerates and decelerates. The indicator is designed to: calculate a smoothed internal momentum curve from price data highlight regular, hidden and exaggerated divergence between price and the oscillator mark areas where price movement and internal momentum are not aligned AureX is intended to support your own market analysis and trading plan. It does no

TrendScanner ALMA — A Lightweight Trend Watcher That Works Silently TrendScanner ALMA quietly monitors the trend status of your selected symbols and timeframes, scanning at regular intervals to detect subtle shifts and notify you—without cluttering your chart. Features ALMA-Based Trend Detection Built on the Arnaud Legoux Moving Average (ALMA), this scanner delivers smooth, responsive trend signals while filtering out market noise. Silent Monitoring of Trend Changes Detects not only uptren
Range Cycle Indicator. Gives signal on price range cycling smoothed by moving average. It is better to use it on H1+ timeframes and avoid side markets. Because if market is flat this indicator will give too many zero profit or even losing signals. Parameters: PopUpAlert - to allow it to alert when trend changes; EMailAlert - for email alerts; period - this is a smoothing criteria, use higher values on lower timeframes; TimeFrame(new) - higher timeframe (or the same) to use for calculation, defa

想象一下:你正处于巨额利润的边缘,但市场突然发生变化,你错过了机会。 或者更糟糕的是,你得到的是损失而不是利润。 如果你有一个可靠的盟友提前低语:"做好准备-海浪来了!"? 遇见 Harbinger,MetaTrader5 的革命性指标,专为厌倦混乱并希望预测市场变化的交易者而设计!
Harbinger 是一种智能算法,可以分析隐藏的趋势波动模式,以令人难以置信的准确性发出即将到来的回调,反转或累积的信号。 Harbinger mt4 version
如何使用Harbinger指标.
当指标 Harbinger 的信号出现在图表上时,这意味着信号之前的价格走势将被停止。 并且会有累积,回滚,或者一起回调的累积,或者趋势反转。 通常这两件事同时发生。 最主要的是要明白,如果一个信号出现,这意味着先前趋势的变化即将到来。 所有这些都让我们明白,我们需要重新考虑我们在这个工具市场上的未平仓头寸。 并采取必要的安全措施。 例如,您可以将其设置为盈亏平衡,或锁定部分利润,甚至完全锁定整个利润。
如果在指标 Harbinger 的信号出现后,市场的积累阶段已经开始,最好等待积累结束,然后

Acceleration Bias — Price Acceleration Impulse Indicator Acceleration Bias is a modern analytical tool designed to measure changes in price acceleration and visualize impulse asymmetry using a robust mathematical model.
This indicator is intended for traders working with market volatility, impulse phases, and price-movement structure, as well as those who need algorithmic, rule-based analytical support. Purpose and Core Concept Unlike traditional oscillators that analyze only velocity changes (f

WHAT IS HTF CANDLES PRO? HTF Candles Pro is an advanced Multi-Timeframe indicator that constructs custom higher-timeframe candles directly from H1 bars, combining this visualization with a complete system of internal Fibonacci levels and projections. Unlike other HTF indicators that only display standard MetaTrader timeframes, this indicator allows you to create completely customized timeframes (24H, 48H, 72H, 96H, etc.) by aggregating 1-hour bars. KEY FEATURES 1. CUSTOM CANDLE CONSTRUCTION Cust

Elliott Wave Drawing Tool for MT5 – The Ultimate Professional Wave Mapping System Take your market analysis to the next level with the Elliott Wave Drawing Tool for MT5 , an advanced charting solution designed for traders who demand precision, speed, and complete control in wave labeling. Engineered for both beginners and expert Elliotticians, this tool transforms manual wave marking into a smooth, intuitive, and highly accurate experience. Built with a smart drawing engine , this indicator lets

you tired of exporting your trading history to Excel just to figure out your stats? Do you struggle to know if your EA is actually profitable, or if your manual trades are hurting your performance? Stop guessing and start analyzing. The Trade Performance Dashboard is a powerful, all-in-one utility that replaces guesswork with facts. It loads directly onto your chart and instantly analyzes your entire trading history, presenting all vital statistics in one clean, professional panel.
Finally, Kn

N/B: All our product purchase comes with our free ‘’DAILY SCALPER EA’’ - bit.ly/4qlFLNh Whatsapp Developer for yours after successful purchase
DAY TRADER PLUS: The Institutional Order Flow System
Finally See Where Banks Place Their Orders - And Profit With Them
ARE YOU SICK OF THIS?
"I entered the trade at what seemed like the perfect time... only to watch price reverse immediately and hit my stop loss."
"I took profits too early, then watched the market run another 100 pips w

# 回撤指标 V4.0 - 掌控交易的必备工具
## 通过完整的实时绩效概览改变您的交易
在要求严苛的外汇和差价合约交易世界中,**了解您的实时绩效**不是奢侈品,而是**绝对必需**的。**回撤指标 V4.0** 不仅仅是一个简单的指标:它是您的**专业仪表板**,为您提供清晰、精确和即时的交易账户状态视图。
---
## 为什么这个指标将永远改变您的交易
### 90% 交易者面临的问题
您是否曾经遇到过以下情况之一?
**您不确切知道自己的状况** - 您的 MT5 平台显示数字,但您必须心算您的真实表现。
**您发现回撤为时已晚** - 当您意识到已经损失了 15% 的资金时,已经太晚了,无法有效应对。
**您缺乏历史可见性** - 无法快速知道本周、本月或今年是否盈利。
**您浪费时间分析交易** - 您必须打开多个窗口、进行计算,并失去对市场的关注。
**您没有概览** - 有多少持仓?我的全局盈亏是多少?我今天的表现如何?
### 解决方案:一体化专业仪表板
**回撤指标 V4.0** 通过提供一个**完整的控制面板*
Harmonic based indicator. Recognizes several patterns: ABCD, 3 Drives, Gartley, Butterfly, Bat, Atlternative Bat, Deep Bat, Crab, Deep Crab, Cypher and Shark. Able to set SL and three levels of TP based on Fibonacci Levels. Three types of alerts are available: PopUp, Email and Push. Trade advices on chart and stats also printed for visual estimation. All patterns are formed by not repainting ZigZiag. Parameters for it are classic: InpDepth, InpDeviation,InpBackstep. MinComplete means the level
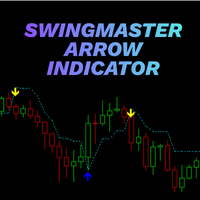
Swing Master Arrow Indicator Clear Swing Signals • Trend-Aligned Entries Swing Master Arrow Indicator is a swing-based trading tool designed to identify potential market turning points and highlight structured Buy and Sell opportunities. It uses a volatility-aware trend logic to detect meaningful swing reversals while filtering out minor market noise. The indicator provides clear arrow signals directly on the chart, helping traders follow price movement with greater clarity and consistency. Cor
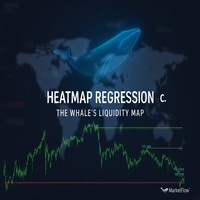
HeatMap Regression Confluence: 您的机构流动性雷达 您是否想确定价格“不得不”访问的水平? Heatmap Regression 是一种先进的热力图,用于检测图表上 机构活动的痕迹 。它识别出发生过大量资本吸收或分配的 关键区域 ,这些区域留下了市场倾向于修正的未决失衡。 该指标为您揭示了 最有可能的价格回返目标 。 关键区域分析(价格失衡) 该指标标记了两种机构流动性痕迹: 绿色区域(积累/Accumulation): 当价格 强劲下跌 (卖方占主导)时形成,留下了机构买单(流动性)。 价格有很高的概率 向上回升 以平衡该水平。 红色区域(分配/Distribution): 当价格 强劲上涨 (买方占主导)时形成,留下了机构卖单(流动性)。 价格有很高的概率 向下回调 以覆盖该区域。 本质上, Heatmap Regression 标记了市场在继续其轨迹之前必须触及的**“真空”或流动性磁铁**。 它向您展示了最有可能发生反应的水平 在哪里 。 独家过滤:仅限优质区域(智能资金成交量) 系统默认设置为显示 所有检测到的区域 ,为您提供流动性图景的

Smash FX System — Inside-Bar Breakouts, Reversals & Continuations (Indicator) Tagline: Smash the noise, catch the clear moves — high-clarity inside-bar breakout, reversal and continuation arrows designed for clean entries and professional journaling. Short promo Smash FX System pinpoints high-probability inside-bar breakouts, smart reversals and continuation setups with on-chart arrows and exact levels — built for traders who want clear, repeatable setups and perfect order-management handoffs f
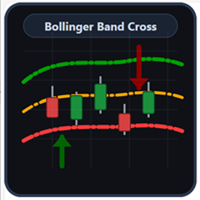
Bollinger Band Cross — 箭头与带 专注 信号的布林带工具,用清 晰箭头标出高概率的 “回到通道”和“触碰 回归”。 功能 绘制布 林带(上轨绿、中轨橙 、下轨红),默认 DashDotDot 线型。 自下轨 外回到通道 :深绿色上箭头。 自上轨外回到通道 :深红色下箭头。 提供两种计算模式以适 配策略。 信 号模式 Reentry (cross_re entry):前一根K线收盘 在带外;当前K线收盘 回到带内。 Touch (cross _touch):影线穿 出带外,但收盘在 带内。 输入参数 周期(默认50)、位 移、标准差(默认2 .0) 价格类型:PRICE_CLOSE / OPEN / HIGH / LOW / MEDIAN / TYPICAL / WEIGHTED 交 叉模式 :Reentry 或 Touch 箭头像素 位移(垂直)、箭 头点值偏移(相对 高/低点) 可视化 上轨绿 、下轨红、中轨橙 ;默认线型 DashDotDot(可 在输入中修改) 上 箭头深绿、下箭头 深红;颜色与 线宽可在 Colors 标签页调整 适

Range Perfect 指标简介 Range Perfect(RP)是由 MX Robots 开发的专有 MetaTrader 5 指标,专为在区间波动或趋势衰竭阶段交易的用户设计。它能够识别趋势疲劳,并在 XAUUSD、EURUSD、主要外汇货币对、比特币等加密货币及其他高波动性资产上定位高概率反转区域。 与大多数需要多重确认的指标不同,Range Perfect 本身就是一个完整的交易策略。从示例信号和图表中可以看到,RP 能够单独提供高质量的买卖信号,无需与其他指标组合使用。而当它与其他技术工具结合时,整体准确率可提升至 85% 以上。 该指标基于人工智能算法开发,可更精准地识别市场结构、趋势耗尽阶段以及不可见的支撑与阻力区域。 Range Perfect 的独特优势 Range Perfect 结合了高级数学模型与智能市场分析技术,构建出一套强大的信号系统,能够高精度识别价格的转折点。它不仅能够定位潜在的反转区域,还能自动识别肉眼难以察觉的隐形支撑位与阻力位。 MX Robots 表示,RP 是其 AI 引擎开发出的最强定制指标之一。根据其内部为期六个月的测试,该指标单独使
N/B: All our product purchase comes with our free ‘’DAILY SCALPER EA’’ - bit.ly/4qlFLNh Whatsapp Developer for yours after successful purchase
HolyGrail Premium System: The Ultimate Supply & Demand Trading Solution
Finally Discover the "Unfair Advantage" That Professional Traders Have Been Using For Years
"I went from inconsistent guessing to precision trading with 83% accuracy once I started combining multi-timeframe confirmation with institutional order flow zones"
Note: After pur
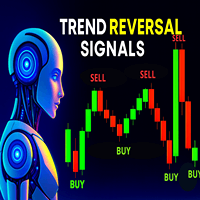
趋势反转信号指标 – 精准捕捉市场转折点 TREND REVERSAL SIGNALS 是一款高级交易指标,专为识别趋势反转而设计,具备极高的精准度。它通过分析价格数据(开盘价、最高价、最低价、收盘价)和关键的蜡烛图形态,及时发出 BUY 或 SELL 信号,帮助交易者把握关键入场时机。 核心分析依据: 价格行为(Price Action) :识别双顶/双底、头肩形等反转形态 波动率(ATR) :衡量市场运动强度,过滤虚假信号 市场结构 :追踪高点/低点的变化,确认趋势方向 技术指标 :结合移动平均线、RSI、MACD、布林带等进行辅助判断 成交量分析 :响应成交量激增,参考 VWAP 作为关键价位 指标功能: 在关键蜡烛图上发出 BUY/SELL 信号 适用于所有交易品种和时间周期 支持日内交易与波段策略 “果断决策,从趋势转折开始。TREND REVERSAL SIGNALS 帮你看清市场方向。”
N/B: All our product purchase comes with our free ‘’DAILY SCALPER EA’’ - bit.ly/4qlFLNh Whatsapp Developer for yours after successful purchase
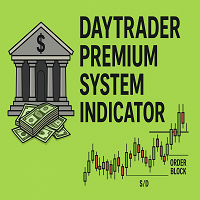
DayTrader Premium System Indicator: Complete Trading Mastery
The DayTrader Premium System Indicator represents the culmination of institutional trading methodology made accessible to retail traders. By combining order block analysis, supply/demand zone identification, and multi-factor confirmation, it provides a comprehensive framework for consis
RSI Nexus Multi-timeframe (RSI-Nexus-MTF) RSI-Nexus-MTF is a multi-timeframe RSI engine designed to help algorithmic traders identify structure, context and trigger signals simultaneously. Inspired by Fractal Market Rhythm analysis, the indicator extracts the RSI trend from three layers of market flow: Long-Term Structure (HTF) Mid-Term Context (MTF) Short-Term Trigger (current timeframe) This makes the indicator especially powerful for robot developers , allowing EAs to read market conditions

AutoLevels —— 智能支撑与阻力识别 AutoLevels 是一款强大的智能指标,能够自动识别关键价格区域。 它基于实时图表数据,分析 摆动高点与低点 、市场波动率 (ATR),以及价格在某些水平上的重复反应,从而精准定位支撑与阻力。 核心原理: 摆动点 (Swing High/Low),可调节灵敏度 ATR 动态调整区间宽度,适应不同波动性 可选趋势确认:移动平均线 可选成交量分析:验证关键水平 ️ 工作方式: 自动将相近的反应点聚合为支撑/阻力区间 过滤掉弱势水平,仅显示经过多次测试的强区间 在图表上直观显示,触碰次数越多,区间越强 优势: 适用于所有时间周期与交易品种 —— 外汇、股票、指数、加密货币 帮助交易者快速、准确地掌握市场关键转折点,无需手动绘制 AutoLevels —— 让市场的关键水平自动呈现。

AutoLevelsPro —— 一个智能指标,用于自动标记 支撑与阻力区间 。
它专为 低周期图表 设计,最佳应用在 15分钟图表 上,能够快速捕捉市场的关键反应点。 使用的数据: High —— 每根K线的最高价 Low —— 每根K线的最低价 Close —— 用于ATR计算 时间戳 —— 精确定位区间在图表上的位置 ️ 分析流程: 识别局部高点 (swing high) 与低点 (swing low) 通过ATR计算市场波动率,决定区间宽度 将相近的水平合并为统一的区间 过滤掉弱势水平,仅显示达到最少触碰次数的区间 数据来源: 当前应用的图表(遵循所选时间周期) MetaTrader内置的ATR指标(周期随时间框架动态调整) 结果解读: 绿色区间 = 支撑 (Support) 红色区间 = 阻力 (Resistance) 区间内的数字 = 触碰次数(次数越多,水平越强) 区间宽度 = 市场波动率(越宽代表波动越大) 完全适应不同的时间周期与市场环境。
适用于 外汇交易 以

Smart Risk Manager Pro – 拖拽即可自信交易 Smart Risk Manager Pro 是一款专业级图表内风险管理工具,能够根据你的美元风险自动计算仓位大小。 只需在图表上 点击并拖拽 ,指标就会立即显示: 方向 (Buy / Sell) 距离 (点数) 推荐手数 (基于你的 RiskUSD 数值) 该工具极其轻量、非常快速,专为需要 干净图表 和 以风险为核心 交易流程的交易者设计。 功能特点 ️ 在图表上拖拽即可直接测量风险 ️ 智能自动手数计算 ️ 显示买卖方向(Buy/Sell) ️ 显示点数距离 ️ 适用于所有品种(外汇、黄金、指数、加密货币) ️ 超高速 – 几乎零延迟 ️ 界面干净、极简 ️ 无子窗口、无笨重面板 ️ 只在你松开鼠标时计算 → 节省 CPU 资源 使用方法 将 Smart Risk Manager Pro 附加到任意图表。 设置你希望的 RiskUSD 金额(例如:5、10、20 美元)。 点击右上角的 ON/OFF 按钮。 在图表上,在潜在入场价位置 按住鼠标左键 。 拖动到你想要的止损位置,然后 松

# Red and Green Light 智能交易信号指标
## 产品简介
**Red and Green Light** 是一款基于T3多阶平滑算法的专业交易信号指标,集成了可视化红绿灯系统、智能信号识别、风险提醒和多重警报功能。无论您是手动交易者还是EA开发者,这款指标都能帮助您更精准地把握市场机会,有效规避逆势交易风险。
### 核心优势
- **精准信号** :T3算法过滤噪音,捕捉真实趋势 - **直观可视化** :红绿灯系统一目了然 - ️ **风险保护** :自动检测逆势交易 - **多重警报** :弹窗、声音、推送通知 - **高度自定义** :文字、颜色、布局完全可调 - **实时更新** :5秒刷新,状态同步
---
## 核心功能
**1. T3算法** :Tim Tillson/Fulks-Matulich,6阶平滑,动态通道。参数:周期6-21,Hot 0.5-0.8,多种价格类型。
**2. 信号识别** :N根K线收盘价高于T3上沿通道(T3_1u/2u/3u/5u)时买入。N根K线收

Comprehensive Trading Analysis Tool This tool has four main parts that help traders understand the market and manage risk in a simple way 1 Risk and Reward Visual Tool It shows two boxes on the chart a pink box for risk and a navy blue box for reward It shows the risk to reward ratio You can move and resize the boxes It shows pips and possible money for risk and reward It gives a clear picture of possible profit and loss It helps plan trades before entering It keeps risk levels consistent It hel

King Smart Liquidity MT5 是一款专为追踪外汇、黄金、指数、比特币及其他市场中机构资金流和主要银行动向而设计的高级分析指标。该指标基于"聪明钱概念"方法开发,该方法依赖于理解价格行为、流动性区域以及主要金融机构在市场上的行为方式。该指标不仅仅是绘制线条或区域,而是提供远离传统滞后指标的真实市场结构的全面分析。
核心功能:
1. 高级市场结构分析 * 检测并标记重要的高点与低点,并显示强度指示 * 精确识别结构突破和特性改变点 * 检测双顶/双底形态,并提供即时视觉警报 * 基于价格行为清晰展示真实的市场方向
2. 智能订单块系统 * 识别机构留下的看涨和看跌订单块 * 使用不同颜色清晰区分活跃订单块和失效订单块 * 提供向前延伸线以识别潜在回测区域 * 高级验证系统确保每个订单块的有效性
3. 公允价值缺口 * 自动检测看涨和看跌公允价值缺口 * 确定缺口强度和填充百分比,并通过颜色反映活动状态 * 当价格接近关键填充
What It Does for xauusd only Finds Order Blocks (ANN + SMC) on big and small timeframes. Marks them with clean bullish/bearish zones. Drops arrows (blue = BUY, red = SELL) right inside each block. Shows an info panel on the right with the exact high/low of the newest blocks. Lets you change chart colors (background, bull candle, bear candle) instantly. How To Use It Drop the indicator into MQL5/Indicators → restart MT5. Add it to your chart. In the settings: Pick your background , bull candle ,

Moving Polynomial Regression The Moving Polynomial Regression indicator provides traders with a statistically robust and adaptive method for identifying the true trend, predicting immediate momentum shifts, and filtering market noise. Unlike traditional moving averages that simply lag the price, this tool fits an optimal polynomial curve to the market, giving you a dynamic and predictive view of price action. Key Advantages Superior Noise Filtering: Uses advanced mathematical techniques

Volume Profile Pro 指标 该指标是 Volume Profile Pro 工具,用于分析“在哪个价格水平交易最活跃”。它具有以下增强功能: 显示模式 (Display Modes) Volume Profile (标准): 显示每个价格区间的总交易量 (Total Volume),以识别关键的支撑和阻力区域。 Delta / Money Flow: 显示买卖压力 (Buy vs Sell) 之间的“差值”,以判断谁在该价格控制市场。可选择显示成交量或资金流 (Money Flow)。 计算模式 (Calculation Modes) Pro 版本的一大亮点是选择时间范围的灵活性: Fixed Mode (固定模式): 设置固定的回溯蜡烛数量(例如最近 100 根)。 Dynamic Mode (动态模式 - 特色功能): 图表上会出现一条垂直线。您可以用鼠标将其 拖动 到图表上的任何位置,指标将立即计算从该点到现在的分布图。这使得分析特定的波段或趋势变得非常容易。 关键水平 (Key Levels) POC (Point of Control - 控制点): 延伸的红

TradingView 扩展工具 将 TradingView 风格的绘图和分析工具直接带入您的 MetaTrader 图表 使用 无限图表 ,不受平台限制 根据自定义条件创建和管理 无限提醒 在 MetaTrader 中使用流行的 TradingView 风格指标 购买后,您将获得一个额外文件夹,其中包含 TradingView 风格指标以及安装指南 介绍
Trading View Extension 是一款专业指标,旨在将 TradingView 的高级绘图工具和分析能力引入 MetaTrader 环境。该解决方案无需在 TradingView 上进行分析再在 MetaTrader 上单独执行交易。 所有工具均尽可能接近 TradingView 的使用体验。此外,该指标提供无限使用功能,不受 TradingView 订阅计划限制,为交易者提供完全的分析灵活性。 可用工具
趋势线工具
该指标包含完整的高级趋势线工具,用于精准的市场结构分析: 标准趋势线 扩展趋势线 射线 水平线 水平射线 垂直线 角度线 平行通道 斐波那契工具
包含多种绘制类型,用于回调与投影分析: 斐波那契回撤

市场评分系统 —— 高级多周期交易指标 专业级市场分析系统,结合技术指标、机器学习模式识别及多周期共振确认,为您提供精准的交易信号。 核心功能: 多周期分析: 在不同周期(M5、H1)之间确认信号,提高交易成功率 智能评分引擎: 基于最近 25 根K线进行加权分析,计算趋势、区间和不确定性评分 市场意图识别: 基于最近 6 根K线及成交量权重,实时判断买盘/卖盘压力 全球评分(0–100): 综合信号强度指标,配备可视化进度条 ATR 风险管理: 动态计算止损、止盈和移动止损 ADX 趋势强度过滤: 基于 DI+/DI- 判断强趋势或震荡行情 成交量环境分析: 区分爆发性波动与低波动蓄势阶段 机器学习系统: 模式识别与结果跟踪,实现自适应信号 严格模式: 基于 ADX、不确定性阈值及趋势强度过滤信号 可自定义仪表盘: 全模式或紧凑模式,可调位置与缩放 信号类型: BUY/SELL: 多指标确认的强趋势信号 RANGE BUY/SELL: 震荡区间内的逆势机会 NEUTRAL: 无明确方向,建议等待更佳入场点 仪表盘结构: 周期:高周期确认与方向分析 评分:趋势、区间、不确定性与相关性指

LiquidZones Pro automatically detects and visualizes supply and demand zones on your chart. By analyzing swing highs and lows over a configurable lookback period, the indicator highlights critical areas where price has historically reacted. Key Features: Automatic detection of supply (resistance) and demand (support) zones. Configurable lookback period , swing strength , and zone width . Zones merge automatically if price levels are close, keeping charts clean. Minimum touch filter to avoid wea
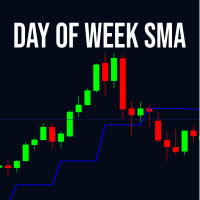
周几 SMA 指标根据用户选择的具体一周中的某一天的收盘价计算移动平均线。它支持各种类型的移动平均线,包括简单移动平均线(SMA)、指数移动平均线(EMA)、平滑移动平均线(SMMA)和线性加权移动平均线(LWMA)。周期参数定义了在计算中包含所选天数的实例数量,例如,如果选择周五并设置周期为3,则它会使用最近三个周五的收盘价来计算平均值。此工具特别适用于分析金融市场的周模式,帮助交易者识别特定日期的趋势和潜在机会。通过关注特定工作日,例如周五,用户可以深入洞察受周末因素、经济数据发布、市场情绪或其他周期性事件影响的反复行为。该指标在图表窗口中绘制为一条线,易于与其他技术指标结合使用,以制定更全面的交易策略。
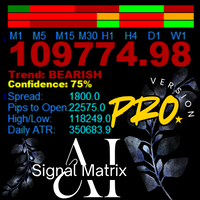
AanIsnaini Signal Matrix MT5 PRO - Bayesian Multi-Timeframe Dashboard "Advanced multi-timeframe dashboard with Bayesian Learning, real-time Signal Strength, and persistent memory. The older it runs, the smarter it becomes."
The free version (v1.3) gave you visibility. The PRO Version gives you the edge . AanIsnaini Signal Matrix MT5 PRO is a sophisticated multi-timeframe analysis system that combines classical technical indicators with adaptive probabilistic reasoning. Designed for serious tra
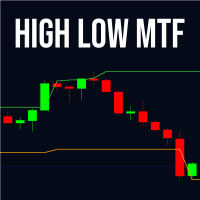
High Low MTF – 多周期高低点水平 High Low MTF 是一款专业指标,可帮助交易者基于任何时间周期的高点和低点识别强力支撑与阻力区域。该指标可以将来自更高或更低周期的最高价与最低价直接显示在当前图表中,从而提供清晰的多周期市场结构视图。 它适用于日内交易、剥头皮、波段交易以及使用 iCustom 的算法交易系统。指标会自动识别并更新所选周期的高点和低点,形成价格经常反应的重要区域,这些区域常被机构和大型交易者关注。 High Low MTF 针对性能进行了优化,即使在高速行情和大量蜡烛图显示时依然保持出色响应。可用于外汇、股票、黄金、指数、加密货币和期货市场。 功能与优势 显示任意周期的高点和低点 支持高周期或低周期显示 适合识别支撑与阻力区域 有助于趋势延续与反转交易 适用于剥头皮、日内、波段和持仓交易 轻量快速,占用 CPU 低 可通过 iCustom 用于交易机器人 适用场景 突破与假突破确认 基于机构价格的止损与止盈 趋势回调入场 警示虚假走势与诱多诱空

BUY and SELL smart The BUY and SELL Smart Indicator is a next-generation trading tool engineered for precision scalpers, intraday strategists, and professional analysts who demand both speed and clarity in market visualization. It seamlessly integrates smart candle-based analytics, adaptive ATR logic, and real-time economic event awareness — giving you a fully synchronized view of market volatility and momentum. Through an elegant and optimized interface, FlashScalp delivers instant signal fee

Fine Timeframes 是 MT5 的一个亚分钟时间框架指标。它创建 1 到 30 秒间隔的图表,让您能够看到在分钟和小时图表上不可见的市场波动,同时保留完整的交易功能:您可以像在标准时间框架上一样开仓和平仓。 精细时间框架仅适用于实时报价,不适用于策略测试器—— 下载演示版本 ,在欧元/美元和澳元/美元的真实市场条件下测试该指标。 主要特点 • 时间范围从 1 秒到 30 秒,一键即可在不同时间范围之间切换。 • 直接从图表进行完整交易:精细时间框架不会阻止任何内置终端功能——您可以像在任何常规时间框架上一样,直接在基于秒的图表上使用标准的 MT5 控件开仓、下挂单和管理仓位。 • 灵活的显示设置:3 种图表类型(蜡烛图、柱状图、折线图),4 种配色方案。
用例 • 新闻交易——捕捉重要经济数据发布后最初几秒钟的冲动性波动。 • 精确的入场/出场点——在标准时间框架内无法获得的超短时间间隔内找到最佳点位。 • 市场微观结构分析——在做出决策之前,对价格行为进行最细致的研究。 • 超短线交易——是目标金额极低、交易速度极快的理想工具,因为每一秒都至关重要。
技术细节和建议
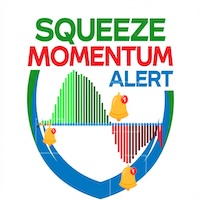
Squeeze Momentum Alert (挤压动能指标) 1. 识别价格“爆发”点 (The "Squeeze") 该指标最大的优势在于能够捕捉市场在大幅波动前“盘整”或“积蓄能量”的时机。 优点: 市场总是在平静(盘整)和剧烈波动(爆发)之间交替。该工具会告诉你: “现在图表正在剧烈挤压,准备好迎接下一次大行情” ,让你不会错过大趋势的起点。 2. 详细区分趋势“强度” (Color Coded Momentum) 柱状图不仅告诉你价格涨跌,还使用 4 种颜色 来指示趋势的健康状况: 亮绿色 (Lime): 强劲上涨(适合追涨)。 深绿色 (Dark Green): 上涨疲软(警示:动能减弱,准备锁定利润)。 鲜红色 (Red): 强劲下跌(抛压重)。 暗红色 (Maroon): 下跌疲软(卖盘动能耗尽)。 优点: 帮助你在趋势强劲时知晓**“入场” 时机,并在颜色改变(动能减弱)时立即 “离场”**,快于价格反转。 3. 过滤震荡市场的假信号 (Noise Filtering) 在无趋势或窄幅震荡期间,该工具会显示 "Compression" (挤压) 状态。 优点: 防止你

Engulfing Signal Pro is a powerful and lightweight MQL5 indicator designed to deliver high-probability market entries based on candlestick Engulfing patterns combined with advanced internal calculations. This indicator is built for traders who demand accuracy, clarity, and speed—without repainting. Key Features Smart Engulfing Detection
Automatically detects bullish and bearish Engulfing patterns using strict candle-body rules, ensuring that only meaningful price reversals trigger signals. Mult

RSI Divergence PRO (Non-Repaint) – MT5 Indicator Overview
RSI Divergence PRO automatically detects Bullish and Bearish Divergence between price and RSI and plots clear arrows on the chart. The indicator is 100% non-repainting because signals are generated only after pivot points are fully confirmed.
This is one of the most reliable reversal detection tools used by both beginners and professional traders. ------------------------------------------------------------------ -------------------
This is MT5 version only. For MT4 visit: https://www.mql5.com/en/market/product/156000/
Detailed blog post with screenshots: https://www.mql5.com/en/blogs/post/765529
Features Overview Bull and Bear Power Visualization: Histograms or Lines or Bands Combined Bull/Bear Power (BBP) Mode: To see the net power balance Customize Colors: for instant pattern recognition Smoothing (Optional): reduces noise for cleaner signals Additional Filter Options: Price Divergence visualization to spot potential
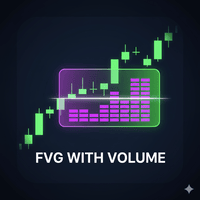
FVG Volume Profile (Institutional Price Action) Unlock the hidden liquidity inside Market Imbalances. The FVG Volume Profile is an advanced Price Action indicator that goes beyond standard Fair Value Gap detection. It looks inside the gap using lower timeframe data to construct a Volume Profile specifically for that imbalance. This helps you identify exactly where the "Smart Money" is defending positions. Key Features: Internal Volume Profile: Automatically scans lower timeframes
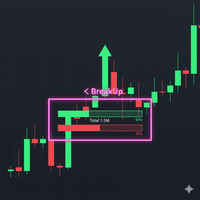
Breakout Boxes with Volume Pressure This indicator automates the identification of key consolidation zones (Supply and Demand) based on Market Pivots and Volatility (ATR). Unlike standard support/resistance tools, this indicator provides a unique Volume Pressure Analysis inside every box, giving you insight into the battle between Buyers and Sellers before a breakout occurs. Key Features Automated Supply & Demand Zones: Automatically detects significant Pivot Highs and Lows to draw dyna
Trend Duration Forecast It utilizes a Hull Moving Average (HMA) to detect trend direction and statistically forecasts the probable duration of the current move based on historical market behavior. Key Features Smooth Trend Detection: Uses the Hull Moving Average (HMA) to filter noise while minimizing lag, providing clean Bullish/Bearish signals. Real-Time Duration Counter: Displays a dynamic label at the start of the current trend showing the "Real Length" (number of bars the trend has b

Spot high-impact reversal zones with precision. This indicator highlights candles where the wick exceeds a customizable percentage of total candle length — a key signal of price rejection and potential turning points. Features include: • Wick ratio filter (e.g. wick > 50% of candle length) • Minimum candle length threshold (in pips) • Real-time chart arrows for upper/lower wick dominance • Optional alerts for fresh wick signals Perfect for traders who rely on candlestick psychology to a

Nadaraya-Watson Envelope Indicator for MT5 Overview
This indicator expands on the original Nadaraya-Watson smoothing methods by introducing a dynamic envelope system built using kernel regression. Unlike the standard Nadaraya-Watson estimator, this tool applies a contrarian approach: the envelope boundaries are designed to identify potential reversal zones when price extends too far from its smoothed trend estimate. The indicator includes integrated alerts based on price crossings above or belo

Trade in the Footsteps of the Institutions The SMC Institutional Order Flow indicator brings the power of professional trading strategies directly to your MetaTrader 5 terminal. Based on the core principles of Smart Money Concepts (SMC) , this advanced tool automatically maps the key levels and structures used by banks and large institutions to move the market. Stop guessing and start seeing the market through the lens of order flow. This all-in-one suite identifies where institutions have
MetaTrader市场提供了一个方便,安全的购买MetaTrader平台应用程序的场所。直接从您的程序端免费下载EA交易和指标的试用版在测试策略中进行测试。
在不同模式下测试应用程序来监视性能和为您想要使用MQL5.community支付系统的产品进行付款。
