Multi Time Frame Tick dashboard and signal

DUAL-ENGINE ANALYSIS SYSTEM:

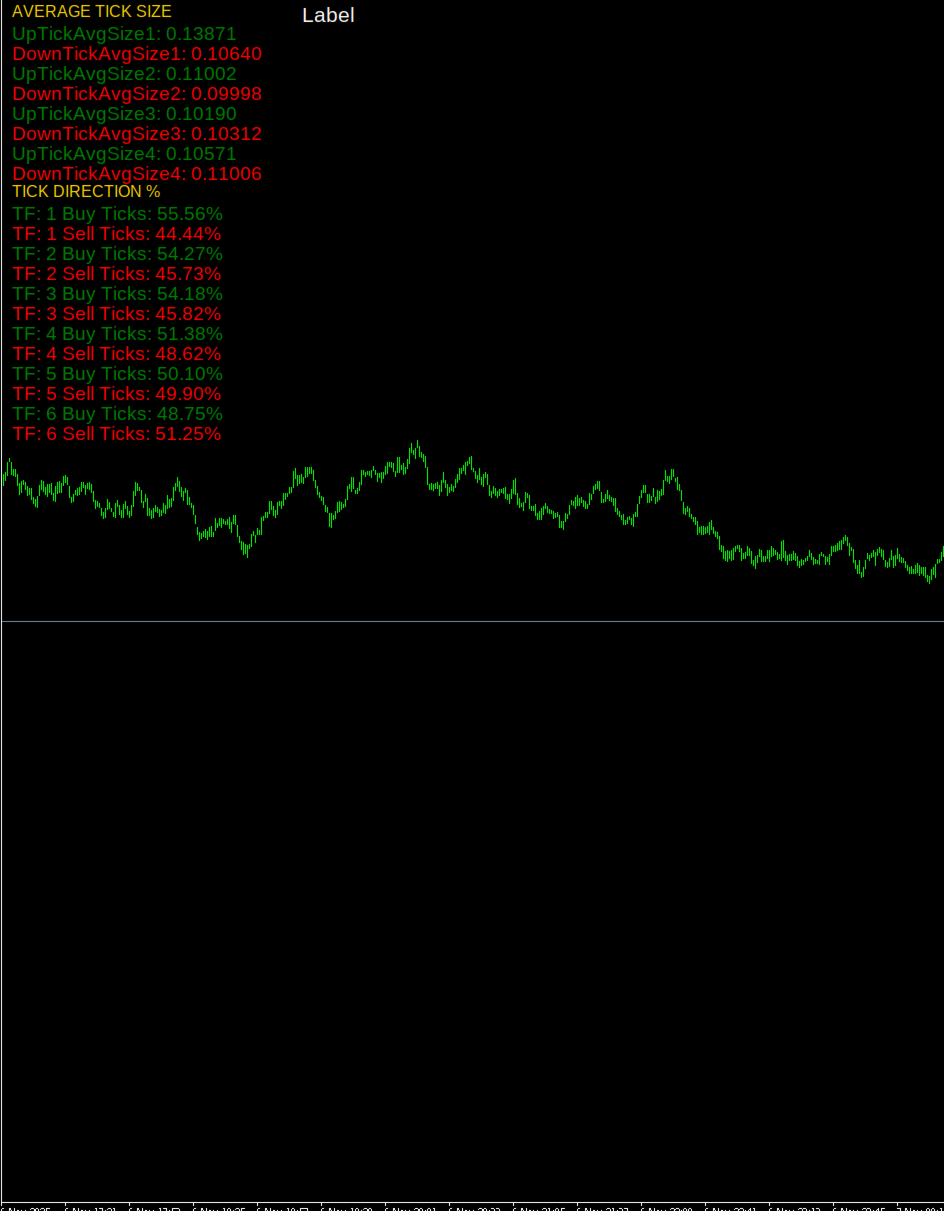
  • Average Tick Size Indicator: Measures bid movement strength across 6 customizable lookback periods (36, 96, 369, 500, 1000, 2000 ticks)

  • Multi Timeframe Tick Analyzer: Calculates buy/sell pressure percentages across 6 different timeframes (100.200,300,400,500,600 ticks)

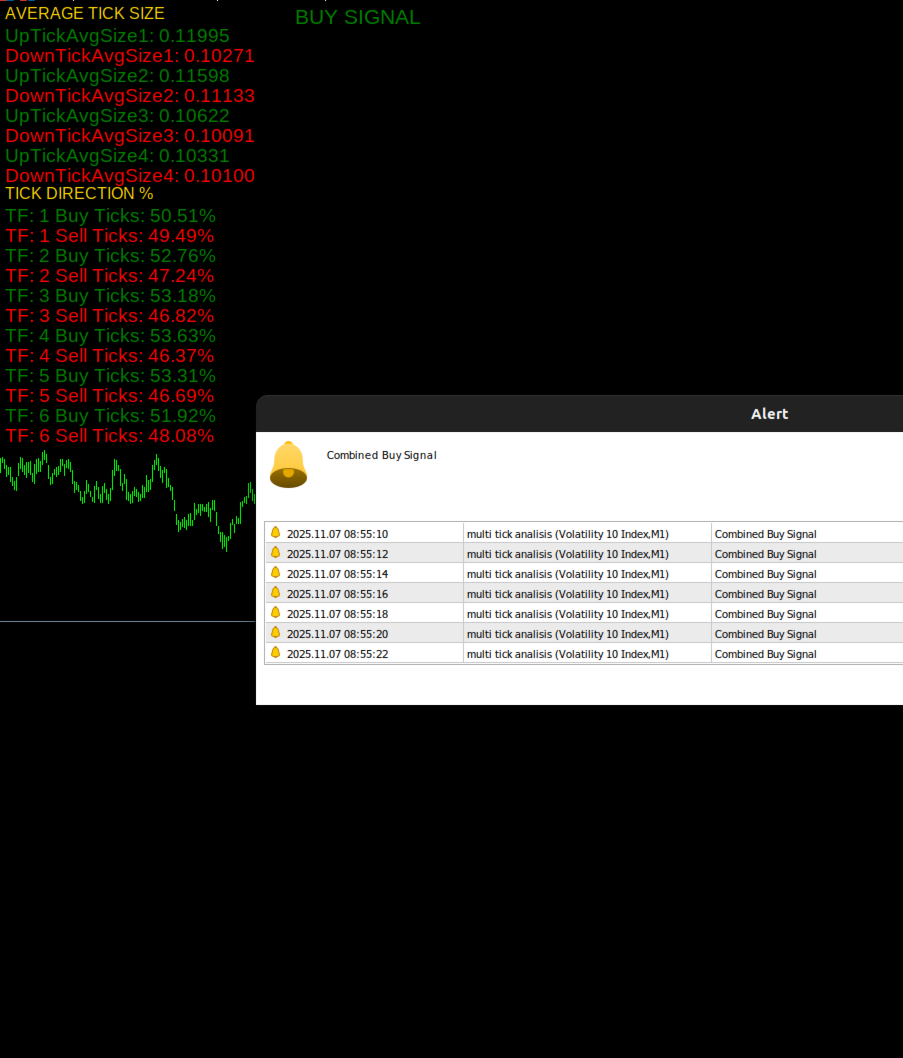
⚡ REAL-TIME SIGNAL GENERATION:

  • Combined Buy/Sell Alerts: Only triggers when BOTH analytical engines confirm the same direction

  • Visual Arrow Signals: Clear green up arrows for buy signals, red down arrows for sell signals

  • Multi-Notification System: Popup alerts, push notifications, and sound alerts

🎨 CUSTOMIZABLE DISPLAY:

  • Adjustable font sizes and colors for optimal visibility

  • Organized corner placement for clutter-free chart viewing

  • Real-time percentage and size calculations displayed clearly

🛠️ TECHNICAL SPECIFICATIONS:

  • Works on all currency pairs and timeframes

  • Compatible with MT5 platform

  • Fully customizable parameters for each analytical component

  • Efficient memory usage with optimized tick data processing

💡 PERFECT FOR:

  • Scalpers needing precise entry points

  • Day Traders seeking confirmation signals

  • Algorithmic Traders looking for reliable trigger conditions

  • Technical Analysts wanting deeper market microstructure insights

🔍 HOW IT WORKS:

  1. Tick Size Analysis: Compares average up-tick vs down-tick sizes across multiple periods

  2. Tick Direction Analysis: Calculates percentage of buying vs selling ticks across timeframes

  3. Signal Confirmation: Only generates alerts when both analyses align in the same direction

📈 TRADING ADVANTAGES:

  • Reduce false signals with dual-confirmation system

  • Understand market momentum through tick data

  • Get early warnings of potential trend changes

  • Enhance your existing trading strategy with additional confirmation


Produtos recomendados
Introducing RSIScalperPro - the revolutionary RSI-based indicator for Metatrader 5, specifically designed for scalping in the one-minute chart. With RSIScalperPro, you'll have a powerful toolkit for precise entry and exit signals to take your trading to the next level. RSIScalperPro utilizes two different RSI indicators that provide clear signals for overbought and oversold areas. You can customize the time periods and limit values of the two RSIs according to your preferences to achieve the be
Klinger Volume Oscillator  Short Description A volume-based flow analysis tool designed to visualize buying and selling pressure through a dual-colored histogram. Detailed Description The Klinger Volume Oscillator Histo is a technical analysis indicator that explores the relationship between price movement and transactional volume. By converting the traditional Klinger Oscillator into a dynamic histogram, this tool allows traders to observe the internal strength of market movements. The indicat
Visual Pulse Dynamics Flow Indicator
AL MOOSAWI ABDULLAH JAFFER BAQER
Of course. Here is an attractive and detailed description for the "Visual Pulse Dynamics Flow" indicator, designed for a sales page. Visual Pulse Dynamics Flow: Master Market Momentum Unlock a new level of market insight with the Visual Pulse Dynamics Flow indicator. Designed for the discerning trader who demands precision and responsiveness, this tool moves beyond traditional oscillators to provide a clearer, faster signal of market momentum and potential trend reversals. For just $30, gain an
The Fat and Slim indicator tracks strong and weak money in the market. It is derived from RSI, MFI and many similar indicators. Input values are closing prices and volumes. The RSI (yellow curve) is in the range -100 ... 100. It is additionally multiplied by a coefficient so that the curve is not compressed to the middle values at higher periods (a problem with the classic RSI with different periods). Strong/Fat red curve is RSI weighted by higher volumes. Weak/Slim blue curve is calculated so t
CRV Z-Score Engine is a professional market structure indicator that transforms raw price into normalized,  multi-horizon statistical structure model   It reveals: When price is statistically stretched When the market is transitioning between regimes When a move is structurally aligned across multiple horizons This is not a lagging oscillator . It is a multi-horizon statistical structure model built for serious traders. WHAT IS Z-SCORE? Z-Score measures how far price deviates from its n
Clarity Pulse Detector
Camila Bernardez Camero
Clarity Pulse Detector Clarity Pulse Detector analisa velas fechadas e suas barras de volume associadas para identificar reversões genuínas de tendência sem depender de dados futuros. O indicador calcula a força do pulso com base nos parâmetros configuráveis SSP (Signal Strength Parameter) e compara máximos e mínimos recentes para detectar pontos de rompimento. Quando as condições necessárias são atendidas em uma vela fechada, a ferramenta desenha um marcador claro de compra ou venda nessa ve
VWAP Indicator MT5
Kyra Nickaline Watson-gordon
Description : VWAP (Volume-Weighted Average Price) is the ratio of the value traded to total volume traded over a particular time horizon. It is a measure of the average price at which pair is traded over the trading horizon. Read More. All Symbols and All Timeframes are supported. Indicator Inputs :     VWAP Mode : Mode of VWAP Calculation. Options can be selected : Single,Session,Daily,Weekly,Monthly     Volumes : Real Volumes,Tick Volumes     Price Type : Used price for calculating. O
Title: Smart VP: Buy/Sell Bars + POC Description: Enhance your trading with the Right Anchored Volume Profile. Visualize buy and sell volumes per price level with near-bar numbers and identify the Point of Control (POC) instantly. Perfect for traders who want clear market structure at a glance. Features: Right Anchored Volume Profile Buy/Sell volume bars Near-bar volume numbers POC (Point of Control) line Customizable colors and display settings
Prime Master Pro: Adaptive Trading Engine with Real-Time Statistical Dashboard and Multi-Level Profit Targets. 100% Non-Repainting. Stop guessing market phases and trading blindly! PRIME MASTER PRO is a professional-grade, 100% non-repainting indicator equipped with a dual-core adaptive algorithm and a real-time statistical dashboard. Whether the market is trending or ranging, Prime Master Pro dynamically adapts its logic to find high-probability entry points. Designed for both quick intraday s
The professional browser of News and Trading Sessions is now available in MetaTrader 5. Now all the most important market information is collected on one dial! News located on the Time scale. Planning your working time has never been so easy and convenient ... The news scale can be switched a day, two, a week, a month forward or backward (see the details in the short video). All news updates in real time. Thanks to the built-in filters, you can configure the display of news by importance, cou
Indicador Crypto_Forex "HTF Bandas de Bollinger" para MT5. - Aprimore seus métodos de negociação com o indicador profissional "HTF Bandas de Bollinger" para MT5. HTF significa - Período de Tempo Superior. - Bandas de Bollinger é um dos melhores indicadores do mercado - ferramenta perfeita para negociação. - Aproximadamente 90% da ação do preço ocorre entre as duas bandas. - O indicador HTF Bandas de Bollinger é excelente para sistemas de negociação multi-período com entradas de Ação de Preço o
SyncCrosshair Pro
Jaume Sancho Serra
OVERVIEW SyncCrosshair Pro synchronizes your crosshair across all open chart windows. When you move your mouse on one chart, all other charts instantly display the crosshair at the exact same time position. Perfect for traders who analyze multiple timeframes or correlated instruments simultaneously. KEY FEATURES Multi-Chart Crosshair Sync • Vertical line synchronized by time • Horizontal line synchronized by price • Works across different symbols (EURUSD, XAUUSD, indices, crypto...) • Works ac
Vol 2 DPOC volume vol 2 DOC-dynamic horizontal volume indicator for any time periods Main settings of the indicator: Volume Source -selecting data for volumes (tick or real) DPOCOn -enabling / disabling the indicator DPOCFrom -calculation start date DPOCTo -settlement end date The indicator allows you to manually select areas on the chart to analyze changes in the maximum volume over time. You can do this by using vertical lines and moving them along the chart. Or by setting specific dates in
Inspired by the popular beat the market maker Multi MA. Now available for MT5 to be utilized. Multi Exponential Moving Average (Multi-EMA) Indicator for MT5 The Multi-EMA Indicator is designed to help traders visualize multiple exponential moving averages on one chart with precision and clarity. It plots five customizable EMA lines, each with distinct colors, making it easy to identify market trend direction, strength, and potential reversal zones at a glance. Key Features: Plots five indepen
Horizontal Volumes Indicator - using a histogram, displays the volume of transactions at a certain price without reference to time. At the same time, the histogram appears directly in the terminal window, and each column of the volume is easily correlated with the quote value of the currency pair. The indicator practically does not require changing the settings, and if desired, any trader can figure them out. The volume of transactions is of great importance in exchange trading, usually an inc
Triple Machine
Thomas Bradley Butler
Build your own model to predict averages of turning points of the Triple Moving Average Oscillator. It is simple.  Rate me with stars. Just load the indicator Triple Moving Average Oscillator in you platform and choose the period.  Scroll through to observe the averages of the highs and lows over a period of time. Add the levels for a buy and a sell on the Triple Machine and this will show the average of highs and lows to look for buys and sell. You can load multiple copies with multiple levels.
Relative Strength Levy Classic
Bruno Goncalves Mascarenhas
Relative Strength Levy   RSL Indicador Classico MT5   RSL Classico Este é o indicador clássico  "Relative Strength Levy" (RSL)   , de acordo com o estudo do Dr. Robert Levy, chamado  "O conceito de força relativa da previsão de preços de ações comuns",   que foi lançado como livro de capa dura no final dos anos 60 do século passado. Conceito chave Use este indicador em vários instrumentos para comparar sua força relativa: Os valores resultantes da análise irão oscilar em torno de 1 Os instrumen
Efficient Market Profile Professional Market Profile analysis directly on your MetaTrader 5 charts. Efficient Market Profile allows traders to visualize market structure, fair value zones, and institutional price levels using the powerful Market Profile methodology . The indicator automatically builds TPO-based profiles for each trading session , helping you quickly identify where the market spent the most time and where important price levels are forming. All elements adjust dynamically to your
The   Pairs Cross indicator   is a unique tool for negatively correlated trading instruments, such as EURUSD and USDCHF currency pairs. It is based on a concept called pairs trading (or spread trading). Our indicator compares the strength of two currency pairs that are inversely correlated and quickly tells you when it’s time to buy the first pair and short a second pair, and vice versa. This is a straightforward approach to trading currency pairs that works very well. How to you use the Pairs
Vwap Bands Auto
Ricardo Almeida Branco
O indicador Vwap Bands Auto busca mapear automaticamente a frequência máxima do mercado ( atualização automática da banda mais externa ) e possui duas bandas intermedíarias que também se ajustam à volatilidade diária. Mais uma ferramenta da White Trader que combina preço e volume, além de mapear a amplitude diária. A banda externa é atualizada automaticamente quando a máxima ou mínima diária rompe a frequência atual, e pode ser um sinal de entrada, buscando o retorno à vwap diária. Desta ma
Boom 300 AI Indicator is an AI-powered, highly accurate trading system designed for Deriv Boom & Crash indices and Weltrade Pain & Gain assets. It delivers precise spike and scalping signals, clear entries, stop-loss guidance, and smart exit alerts. Built for consistency, speed, and real profitability, this indicator helps traders trade with confidence and control using advanced AI logic. . Why Traders Are Choosing This Indicator: Advanced AI-powered logic for precision trading Highly accu
Boom 500 AI Indicator is an AI-powered, highly accurate trading system designed for Deriv Boom & Crash indices and Weltrade Pain & Gain assets. It delivers precise spike and scalping signals, clear entries, stop-loss guidance, and smart exit alerts. Built for consistency, speed, and real profitability, this indicator helps traders trade with confidence and control using advanced AI logic. . Why Traders Are Choosing This Indicator: Advanced AI-powered logic for precision trading Highly accu
Boom 600 AI Indicator is an AI-powered, highly accurate trading system designed for Deriv Boom & Crash indices and Weltrade Pain & Gain assets. It delivers precise spike and scalping signals, clear entries, stop-loss guidance, and smart exit alerts. Built for consistency, speed, and real profitability, this indicator helps traders trade with confidence and control using advanced AI logic. . Why Traders Are Choosing This Indicator: Advanced AI-powered logic for precision trading Highly accu
Boom 900 AI Indicator is an AI-powered, highly accurate trading system designed for Deriv Boom & Crash indices and Weltrade Pain & Gain assets. It delivers precise spike and scalping signals, clear entries, stop-loss guidance, and smart exit alerts. Built for consistency, speed, and real profitability, this indicator helps traders trade with confidence and control using advanced AI logic. . Why Traders Are Choosing This Indicator: Advanced AI-powered logic for precision trading Highly accu
Tired of SMC indicators that clutter your chart with random lines and overlapping boxes, obstructing your view of the price action? The  Ultimate SMC Assistant  is not just another structure mapping indicator; it is a Smart AI Trader Assistant designed specifically for Smart Money Concepts (SMC) traders and for successfully passing Prop Firm evaluations. The indicator constantly scans the market to detect the freshest and strongest reversal zones, providing you with a professional live dashboard
Dimatis Watchtower
Vincent Teddy Rakotomalala
Description: Dimatis Watchtower is a powerful backtesting tool designed for traders seeking for an efficient way to test and optimize their trading strategies on the MetaTrader 5 platform. With a minimalist interface and advanced features, this tool provides an outstanding solution for evaluating the performance of your strategies in various market conditions. Key Features: Backtesting: Perform precise and reliable backtests of your strategies using historical data from your broker directly on M
The third indicator from the set for market analysis. The first one is here:  https://www.mql5.com/ru/market/product/65258 The second one is here: https://www.mql5.com/ru/market/product/65347 The indicator builds a channel of maximum price fluctuations for a specified period. Additionally, the middle of the channel is drawn. All color settings, line types are customizable. The indicator allows you to see the picture of price movement from a slightly different angle. You can use several indic
Volatility Regime ZScore Indicator Volatility Regime ZScore is a professional volatility–regime indicator designed to  classify the market into volatility regimes : low risk (calm market), normal conditions, high risk (unstable / news / breakout environments). This indicator answers a very specific question: “Is the market currently calm, normal, or unusually risky?” It does NOT predict price direction, trends, or entry points by itself. Instead, it acts as a risk and regime filter , not signa
XFlow
Maxim Kuznetsov
XFlow shows an expanding price channel that helps determine the trend and the moments of its reversal. It is also used when accompanying transactions to set take profit/stop loss and averages. It has practically no parameters and is very easy to use - just specify an important moment in the history for you and the indicator will calculate the price channel. DISPLAYED LINES ROTATE - a thick solid line. The center of the general price rotation. The price makes wide cyclical movements around the
Trend Teller
Ian Nganga Comba
Trend Teller é uma ferramenta de painel poderosa e intuitiva projetada para oferecer uma visão panorâmica da tendência do mercado em todos os principais pares de moedas e em todos os timeframes — de M1 a MN1. Criada por traders para traders, esta ferramenta elimina o achismo na análise de tendências e ajuda você a se manter alinhado com a direção geral do mercado. A maioria dos iniciantes tem dificuldade em identificar a direção do mercado — algo que até mesmo traders experientes erram de vez em
Os compradores deste produto também adquirem
SuperScalp Pro
Van Minh Nguyen
5 (10)
SuperScalp Pro – Sistema avançado de indicador de scalping com múltiplos filtros SuperScalp Pro é um sistema avançado de indicador de scalping que combina o clássico Supertrend com múltiplos filtros inteligentes de confirmação. O indicador opera de forma eficiente em todos os timeframes de M1 a H4 e é especialmente adequado para XAUUSD, BTCUSD e principais pares Forex. Pode ser usado como sistema independente ou integrado de forma flexível a estratégias de trading existentes. O indicador integra
Divergence Bomber
Ihor Otkydach
4.89 (83)
Cada comprador deste indicador recebe adicionalmente, e de forma gratuita: A ferramenta exclusiva "Bomber Utility", que acompanha automaticamente cada operação, define os níveis de Stop Loss e Take Profit e fecha operações de acordo com as regras da estratégia; Arquivos de configuração (set files) para ajustar o indicador em diferentes ativos; Set files para configurar o Bomber Utility nos modos: "Risco Mínimo", "Risco Balanceado" e "Estratégia de Espera"; Um vídeo tutorial passo a passo que aju
Entry In The Zone and SMC Multi Timeframe is a real-time market analysis tool developed based on Smart Money Concepts (SMC). It is designed to analyze market structure, price direction, reversal points, and key zones across multiple timeframes in a systematic way. The system displays Points of Interest (POI) and real-time No Repaint signals, with instant alerts when price reaches key zones or when signals occur within those zones. It functions as both an Indicator and a Signal System (2-in-1), c
Se você comprar este indicador, receberá meu Gerenciador de Operações Profissional + EA  GRATUITAMENTE. Primeiramente, vale ressaltar que este Sistema de Trading é um Indicador Não Repintado, Não Redesenho e Não Atrasado, o que o torna ideal tanto para o trading manual quanto para o automatizado. Curso online, manual e download de predefinições. O "Sistema de Trading Inteligente MT5" é uma solução completa de trading projetada para traders novos e experientes. Ele combina mais de 10 indicadores
FX Trend MT5 NG
Daniel Stein
5 (4)
FX Trend NG: A Nova Geração de Inteligência de Tendência Multi-Mercado Visão Geral FX Trend NG é uma ferramenta profissional de análise de tendências e monitoramento de mercado em múltiplos períodos de tempo. Permite compreender a estrutura completa do mercado em segundos. Em vez de alternar entre vários gráficos, você visualiza instantaneamente quais ativos estão em tendência, onde o momentum está enfraquecendo e onde existe alinhamento forte entre diferentes timeframes. Oferta de Lançamento
Grabber System MT5
Ihor Otkydach
4.82 (22)
Apresento a você um excelente indicador técnico: Grabber, que funciona como uma estratégia de trading “tudo incluído”, pronta para usar. Em um único código estão integradas ferramentas poderosas de análise técnica de mercado, sinais de entrada (setas), funções de alertas e notificações push. Cada comprador deste indicador também recebe gratuitamente: Utilitário Grabber: ferramenta para gerenciamento automático de ordens abertas Vídeo tutorial passo a passo: como instalar, configurar e operar com
Power Candles MT5
Daniel Stein
5 (6)
Power Candles – Sinais de entrada baseados em força para qualquer mercado Power Candles leva a análise de força comprovada da Stein Investments diretamente para o seu gráfico de preços. Em vez de reagir apenas ao preço, cada candle é colorido com base na força real do mercado, permitindo identificar instantaneamente a construção de momentum, aceleração de força e transições limpas de tendência. Uma única lógica para todos os mercados Power Candles funciona automaticamente em todos os símbolos de
Trend Screener Pro MT5
STE S.S.COMPANY
4.84 (101)
Desbloqueie o poder da negociação de tendências com o indicador Trend Screener: sua solução definitiva de negociação de tendências, alimentada por lógica difusa e sistema de múltiplas moedas! Eleve sua negociação de tendências com o Trend Screener, o revolucionário indicador de tendências alimentado por lógica difusa. É um poderoso indicador de acompanhamento de tendências que combina mais de 13 ferramentas e recursos premium e 3 estratégias de negociação, tornando-o uma escolha versátil para to
AriX
Temirlan Kdyrkhan
1 (4)
AriX Indicator for MT5 A powerful trend-following and signal-evaluation tool AriX is a custom MT5 indicator that combines Moving Averages and ATR-based risk/reward logic to generate clear buy/sell signals. It visualizes dynamic SL/TP levels, evaluates past trade outcomes, and displays win/loss statistics in a clean on-chart panel. Key features include: Buy/Sell signals based on MA crossovers ATR-based SL/TP1/TP2/TP3 levels with visual lines and labels Signal outcome tracking with real-time stat
Atomic Analyst MT5
Issam Kassas
4.03 (30)
Primeiramente, vale ressaltar que este Indicador de Negociação não repinta, não redesenha e não apresenta atrasos, tornando-o ideal tanto para negociação manual quanto automatizada. Manual do utilizador: configurações, entradas e estratégia. O Analista Atômico é um Indicador de Ação de Preço PA que utiliza a força e o momentum do preço para encontrar uma vantagem melhor no mercado. Equipado com filtros avançados que ajudam a remover ruídos e sinais falsos, e aumentam o potencial de negociação.
Quantum TrendPulse
Bogdan Ion Puscasu
5 (22)
Apresentando   Quantum TrendPulse   , a ferramenta de negociação definitiva que combina o poder do   SuperTrend   ,   RSI   e   Stochastic   em um indicador abrangente para maximizar seu potencial de negociação. Projetado para traders que buscam precisão e eficiência, este indicador ajuda você a identificar tendências de mercado, mudanças de momentum e pontos de entrada e saída ideais com confiança. Principais características: Integração SuperTrend:   siga facilmente a tendência predominante do
Apresentando       Quantum Breakout PRO   , o inovador Indicador MQL5 que está transformando a maneira como você negocia Breakout Zones! Desenvolvido por uma equipe de traders experientes com experiência comercial de mais de 13 anos,       Quantum Breakout PRO       foi projetado para impulsionar sua jornada comercial a novos patamares com sua estratégia de zona de fuga inovadora e dinâmica. O Quantum Breakout Indicator lhe dará setas de sinal em zonas de breakout com 5 zonas-alvo de lucro e su
Game Changer Indicator mt5
Vasiliy Strukov
4.62 (21)
Game Changer es un indicador de tendencia revolucionario, diseñado para usarse en cualquier instrumento financiero y transformar su MetaTrader en un potente analizador de tendencias. Funciona en cualquier marco temporal y facilita la identificación de tendencias, señala posibles reversiones, actúa como mecanismo de trailing stop y proporciona alertas en tiempo real para una respuesta rápida del mercado. Tanto si es un profesional experimentado como si es un principiante que busca una ventaja com
Smart Stop Indicator – Precisão inteligente de stop-loss diretamente no seu gráfico Visão geral O Smart Stop Indicator é a solução ideal para traders que desejam definir seu stop-loss de forma clara e metódica, sem adivinhações ou decisões baseadas apenas na intuição. A ferramenta combina lógica clássica de price action (topos mais altos, fundos mais baixos) com um sistema moderno de detecção de rompimentos para identificar onde realmente deve estar o próximo nível lógico de stop. Seja em tend
OmniSync Projection
Antonio-alin Teculescu
5 (1)
Chronos Fractal Engine is an innovative price projection indicator for MetaTrader 5, designed to transform your technical analysis by intelligently identifying and projecting historical price patterns. Built upon an advanced correlation algorithm and the fractal principles of the market, this powerful tool visualizes potential future price movements, giving you a unique edge in your trading decisions. What is Chronos Fractal Engine? At its core, the Chronos Fractal Engine employs a sophisticat
RFI levels PRO MT5
Roman Podpora
3.67 (3)
O indicador mostra com precisão os pontos de reversão e as zonas de retorno de preço onde o   Principais players . Você identifica onde novas tendências estão se formando e toma decisões com máxima precisão, mantendo o controle sobre cada negociação. VERSION MT4     -    Revela seu potencial máximo quando combinado com o indicador   TREND LINES PRO. O que o indicador mostra: Estruturas de reversão e níveis de reversão com ativação no início de uma nova tendência. Exibição dos níveis de   TAKE P
FX Power MT5 NG
Daniel Stein
5 (31)
FX Power: Analise a Força das Moedas para Decisões de Negociação Mais Inteligentes Visão Geral FX Power é a sua ferramenta essencial para compreender a força real das principais moedas e do ouro em quaisquer condições de mercado. Identificando moedas fortes para comprar e fracas para vender, FX Power simplifica as decisões de negociação e revela oportunidades de alta probabilidade. Quer você prefira seguir tendências ou antecipar reversões usando valores extremos de Delta, esta ferramenta adap
Azimuth Pro
Ottaviano De Cicco
5 (4)
PROMOÇÃO DE LANÇAMENTO O preço do Azimuth Pro está inicialmente definido em 299$ para os primeiros 100compradores. O preço final será de 499$ . A DIFERENÇA ENTRE ENTRADAS RETAIL E INSTITUCIONAIS NÃO É O INDICADOR — É A LOCALIZAÇÃO. A maioria dos traders entra em níveis de preço arbitrários, perseguindo momentum ou reagindo a sinais atrasados. As instituições esperam o preço atingir níveis estruturados onde oferta e demanda realmente mudam. Azimuth Pro mapeia esses níveis automaticamente: VWA
Crystal Heikin Ashi Signals
Muhammad Jawad Shabir
5 (1)
Crystal Heikin Ashi Signals - Professional Trend & Signal Detection Indicator Advanced Heikin Ashi Visualization with Intelligent Signal System for Manual & Automated Trading Final Price: $149 ---------> Price goes up $10 after every 10 sales . Limited slots available — act fast . Overview Crystal Heikin Ashi Signals is a professional-grade MetaTrader 5 indicator that combines pure Heikin Ashi candle visualization with an advanced momentum-shift detection system. Designed for both manual traders
ARIPoint
Temirlan Kdyrkhan
ARIPoint is a powerful trading companion designed to generate high-probability entry signals with dynamic TP/SL/DP levels based on volatility. Built-in performance tracking shows win/loss stats, PP1/PP2 hits, and success rates all updated live. Key Features: Buy/Sell signals with adaptive volatility bands Real-time TP/SL/DP levels based on ATR Built-in MA Filter with optional ATR/StdDev volatility Performance stats panel (Success, Profit/Loss, PP1/PP2) Alerts via popup, sound, push, or email Cu
RelicusRoad Pro: Sistema Operacional Quantitativo de Mercado 70% DE DESCONTO ACESSO VITALÍCIO (TEMPO LIMITADO) - JUNTE-SE A 2.000+ TRADERS Por que a maioria dos traders falha mesmo com indicadores "perfeitos"? Porque eles operam Conceitos Únicos no vácuo. Um sinal sem contexto é uma aposta. Você precisa de CONFLUÊNCIA . RelicusRoad Pro não é um simples indicador de seta. É um Ecossistema Quantitativo de Mercado completo. Ele mapeia a "Estrada do Valor Justo", distinguindo ruído de rupturas estru
Este é um indicador para MT5 que fornece sinais precisos para entrar em uma negociação sem redesenhar. Ele pode ser aplicado a qualquer ativo financeiro: forex, criptomoedas, metais, ações, índices. Ele fornecerá estimativas bastante precisas e informará quando é melhor abrir e fechar um negócio. Assista o vídeo (6:22) com um exemplo de processamento de apenas um sinal que compensou o indicador! A maioria dos traders melhora seus resultados de negociação durante a primeira semana de negociação c
Gold Sniper Scalper Pro
Ich Khiem Nguyen
3.78 (9)
Gold Sniper Scalper Pro é um indicador para MetaTrader 5 construído especificamente para detectar padrões de falso rompimento (false breakout) no XAUUSD. Ele identifica a estrutura de armadilha de 4 barras onde o preço rompe o limite de um range, atrai traders de rompimento e então reverte — confirmando que o movimento foi um falso rompimento. O indicador avalia cada setup em 17 fatores de qualidade, processa através de um pipeline de confluência de 4 camadas, verifica contra um motor de consen
FX Levels MT5
Daniel Stein
5 (13)
FX Levels: Suporte e Resistência com Precisão Excepcional para Todos os Mercados Visão Geral Rápida Procurando um meio confiável de identificar níveis de suporte e resistência em qualquer mercado—incluindo pares de moedas, índices, ações ou commodities? FX Levels combina o método “Lighthouse” tradicional com uma abordagem dinâmica de vanguarda, fornecendo uma precisão quase universal. Baseado em nossa experiência real com corretores e em atualizações automáticas diárias mais as de tempo real,
Pips Stalker mt5
Abdulkarim Karazon
5 (1)
O Pips Stalker é um indicador de seta longa e curta, o indicador ajuda traders de todos os níveis a tomarem melhores decisões ao negociar no mercado, nunca repinta e usa o RSI como lógica principal do sinal; uma vez que uma seta é aplicada, ela nunca repinta ou repinta e as setas não são atrasadas. VERSÃO MT4 <---- RECURSOS DA SETA PIPS STALKER : PAINEL DE ESTATÍSTICAS UM PAINEL DE INFORMAÇÕES ÚNICO QUE MOSTRA A PORCENTAGEM GERAL DE TAXA DE VITÓRIA E ESTATÍSTICAS ÚTEIS COMO O MÁXIMO DE V
FX Dynamic MT5
Daniel Stein
5 (5)
FX Dynamic: Acompanhe a Volatilidade e as Tendências com Análise ATR Personalizável Visão Geral FX Dynamic é uma ferramenta poderosa que utiliza cálculos de Average True Range (ATR) para fornecer aos traders insights incomparáveis sobre a volatilidade diária e intradiária. Ao configurar limites de volatilidade claros —por exemplo, 80%, 100% e 130%—, você pode identificar rapidamente oportunidades de lucro ou receber alertas quando o mercado ultrapassar faixas normais. FX Dynamic se adapta ao f
LINHAS DE TENDÊNCIA PRO   -   Ajuda a entender onde o mercado está realmente mudando de direção. O indicador mostra inversões de tendência reais e pontos onde os principais participantes retornam ao mercado. Você vê     Linhas BOS   Análise de tendências e níveis-chave em prazos maiores — sem configurações complexas ou ruídos desnecessários. Os sinais não são repintados e permanecem no gráfico após o fechamento da barra. VERSÃO MT4   -   Revela seu potencial máximo quando combinado com o   indic
PZ Swing Trading MT5
PZ TRADING SLU
5 (5)
Swing Trading é o primeiro indicador projetado para detectar oscilações na direção da tendência e possíveis oscilações de reversão. Ele usa a abordagem de negociação de linha de base, amplamente descrita na literatura de negociação. O indicador estuda vários vetores de preço e tempo para rastrear a direção da tendência agregada e detecta situações nas quais o mercado está sobrevendido ou sobrecomprado em excesso e pronto para corrigir. [ Guia de instalação | Guia de atualização | Solução de prob
O Support And Resistance Screener está em um indicador de nível para MetaTrader que fornece várias ferramentas dentro de um indicador. As ferramentas disponíveis são: 1. Screener de estrutura de mercado. 2. Zona de retração de alta. 3. Zona de retração de baixa. 4. Pontos de Pivô Diários 5. Pontos Pivot semanais 6. Pontos Pivot mensais 7. Forte suporte e resistência com base no padrão harmônico e volume. 8. Zonas de nível de banco. OFERTA POR TEMPO LIMITADO: O indicador de suporte e resistência
Trend Forecaster
Alexey Minkov
5 (7)
The Trend Forecaster indicator utilizes a unique proprietary algorithm to determine entry points for a breakout trading strategy. The indicator identifies price clusters, analyzes price movement near levels, and provides a signal when the price breaks through a level. The Trend Forecaster indicator is suitable for all financial assets, including currencies (Forex), metals, stocks, indices, and cryptocurrencies. You can also adjust the indicator to work on any time frames, although it is recommen
Mais do autor
Adjustable Consecutive Fractals  looks for 2 or more fractals in one direction and sends out a on screen alert, sound alert and push notification, for strong reversal points . Adjustable Consecutive Fractals, shows the fractals on chart along with a color changing text for buy and sell signals when one or more fractals appear on one side of price. Adjustable Consecutive Fractals is based Bill Williams Fractals . The standard Bill Williams fractals are set at a non adjustable 5 bars, BUT withe th
This indicator/dashboard , is place on a single symbol. It shows the percentage of movement withing all time frames from M1 to W1.The text will change green if all % are in the positive for a buy signal.The text will change red if all %  are below zero and in negative for a sell signal. There are audible notifications, as well as on screen notifications along with push notifications that can be turned on and ON/OFF in the settings. This is a sure way to Find trends quickly and efficiently, with
Dynamic Dollar Value Indicator - Know Your Risk Before You Trade! Stop guessing and start knowing exactly what every price move means in real dollar terms! The Dynamic Dollar Value Indicator is an essential tool for professional traders who want instant visibility into the monetary value of price movements for any trading instrument. KEY FEATURES: REAL-TIME DOLLAR CALCULATIONS: Instantly displays the dollar value of 1% price moves for any symbol Automatically adapts to Forex, Stocks, In
Filtro:
Sem comentários
Responder ao comentário