Buy and Sell Volume Spikes Indicator

5

Hello Guys,

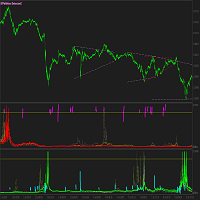
WinningSpell Indicator (No Repaint) shows Buyers and Sellers activity on any given chart and timeframe of any quote that is available in MT4 platform. It calculates those values by a sophisticated formulae that I have discovered a long time ago and improved over the years. It uses OHLCV values of every M1 bar to make the calculation for any timeframe by a formulae and represents those values via oscillator creating waves of spikes. It can be easily used as a system by its own, or become a great addition to the system and trading style of your own choice. If using as a system on it's own (without any other indicator/analysis or addition), the simplest and most accurate way is to enter any Divergence/Convergence Spikes formations with 2-3 Higher timeframe confirmations with same method (Divergence/Convergence Spikes), those signals will guarantee you approximately not just every 9 out of 10 wins, but also a Fast Market Reaction, meaning the price will go maximum possible number of pips over a minimum possible amount of time spent (or in simple words - there will be a Volatility Corridor Break Out). The cleaner and more eye-catching 2-3 spikes divergence/convergence occurrence on the chart (meaning the easier it was spotted by you) with 2-3 higher timeframe confirmation - The more aggressive Volatility Corridor Break Out will follow. All what you will need is a simple 3-5 days of observation/analysis experience and you will discover so many hidden/profitable opportunities that you didn't take into account before, and the most amazing thing is - Those hidden/profitable opportunities are completely logical! They follow precise Buyers/Sellers Divergence/Convergence algoes and they are the same for all of the charts and timeframes. All you will need is a simple experience, as in order to extract the most potential of the system on its own - is to understand the pips/time spent values for volatility break out corridors according to timeframe correlations so you can extract up to 95% of all trend movement correctly (and that would be the skill to aim for).


My WinningSpell indicator never repaints and never will be, as soon as the bar of your timeframe has formed, the OHLCV values will never change, as the formulae is applied - there only can be one strict outcome value. After the bar close of your timeframe, all those values you see in realtime, you will see on history. Those Magenta and Aqua highlighted values are from RSI indicator which I obviously will send for free, it works well with my Triangle Scanner to determine a pre-breakout volatility corridor. I understand that some people may not have a big experience in volatility break out determinations, I made it simpler for them - I decided to gift for free my Triangle Scanner as the addition to WinningSpell, it will find all those volatility pre-break out patterns for you, so it will be much easier for you and more interesting to be at the right time, at the right place, and decide very wisely "AT THE RIGHT RISK". Firstly increase the probability based on your experience to be at the right time, at the right place with lower risk, and only after a decent amount of experience, increase the lower risk to the right amount of risk that suits your confidence based on experience (Did you get your last winning streak trades 9 out of 10? And most importantly - did all of your winning streak trades went the way you expected?), even if they did remember - Market Can Easily Correct your winning streak if you are impatient - Trust me those patterns are everywhere/they are all over the place, they are all logical, they are just hidden on the charts and they will appear and repeat themselves again and again, hence there is no reason for being impatient at all, and don't forget again - Money Management is a psychological state where you are able to accept any amount based on the financial ceiling you have, which world and societies influenced you to have. You are the only one to change it/correct it based on what you really want and desire.

The key is to get into the market right before the volatility corridor breaks out (wasting less time, gaining more profit and amazing feeling of being right) - being at the right time, at the right place. And extract the most of the corridor's breakouts (80% is the perfect result), with experience it will rise up to 95%, Why? Because your Close Position signal will become the Open Position of the opposite signal. Why? Because the same market logic and the same Divergence/Convergence algoes will occur there!! But that type of trading is the skill to aim for - It will take a lot and a lot of experience, it will take years, but this is where the real market understanding comes from. And also remember the first 5% of the start of a new trend and the last 5% of the end of the trend - Are the most expensive. Hence, simply stick to 80% and most importantly aim to enter at the right time and at the right place, as you don't want to get stuck in EWA formation patterns like Diagonal Triangles, which get extended and extended. It simply not just worth of your time - trust me.

We all decide how to spend our time - The wiser we spend it in our life, the more easier/enjoyable and profitable our trading will be. There is something amazing/fascinating about the feeling of getting it right at the right moment and at the right time, and this exact vibe of energy feeds us and drives us extremely fast to our financial goals that we never aimed before. And also remember, the money management isn't just about maths and derivative numbers of your capital. Money management is your psychological state that allows you to gain/accept any amount that is beyond your financial ceiling. Money management is about being right, at the right time, at the right place with the right amount of risk!! Money management is your psychological state that accepts any amounts beyond your financial ceiling, which got limited due to the world's influence on you and you are the only one to remove those limitations (not by increasing risk like others do and lose, but by increasing the probability that you will be at the right time, at the right place with the right risk as more often as possible. This are just some simple bits of my 17 years of Programming/Trading experience in Forex Market.

I offer lifetime license for my WinningSpell with my Triangle Scanner and my mod of free RSI indicator for $50 only. All my templates and settings will be sent to you with brief/simple explanation on how to use them at fullest. Contact me via MQL5 Chat.

-------------------------------------------------------------------------------------------------------------------------------------------

Здравствуйте,

Индикатор WinningSpell (без перерисовки) показывает активность покупателей и продавцов на любом графике и таймфрейме любой котировки, доступной в платформе MT4. Он рассчитывает эти значения по сложной и уникальной формуле, которую я разработал давно и совершенствовал с годами. Он использует значения OHLCV (Цена: Открытия/Максимальная/Минимальная/Закрытия и Обьём) каждого бара M1 для расчёта по формуле на любом таймфрейме и представляет эти значения ввиде осциллятора, создавая волны спайков. Его можно легко использовать как самостоятельную систему, или же он может стать отличным дополнением к любой системе и стилю торговли по вашему выбору. При использовании в качестве самостоятельной системы (без каких-либо других индикаторов/анализа или дополнений), самый простой и точный способ - входить в любые формации Дивергенций/Конвергенций спайков с двумя-тремя подтверждениями на более высоких таймфреймах относительно вашего текущего таймфрейма, с помощью того же метода (Дивергенций/Конвергенций спайков), эти сигналы гарантируют вам не просто вероятность 9 из 10-ти прибыльных трейдов, но и быструю реакцию рынка, то есть, цена пройдет максимально возможное количество пунктов за минимально возможное количество времени (или простыми словами - произойдет Разрыв Коридора Волатильности). Чем заметнее 2-3 дивергенции/конвергенции на графике (то есть, чем легче вы их заметили) с двумя-тремя подтверждениями на более высоких таймфреймах - тем агрессивнее последует Разрыв Коридора Волатильности. 

Всё, что вам нужно, - это 3-5 дней наблюдений/анализа, и вы обнаружите столько скрытых/прибыльных возможностей, которые раньше не принимали во внимание, и что самое удивительное - эти скрытые/прибыльные возможности полностью логичны! Они следуют точным алгоритмам дивергенций/конвергенций покупателей/продавцов, и они одинаковы для всех графиков и таймфреймов. Всё, что вам потребуется, - это простой опыт, так как для извлечения наибольшего потенциала из системы, нужно понимание пропорций количества пройденных пунктов относительно пройденного времени для точного определения Разрыва Коридоров Волатильности в соответствии с корреляциями таймфреймов, чтобы вы могли правильно извлекать до 95% всех трендовых движений (и это было бы мастерством, к которому нужно стремиться).

Мой индикатор WinningSpell никогда не перерисовывается и никогда не будет перерисовываться, как только сформировался бар вашего таймфрейма, значения OHLCV никогда не изменятся, их и использует формула, соответственно конкретное итоговое значение может быть только одним. После закрытия бара вашего таймфрейма все те значения, которые вы видите в реальном времени, вы увидите и на истории. Те значения, которые выделены пурпурным и голубым цветом, относятся к индикатору RSI, который я, вышлю бесплатно, он хорошо работает с моим Сканнером Треугольников для определения Разрыва Коридоров Волатильности.

Я понимаю, что у некоторых людей может не быть большого опыта в определении Разрыва Коридоров Волатильности, поэтому я решил подарить бесплатно свой Сканер Треугольников в качестве дополнения к WinningSpell, он найдет для вас абсолютно все эти паттерны (предшествующие Разрыву Коридоров Волатильности), любой фрактальности (не упуская ни одного) исходя из глубины сканирования которая будет задана и отобразит их на вашем графике, соответственно вам будет намного проще, интереснее и увликательнее оказаться в нужное время, в нужном месте и принять правильное решение «С ПРАВИЛЬНЫМ РИСКОМ». Сначала увеличьте вероятность, основанную на вашем опыте, чтобы оказаться в нужное время в нужном месте с меньшим риском, и только после приличного количества опыта, увеличьте меньший риск до правильного количества риска, которое соответствует вашей уверенности, основанной на вашем опыте (Получили ли вы в своей последней прибыльной серии 9 из 10-ти трейдов? И самое главное - все ли ваши сделки из прибыльной серии прошли так, как вы ожидали?), даже если это случилось именно так, никогда не забывайте - Рынок может легко скорректировать вашу серию прибыльных трейдов, если вы нетерпеливы - Поверьте мне, эти паттерны повсюду/они повсюду, они все логичны, они просто скрыты на графиках, и они будут появляться и повторяться снова и снова, следовательно, нет причин для нетерпеливости, и не забывайте никогда - Управление капиталом - это психологическое состояние, когда вы способны принять любую сумму, исходя из вашего финансового потолка, который мир и общество установили вам. Только вы можете изменить/исправить этот финансовый потолок, исходя из того, чего вы действительно хотите и к чему стремитесь.

Главное - входить в рынок прямо перед Разрывами Коридоров Волатильности (тратить меньше времени, получать больше прибыли и потрясающее чувство понимания механики рынка) - быть в нужное время в нужном месте. И извлекать максимум потенциального движения из Разрыва Коридоров Волатильности (80% - идеальный результат), с опытом этот показатель вырастет до 95%, почему? Потому что, сигнал закрытия вашей позиции становится сигналом открытия противоположной позиции. Почему? Потому что, там будет действовать та же самая логика рынка и те же алгоритмы Дивергенций/Конвергенций!!! Но, именно к такому типу торговли нужно стремиться - это потребует много и много опыта, это займёт годы, но именно здесь и приходит настоящее понимание механики рынка. И также помните что, первые 5% начала нового тренда и последние 5% конца текущего тренда - самые дорогие. Поэтому просто придерживайтесь правилу 80% и, самое главное, старайтесь входить в рынок в нужное время и в нужном месте, так как вы не хотите застрять в таких паттернах как диагональные треугольники (Это просто не стоит вашего времени - поверьте мне), которые расширяются и расширяются постоянно, а разворота так и не будет (Он будет когда эти паттерны все сломаются, соответственно расширяться тенденция уже не сможет, так и начинается её излом).

Мы все решаем, как проводить своё время - чем разумнее мы проводим его в жизни, тем легче/приятнее и прибыльнее будет наша торговля. Есть что-то удивительное/захватывающее в том чувстве, когда всё получается в нужный момент и в нужное время, и именно эта энергетическая вибрация питает нас и заставляет двигаться к нашим финансовым целям так быстро, как нам этого никогда ранее не удавалось. И помните, что, управление капиталом - это не только математика и производные нашего риска. Управление капиталом - это наше психологическое состояние, которое позволяет нам принимать любую сумму, которая находится за пределами нашего финансового потолка. Управление капиталом - это умение быть в нужное время, в нужном месте и с правильно подобранным "НУЖНЫМ" риском!!! Управление капиталом - это наше психологическое состояние, позволяющее принимать любые суммы, превышающие наш финансовый потолок, который попал в ограничения из-за влияния на нас окружающего нами мира, и только мы можем снять эти ограничения (не увеличивая риск, как это делают многие и теряют, а увеличивая вероятность того, что мы окажемся в нужное время, в нужном месте с "НУЖНЫМ" риском как можно чаще. Это некоторые фрагменты моего 17-летнего опыта программирования и торговли на рынке Forex.

Я предлагаю пожизненную лицензию на мой WinningSpell с моим Сканером Треугольников и моим модом бесплатного индикатора RSI всего за $50. Все мои шаблоны и настройки будут отправлены вам с кратким/простым объяснением, как использовать их в полной мере. Связаться со мной можно по MQL5 чату.


Comentários 4
Stanislav Melnikov
904
Stanislav Melnikov 2026.01.24 02:06 

Работает хорошо!))

Jade Lee Valentine
203
Jade Lee Valentine 2025.10.01 11:10 

Great indicator

Francis Santos
302
Francis Santos 2025.09.11 15:37 

Bom dindicador e suporte!

Produtos recomendados
(Currently 30% OFF) Before reading the description of this indicator, I just want to introduce to you following concept Moving Average Line - Typical moving average which is based on one chart alone.  Currency Strength Line - The moving average of a certain pair in which the strength is based on 28 pairs. Can be said as the real moving average line. Moving Average indeed is one of the most popular indicator which almost every trader use. Currency Strength Meter is also a trend indicator which

We present you the indicator "Candle closing counter", which will become your indispensable assistant in the world of trading. That’s why knowing when the candle will close can help: If you like to trade using candle patterns, you will know when the candle will be closed. This indicator will allow you to check if a known pattern has formed and if there is a possibility of trading. The indicator will help you to prepare for market opening and market closure. You can set a timer to create a pre
EZZ Zig Zag MT4
Paulo Rocha
5 (1)
EZZ Elite Zig Zag is an indicator for the MetaTrader 4 terminal. This indicator traces the peak of the trend based on the market reversal, thus showing various opportunities in the financial market. EZZ Elite Zig Zag is a visual tool, intuitive, and easy to understand and use.  Test it Yourself by Downloading it for Free. Author Paulo Rocha all rights reserved
Forex Gump
Andrey Kozak
2.4 (5)
Forex Gump is a fully finished semi-automatic trading system. In the form of arrows, signals are displayed on the screen for opening and closing deals. All you need is to follow the instructions of the indicator. When the indicator shows a blue arrow, you need to open a buy order. When the indicator shows a red arrow, you need to open a sell order. Close orders when the indicator draws a yellow cross. In order to get the most effective result, we recommend using the timeframes H1, H4, D1. There
Money Flow Profile MT5 HERE   Here   our more valuable tools SMC Trend Trading   ,  Easy SMC Trading  ,  Institutional SMC Architect Volume Analysis Tools  ,  Volume flow Profile  ,  Market volume profile  , FVG with Volume  , Liquidity Heatmap Profile  ,  Volume Spread Analysis This Master Edition is engineered for clarity and speed, featuring a unique Auto-Theme Sync system that instantly beautifies your chart layout upon loading. Key Features: True Money Flow Calculation: Goes beyond stand
Fibonacci recontratar e extensão linha de desenho ferramenta Fibonacci recontratar e estender a ferramenta de desenho de linha para a plataforma MT4 é adequado para comerciantes que usam método de negociação de pontos e negociação de secções douradas Vantagens: Não há linha extra, não há linhagem muito longa, e é fácil observar e encontrar oportunidades de negociação Versão experimental: https://www.mql5.com/zh/market/product/35884 Principais funções: 1. Podem ser desenhados diretamente vári
Nosso indicador Basic Support and Resistance é a solução necessária para aumentar sua análise técnica.Este indicador permite que você forneça níveis de suporte e resistência no gráfico/ MT5 grátis Recursos Integração dos níveis de Fibonacci: Com a opção de exibir níveis de Fibonacci, juntamente com os níveis de suporte e resistência, nosso indicador fornece uma visão ainda mais profunda do comportamento do mercado e possíveis áreas de reversão. Otimização de desempenho: Com a opção de atualiz
## Smart Reversal Oscillator Pro Smart Reversal Oscillator Pro is an advanced hybrid trading utility designed for MetaTrader 4 that reinvents volatility and momentum analysis. Instead of analyzing raw price action, this indicator applies mathematical Bollinger Bands directly onto the Relative Strength Index (RSI) array data within a separate sub-window. Standard fixed oversold and overbought levels (like 30 and 70) often fail during strong market expansions. This professional oscillator solve
Noize Absorption Index MT4
Ekaterina Saltykova
5 (1)
Noize Absorption Index - is the manual trading system that measures the difference of pressure between bears forces and bulls forces. Green line - is a noize free index that showing curent situation. Zero value of index shows totally choppy/flat market.Values above zero level shows how powerfull bullish wave is and values below zero measures bearish forces.Up arrow appears on bearish market when it's ready to reverse, dn arrow appears on weak bullish market, as a result of reverse expectation. S
Volume Profile Sniper v11. 1 - ferramenta abrangente de análise de mercado Abordagem profissional ao comércio O Volume Profile Sniper v11.1 combina mais de 15 filtros-chave em um único indicador, fornecendo sinais claros com base em uma avaliação abrangente da situação do mercado. Principais recursos Análise do desequilíbrio volumétrico-o algoritmo calcula a proporção de compradores e vendedores em cada vela, sinalizando a predominância de uma das partes (limite ajustável de 50% a 90%). Filtr
URGENCY “Limited launch pricing” “Price increases after version 2.0” Currencies Gold Momentum Flow Dashboard  — See Market Strength Instantly A powerful all-in-one dashboard that shows real-time momentum across multiple timeframes (M5–D1) for forex and gold. Multi-timeframe ROC analysis Built-in trade signals (alignment & momentum shifts) Currency strength meter Heatmap for instant trend recognition Alerts + one-click pair switching Stop switching charts — see the entire market in
Daily Candle Predictor é um indicador que prevê o preço de fechamento de uma vela. O indicador destina-se principalmente ao uso em gráficos D1. Este indicador é adequado tanto para negociação forex tradicional quanto para negociação de opções binárias. O indicador pode ser usado como um sistema de negociação autônomo ou pode atuar como um complemento ao seu sistema de negociação existente. Este indicador analisa a vela atual, calculando certos fatores de força dentro do próprio corpo da vela, be
Phase Analytics Pro: Advanced Cyclic Market Analyzer Phase Analytics Pro is a sophisticated technical tool designed for traders who prioritize mathematical precision over lag-heavy traditional indicators. Based on the principles of digital signal processing, this indicator decomposes price action into phase and quadrature components to identify the dominant market cycle. How it works: The algorithm calculates the instantaneous phase of the market, allowing it to distinguish between trending and
HMA Trend Professional MT4
Pavel Zamoshnikov
4.57 (7)
Improved version of the free HMA Trend indicator (for MetaTrader 4) with statistical analysis. HMA Trend is a trend indicator based on the Hull Moving Average (HMA) with two periods. HMA with a slow period identifies the trend, while HMA with a fast period determines the short-term movements and signals in the trend direction. The main differences from the free version: Ability to predict the probability of a trend reversal using analysis of history data. Plotting statistical charts for analyzi
The Th3Eng PipFinite indicator is based on a very excellent analysis of the right trend direction with perfect custom algorithms. It show the true direction and the best point to start trading. With StopLoss point and Three Take Profit points. Also it show the right pivot of the price and small points to order to replace the dynamic support and resistance channel, Which surrounds the price. And Finally it draws a very helpful Box on the left side on the chart includes (take profits and Stop loss
Advance Currency Meter is a currency meter that detects strong market trends. This indicator is good for scalping, intraday trading and swing trading. The indicator will detect short term to long term market trends. This will give you good insight which currencies are best to trade as of the moment. Note : Kindly contact me before you make any purchases. This won't work on your account without my permission. Note :   Works well with my MACD Currency Strength Meter
TWO PAIRS SQUARE HEDGE METER INDICATOR Try this brilliant 2 pairs square indicator It draws a square wave of the relation between your two inputs symbols when square wave indicates -1 then it is very great opportunity to SELL pair1 and BUY Pair2 when square wave indicates +1 then it is very great opportunity to BUY pair1 and SELL Pair2 the inputs are : 2 pairs of symbols         then index value : i use 20 for M30 charts ( you can try other values : 40/50 for M15 , : 30 for M30 , : 10 for H1 ,
Blahtech Market Profile
Blahtech Limited
4.53 (15)
Was: $249  Now: $99   Market Profile defines a number of day types that can help the trader to determine market behaviour. A key feature is the Value Area, representing the range of price action where 70% of trading took place. Understanding the Value Area can give traders valuable insight into market direction and establish the higher odds trade. It is an excellent addition to any system you may be using. Blahtech Limited presents their Market Profile indicator for the MetaTrader community. Ins
Cosmic Diviner X Planet
Olena Kondratenko
4 (2)
This unique multi-currency strategy simultaneously determines the strength of trends and market entry points, visualizing this using histograms on the chart. The indicator is optimally adapted for trading on the timeframes М5, М15, М30, Н1. For the convenience of users, the indicator renders the entry point (in the form of an arrow), recommended take profit levels (TP1, TP2 with text labels) and the recommended Stop Loss level. The take profit levels (TP1, TP2) are automatically calculated for
Trend Scan Friend
Israr Hussain Shah
Here   our more valuable tools SMC Trend Trading   ,  Easy SMC Trading  ,  Institutional SMC Architect Volume Analysis Tools  ,  Volume flow Profile  ,  Market volume profile  , FVG with Volume  , Liquidity Heatmap Profile  ,  Volume Spread Analysis Trend Identification: Look for the color change. When candles turn Green , look for Buy opportunities. When they turn Red , look for Sell opportunities. Entry: Enter on the break of the trend line or on the pullback to the line. Stop Loss: Use the
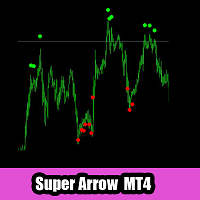
The Super Arrow Indicator provides non-repainting buy and sell signals with exceptional accuracy. Key Features No repainting – confirmed signals remain fixed Clear visual arrows: green for buy, red for sell Real-time alerts via pop-up, sound, and optional email Clean chart view with no unnecessary clutter Works on all markets: Forex, gold, oil, indices, crypto Adjustable Parameters TimeFrame Default: "current time frame" Function: Sets the time frame for indicator calculation Options: Can be set
Matrixs
Andriy Sydoruk
Matrix is a Forex arrow indicator. Displays signals simply and clearly! The arrows show the direction of the transaction, and are colored accordingly, which can be seen in the screenshots. As you can see, trading with such an indicator is easy. I waited for an arrow to appear in the desired direction - I opened a deal. An arrow formed in the opposite direction - closed the deal. The indicator also displays the lines with the help of which the arrow signals are formed, taking into account the int
The principle of this indicator is very simple: detecting the trend with Moving Average, then monitoring the return point of graph by using the crossing of Stochastic Oscillator and finally predicting BUY and SELL signal with arrows, alerts and notifications. The parameters are fixed and automatically calculated on each time frame. Example: If you install indicator on EURUSD, timeframe M5: the indicator will detect the main trend with the Moving Average on this timeframe (for example the Moving
Infinity Trend Pro
Yaroslav Varankin
1 (1)
This is a trend indicator without redrawing Developed instead of the binary options strategy (by the color of the Martingale candlestick) Also works well in forex trading When to open trades (binary options) A signal will appear in the place with a candle signaling the current candle It is recommended to open a deal for one candle of the current timeframe M1 and M5 When a blue dot appears, open a deal up When a red dot appears, open a trade down. How to open trades on Forex. When a signal is rec
FX FVG iFVG Signal MT4 é um indicador para MetaTrader 4 desenvolvido para traders de Forex que utilizam os conceitos de Fair Value Gap e Inversion Fair Value Gap. O indicador marca automaticamente zonas FVG de alta, FVG de baixa, iFVG de alta e iFVG de baixa no gráfico. Quando o preço retorna a uma zona iFVG e há confirmação por candle, o indicador mostra um alerta BUY ou SELL. O uso recomendado é nos períodos H1 e M30. O H1 pode ser usado para direção principal, e o M30 para observar pullbacks,
Supreme Commander
Ramon Sobrevals Arce
4.13 (8)
The indicator of the indicators. The Most Powerful Technique to Determine Forex Trend Strength in 2023. We have perfected Supreme Commander that it calculates an average of the selected indicators (up to 16) and the selected timeframe (all) with the result of a single trend that indicates the potential of buying and selling.  It includes the following indicators: Accelerator/Decelerator oscillator Average Directional Movement Index Awesome oscillator; Bulls and Bears  Commodity Channel Index; De
Delta Pairs
Anatolii Zainchkovskii
Delta Pairs is an indicator for pair trading, it displays the divergence of two currency pairs. Does not redraw. A useful tool for the analysis of the behavior of two currency pairs relative to each other. Purpose The Delta Pairs indicator is designed for determining the divergences in the movements of two currency pairs. This indicator is displayed as two line charts and the difference (delta) between these charts in the form of a histogram. The Delta Pairs indicator will be useful for those w
PipFinite Energy Beam
Karlo Wilson Vendiola
3.94 (17)
Pipfinite creates unique, high quality and affordable trading tools. Our tools may or may not work for you, so we strongly suggest to try the Demo Version for MT4 first. Please test the indicator prior to purchasing to determine if it works for you. We want your good reviews, so hurry up and test it for free...we hope you will find it useful. Combo Energy Beam with Swing Control Strategy: Confirm swing pullback signals Watch Video: (Click Here) Energy Beam with Trend Laser Strategy: Confirm Tre
This may just look like another indicator for identifying and displaying supply and demand, but dig-in further and you will discover it has much more to offer. In addition to the complete flexibility for displaying zones, consider the identification of recent support or resistance, the back-testing capability to help you learn how to identify the best supply and demand zones to trader from, the continuously updated trend information for all time frames, times from around the world displayed on
Heiken Ashi candle chart is an improved version of The Japanese candle chart, which can effectively filter the market "noise" of the Japanese candle chart. It is favored by many traders for its simplicity and intuition. For trend traders, the HA candle chart is a magic tool. Unlike the traditional Japanese candle chart, Heikenashi does not reflect the opening price, high price, low price and closing price of the market. Instead, Heikenashi calculates the value of a single K line in the dominant
Os compradores deste produto também adquirem
Trend SniperX MT4
Sarvarbek Abduvoxobov
5 (5)
Trend Sniper X é um indicador de tendência multitemporal para MetaTrader 5 que ajuda os traders a identificar a direção da tendência e potenciais pontos de reversão com clareza e precisão. Para MT5: https://www.mql5.com/en/market/product/181101 Informação de preço: O preço atual é promocional e está sujeito a alterações à medida que novas atualizações e recursos forem lançados. Canal Code2Profit Domine o Mercado com Análise Multitemporal! Como Maximizar sua Taxa de Acerto com o Trend Sniper X: R
SR Liquidity
Oleg Rodin
5 (2)
O SR Liquidity é um indicador de trading projetado para revelar as zonas ocultas onde a liquidez do mercado se concentra e o preço reage com maior intensidade. Essas áreas específicas de liquidez funcionam como níveis poderosos de suporte e resistência, oferecendo um mapa claro de onde é mais provável que o mercado reverta. Em vez de traçar linhas comuns de Suporte e Resistência, o SR Liquidity analisa o comportamento real dos preços para detectar as zonas onde se acumulam pressões de compra e v
Atomic Analyst
Issam Kassas
5 (14)
Atomic Analyst — MetaTrader 4 Para dúvidas sobre o produto, orientação de configuração ou suporte técnico, envie-me uma mensagem diretamente aqui no MQL5. O indicador transforma cálculos complexos do mercado em sinais visuais simples, candles coloridos, leituras de tendência, níveis de stop loss e várias zonas de take profit que os traders podem entender rapidamente e usar em condições reais de mercado. Principais usos de trading: Scalping e day trade: Desenvolvido para tomada de decisão rápida
Smart Trend Trading System é um indicador para MetaTrader 4 que reúne informações de tendência, sinais de entrada e saída e níveis de preço em um único gráfico. Ele combina mais de 10 ferramentas de trading em um único sistema, incluindo detecção de tendência, zonas de reversão, Smart Cloud, lógica de trailing stop, suporte e resistência, coloração de candles, alertas e análise multi-timeframe. O sistema foi desenvolvido para ajudar você a operar diferentes condições de mercado: Mercados em tend
Neuro Poseidon MT4
Daria Rezueva
4.74 (46)
Neuro Poseidon is a new indicator by Daria Rezueva. It combines precise trading signals with adaptive TP/SL levels - creating best possible trades as a result! Message me and get  Neuro Poseidon Assistant  as a gift to automize your trading process! What makes it stand out? 1. Proven profitability on all assets and timeframes 2. Only confirmed BUY and SELL signals present on the chart 3. Adaptive TP & SL levels generated by the software for each trade 4. Easy to understand - suitable for all
Sinal de tendência GoldRush Arrow O indicador Sinal de tendência GoldRush Arrow fornece uma análise precisa e em tempo real das tendências, adaptada para scalpers de alta velocidade e curto prazo em XAU/USD. Criada especificamente para o intervalo de tempo de 1 minuto, esta ferramenta exibe setas direcionais para pontos de entrada claros, permitindo que os scalpers naveguem em condições de mercado voláteis com confiança. O indicador consiste em setas de alerta PRIMÁRIAS e SECUNDÁRIAS. Os sin
Break and Retest Hunter MT4 is a powerful MetaTrader 5 indicator designed to automatically identify support and resistance levels, breakout structures, and potential retest opportunities in real time. Bonus Indicator: After purchasing Break and Retest Hunter , contact me to receive Trade Indicator Assistant EA completely free as a bonus utility. $65 for the next 10 copies . Next price is $120.  Combining adaptive market analysis, clear BUY/SELL signals, Fibonacci-based profit targets, and a pre
Miraculous Indicator Binary & Forex v3 StrategySafe Miraculous Indicator Binary & Forex v3 StrategySafe é um indicador profissional criado para traders que desejam sinais claros, confirmações avançadas e uma forma estruturada de operar nos mercados Binary e Forex. A versão v3 traz MIR Dashboard, Miraculous Confirmation Dashboard, GANN Law, níveis Square of 9, ângulos GANN e um modo Forex mais completo para analisar o mercado com mais precisão. Principais recursos Modo Binary e modo Forex em um ú
AW Prime Oscillator
AW Trading Software Limited
5 (1)
Uma combinação de dois osciladores. O primeiro exibe os pontos de entrada, o segundo mostra a tendência atual. O indicador pode exibir sinais do oscilador por meio de setas em dois modos, todos os sinais do oscilador rápido ou sinais apenas na direção da tendência atual. Possui painel multi-timeframe e três tipos de notificações de sinal. Benefícios: Adequado para negociação diurna e de scalping Filtragem de tendências Configuração simples e sensível Painel multiperíodo Adequado para integração
O sistema PRO Renko é um sistema de negociação altamente preciso especialmente concebido para a negociação de gráficos RENKO. Trata-se de um sistema universal que pode ser aplicado a vários instrumentos de negociação. O sistema neutraliza eficazmente o chamado ruído de mercado, dando-lhe acesso a sinais de inversão precisos. O indicador é muito fácil de usar e tem apenas um parâmetro responsável pela geração de sinal. Você pode facilmente adaptar a ferramenta a qualquer instrumento de negocia
Currency Strength Wizard é um indicador muito poderoso que fornece uma solução completa para uma negociação bem-sucedida. O indicador calcula o poder deste ou daquele par forex usando os dados de todas as moedas em vários intervalos de tempo. Esses dados são representados em uma forma de índice de moeda fácil de usar e linhas de energia de moeda que você pode usar para ver o poder desta ou daquela moeda. Tudo o que você precisa é anexar o indicador ao gráfico que deseja negociar e o indicador mo
Elliott Wave Trend was designed for the scientific wave counting. This tool focuses to get rid of the vagueness of the classic Elliott Wave Counting using the guideline from the template and pattern approach. In doing so, firstly Elliott Wave Trend offers the template for your wave counting. Secondly, it offers Wave Structural Score to assist to identify accurate wave formation. It offers both impulse wave Structural Score and corrective wave Structure Score. Structural Score is the rating to sh
Gann Made Easy
Oleg Rodin
4.84 (172)
Gann Made Easy é um sistema de negociação Forex profissional e fácil de usar, baseado nos melhores princípios de negociação usando a teoria do sr. W. D. Gann. O indicador fornece sinais precisos de COMPRA e VENDA, incluindo níveis de Stop Loss e Take Profit. Você pode negociar mesmo em movimento usando notificações PUSH. Entre em contato comigo após a compra para receber instruções de negociação e ótimos indicadores extras gratuitamente! Provavelmente você já ouviu muitas vezes sobre os métodos
Liquidity Scalper System: um sistema de trading baseado em liquidez no formato de indicador. A maioria dos indicadores mostra apenas uma seta, e depois o trader decide sozinho onde colocar o stop, onde está o alvo e se pode confiar no sinal. O Liquidity Scalper System cobre todo o ciclo da operação: encontra pools de liquidez, dá um sinal no seu rompimento, calcula imediatamente Entry, Stop Loss e três alvos, e mostra no painel as estatísticas e os resultados da validação em dados novos. O sist
Trend Catcher ind
Ramil Minniakhmetov
5 (11)
INDICADOR TREND CATCHER O Indicador Trend Catcher analisa os movimentos de preços do mercado, utilizando uma combinação de indicadores de análise de tendências adaptativos, proprietários e personalizados pelo autor. Identifica a verdadeira direção do mercado, filtrando o ruído de curto prazo e focando a força do momentum subjacente, a expansão da volatilidade e o comportamento da estrutura de preços. Utiliza também uma combinação de indicadores personalizados de suavização e filtragem de tendê
M1 Sniper
Oleg Rodin
4.97 (30)
O M1 SNIPER é um sistema indicador de negociação fácil de usar. É um indicador de seta projetado para o período M1. O indicador pode ser usado como um sistema independente para scalping no período M1 e pode ser usado como parte do seu sistema de negociação existente. Embora este sistema de negociação tenha sido projetado especificamente para negociação no M1, ele também pode ser usado em outros períodos. Originalmente, desenvolvi este método para negociar XAUUSD e BTCUSD. Mas considero-o útil ta
ACTUALMENTE COM 40% DE DESCONTO A melhor solução para qualquer novato ou comerciante especializado! Este Indicador é uma ferramenta comercial única, de alta qualidade e acessível, porque incorporámos uma série de características proprietárias e uma nova fórmula. Com apenas UM gráfico, pode ler a força da moeda para 28 pares de Forex! Imagine como a sua negociação irá melhorar porque é capaz de apontar o ponto exacto do gatilho de uma nova tendência ou oportunidade de escalada? Manual do util
Fibonacci Trend Marker   — is a trend indicator that analyzes the behavior of the current candle relative to the High-Low (HL) range of previous candles using Fibonacci retracement levels. It visually tracks trend strength, signaling potential weakening or reversal through a change in candle color. Features: Designed for trend-focused traders, it helps quickly identify trend changes based on Fibonacci levels. Effective on any timeframe with sufficient market volatility, when a sequence of 3–5 c
Supply and Demand Dashboard PRO
Bernhard Schweigert
4.81 (21)
Actualmente 30% OFF ! Este painel é uma peça de software muito poderosa que trabalha em múltiplos símbolos e até 9 prazos. Baseia-se no nosso principal indicador (Melhores críticas: Advanced Supply Demand ).   O tablier dá uma óptima visão geral. Mostra:   Valores filtrados da Oferta e da Procura, incluindo a classificação da força da zona, Distâncias de/para as zonas e dentro das zonas, Destaca as zonas aninhadas, Dá 4 tipos de alertas para os símbolos escolhidos em todos os (9) períodos de
Currency Pulse — painel de força das moedas para MetaTrader 4 Para que serve O Currency Pulse mostra, num único painel compacto no gráfico, quais moedas estão fortes e quais estão fracas neste momento, em vários tempos gráficos ao mesmo tempo. Com base nesse ranking, o indicador aponta os pares com a maior divergência entre moedas: comprar a forte e vender a fraca. O indicador não depende do símbolo do gráfico em que é colocado. MT5 -version:  https://www.mql5.com/en/market/product/200977 Como
M1 Arrow
Oleg Rodin
4.81 (21)
O M1 Arrow é um indicador baseado nos princípios naturais de negociação do mercado, incluindo análise de volatilidade e volume. O indicador pode ser usado em qualquer período gráfico e par de moedas. Um parâmetro fácil de usar permite adaptar os sinais a qualquer par de moedas e período gráfico que você desejar operar. Além do algoritmo principal, baseado em sinais de compra e venda, o indicador também possui diversas estratégias extras integradas que podem ser selecionadas nos parâmetros de ent
Este indicador reconhece mais de 30 padrões de candlestick japoneses e os destaca maravilhosamente no gráfico. É simplesmente um daqueles indicadores que os operadores de ação de preços não podem viver sem. Melhore sua análise técnica da noite para o dia Detectar padrões de velas japonesas facilmente Negocie padrões de reversão confiáveis e universais Entre nas tendências estabelecidas com segurança usando padrões de continuação O indicador não repinta e implementa alertas O indicador implement
DayTrader PRO MT4
Davit Beridze
4.6 (10)
DayTrader PRO MT5:  https://www.mql5.com/en/market/product/186222 O DayTrader PRO é um indicador de trading avançado que combina o Filtro de Laguerre de John Ehlers com um potente motor de otimização automática. Em vez de utilizar parâmetros fixos, o indicador procura automaticamente as melhores definições com base nas condições recentes do mercado, ajudando-o a adaptar-se à volatilidade variável sem necessidade de ajustes manuais constantes. O indicador gera sinais claros de COMPRA (BUY) e VEND
Quantum Trend Sniper MT4
Ian Andrew Nicholson
5 (1)
Quantum Trend Sniper PRO for MetaTrader 4 Quantum Trend Sniper PRO is a professional-grade MT4 indicator built for traders who want selective entries, clear trade structure, and live on-chart decision support . This is not a basic buy/sell arrow tool. It is a complete trading workflow that helps you identify higher-quality setups, project the full trade structure, monitor progression through multiple profit targets, and review trade behavior directly on the chart. Designed for traders who value
Indicator plots price cycle blocks and sends signals with smart volume confirmation. Price cycles and fractals are combined to determine the demand/supply blocks. The indicator can be used alone or combined with other Cycle Indicators Inputs: Period: Recommended value is between 35 and 55( Which are Set 1 and Set 2 periods of cycle sniper ) Engulfing: If true, you will be able to see the engulfing bar confirmation. Volume Filter: True (The  arrow comes with volume confirmation ) Videos with dif
Scalper Inside PRO
Alexey Minkov
4.74 (69)
Scalper Inside PRO helps you read the intraday trend and plan a trade before you enter the market. It is built around three exclusive strategies for a sharper read of the market. The moment a signal appears, the indicator evaluates market direction and calculates the key levels, so you see the potential entry, the expected stop-loss and several profit-taking levels in advance. Detailed performance statistics show how different instruments and strategies performed in history and help you pick ass
Gold Targets são o melhor indicador de tendência. O algoritmo exclusivo do indicador analisa o movimento do preço do ativo, levando em consideração fatores de análise técnica e matemática, determina os pontos de entrada mais rentáveis, emite um sinal em forma de seta e o nível de preço (ENTRADA DE COMPRA / Entrada de VENDA) para abra um pedido. O indicador também exibe imediatamente o nível de preço para Stop Loss e cinco níveis de preços para Take Profit. ATENÇÃO: O indicador é muito fácil de
The Extreme point indicator helps in determining the probable price reversal points on the chart. The indicator facilitates the search for points to enter the market with greater accuracy. The indicator displays certain impulses, after which there is a high probability of the price continuing its movement in the same direction. The indicator can be used in conjunction with other indicators for a more accurate detection of the position entry points. The indicator can also be used independently. F
O Top Bottom Tracker é um indicador baseado em algoritmos sofisticados que analisa a tendência do mercado e pode detetar os altos e baixos da tendência / Versão MT5 . O preço aumentará progressivamente até atingir 500$. Próximo preço --> $99 Características Sem repintura Este indicador não altera os seus valores quando chegam novos dados Pares de negociação Todos os pares de forex Timeframe   Todos os timeframes Parâmetros ==== Configuração do indicador ==== Parâmetro de configuração
Elliott Live é um indicador para MetaTrader 5 que marca automaticamente as ondas de Elliott, tanto no histórico quanto na vela atual. As ondas concluídas são desenhadas com linha contínua; a onda em formação, com linha pontilhada e um ponto de interrogação (por exemplo, "3?"), junto com os alvos de Fibonacci e o nível de invalidação. MT5-version:  https://www.mql5.com/en/market/product/200604 Como funciona Primeiro o indicador constrói os swings (ZigZag). Uma reversão é registrada quando o preç
Filtro:
Stanislav Melnikov
904
Stanislav Melnikov 2026.01.24 02:06 

Работает хорошо!))

Jade Lee Valentine
203
Jade Lee Valentine 2025.10.01 11:10 

Great indicator

Francis Santos
302
Francis Santos 2025.09.11 15:37 

Bom dindicador e suporte!

XANKEEZ
889
XANKEEZ 2025.07.21 02:49 

Buy and Sell Volume Spikes Indicator – Great Tool!

I'm really happy with this indicator!

It makes it so much easier to spot strong buying and selling pressure, and it’s helped me find better entry and exit points.

The volume "spikes" are super clear and easy to read on the chart, so I feel more confident in my trading decisions.

One useful tip I got from Andrei—the author—was to check higher time frames for confirmation.

This approach really helps boost the win rate and makes spotting important volume moves even simpler.

What I like most:

-Clear and simple visual signals

-Easy to set up and use

-Quick and helpful customer service

The author's support is excellent—my questions were answered quickly and in a friendly way.

It’s good to know there’s reliable help available if you need it.

So far, this indicator has proved to be among the most practical tools I’ve purchased from the MQL5.

Responder ao comentário