MP Trend Scanner for MT4
- Indicadores
- Versão: 1.0

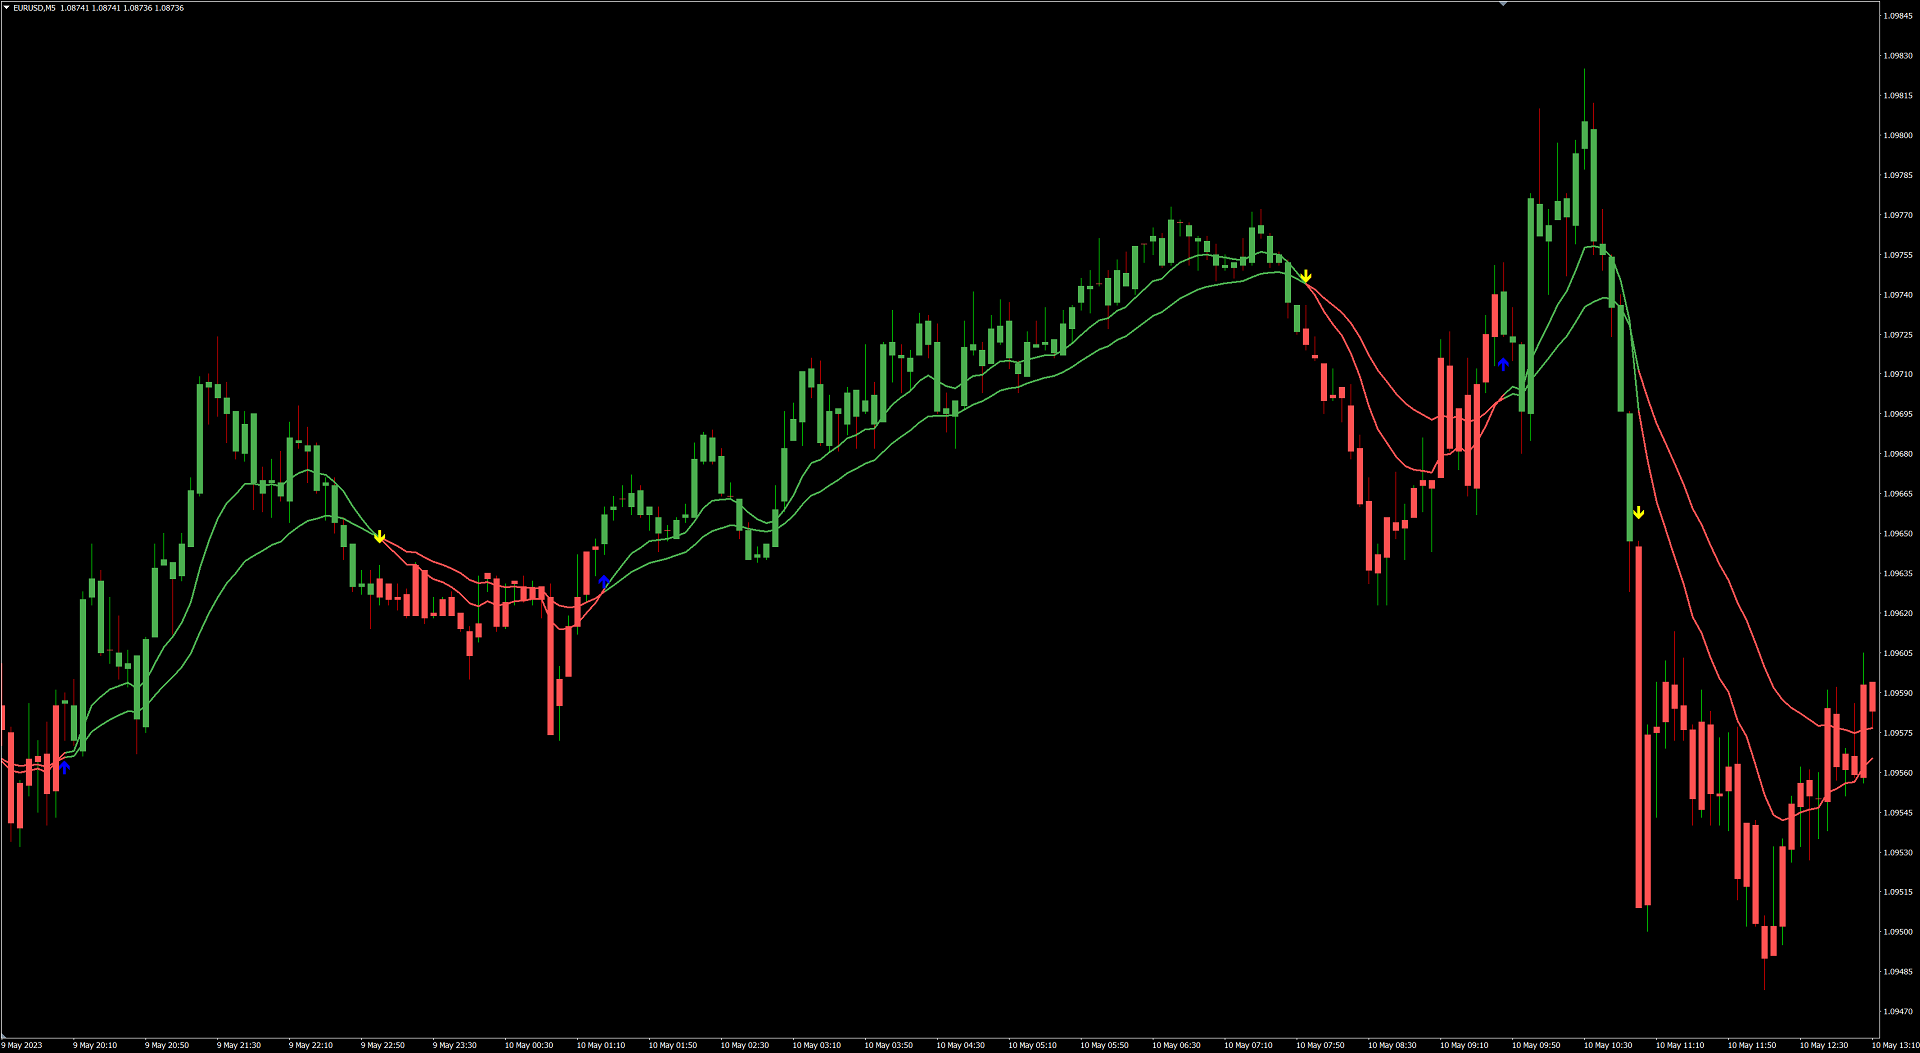
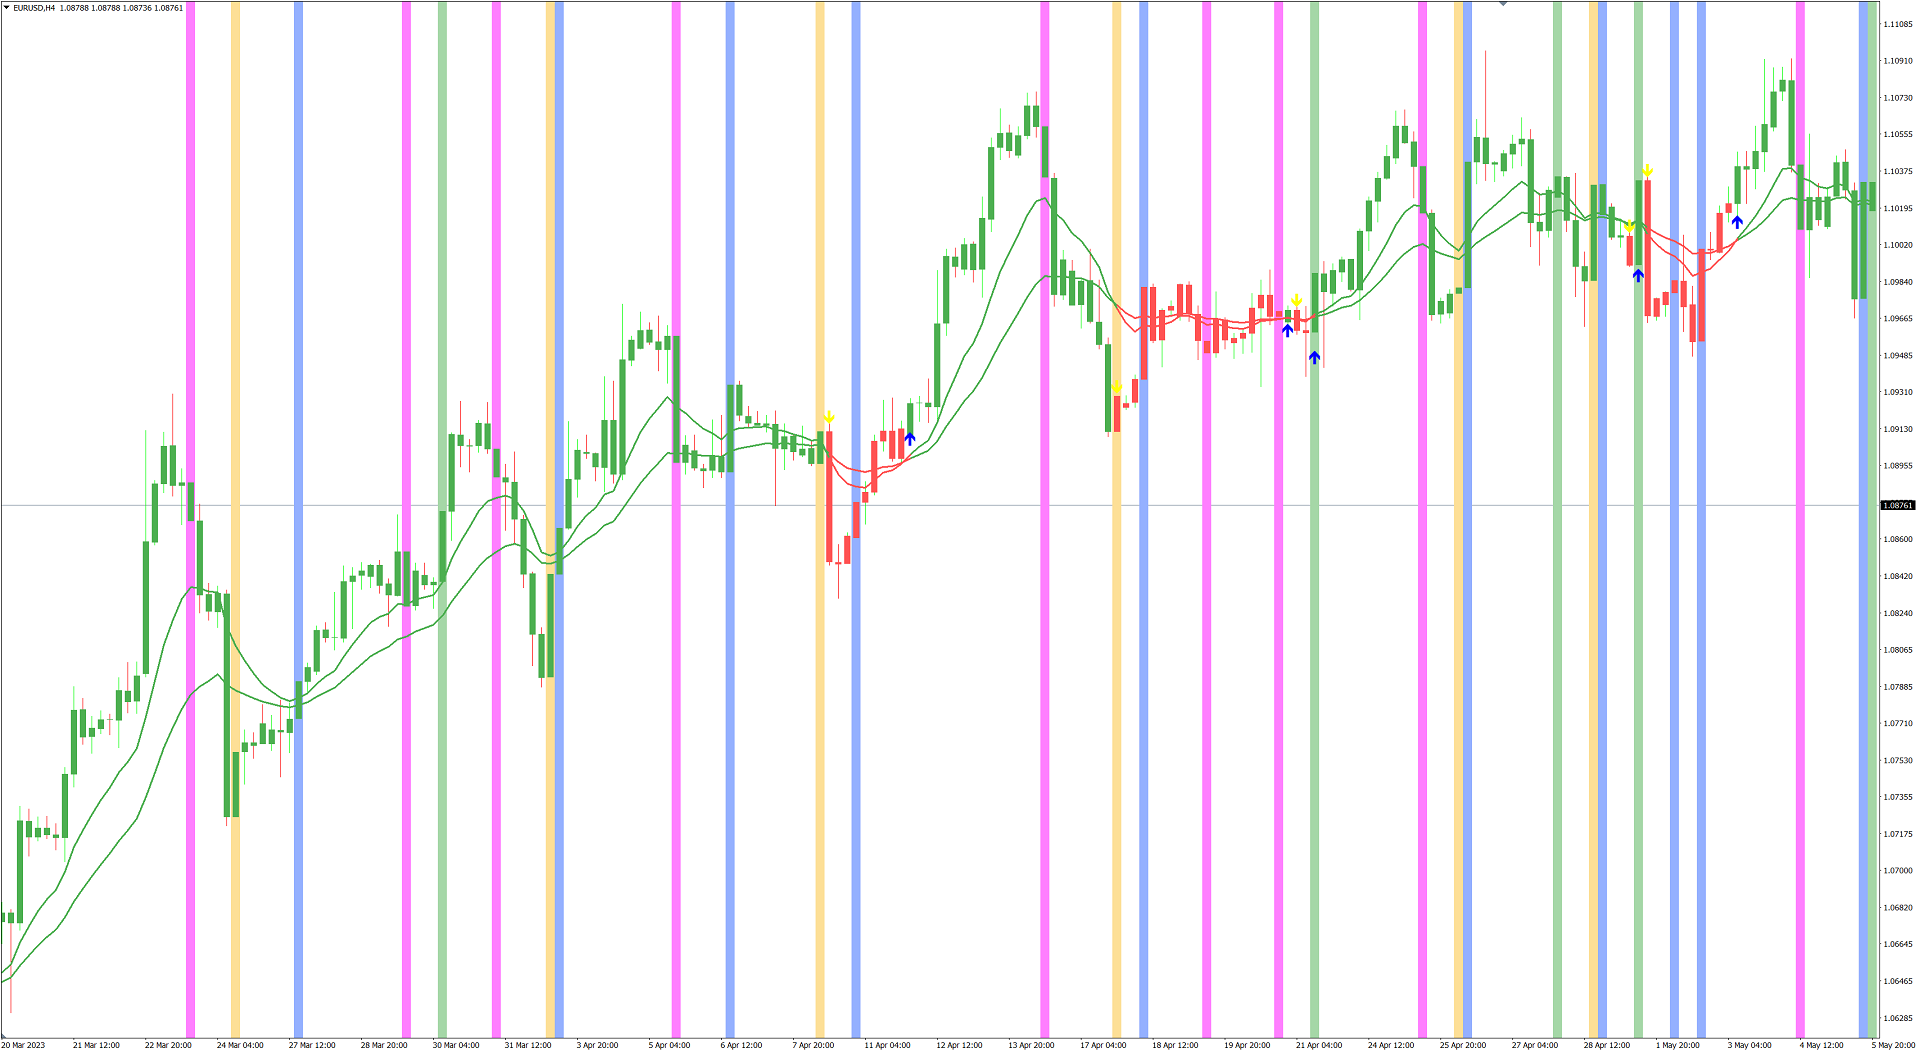
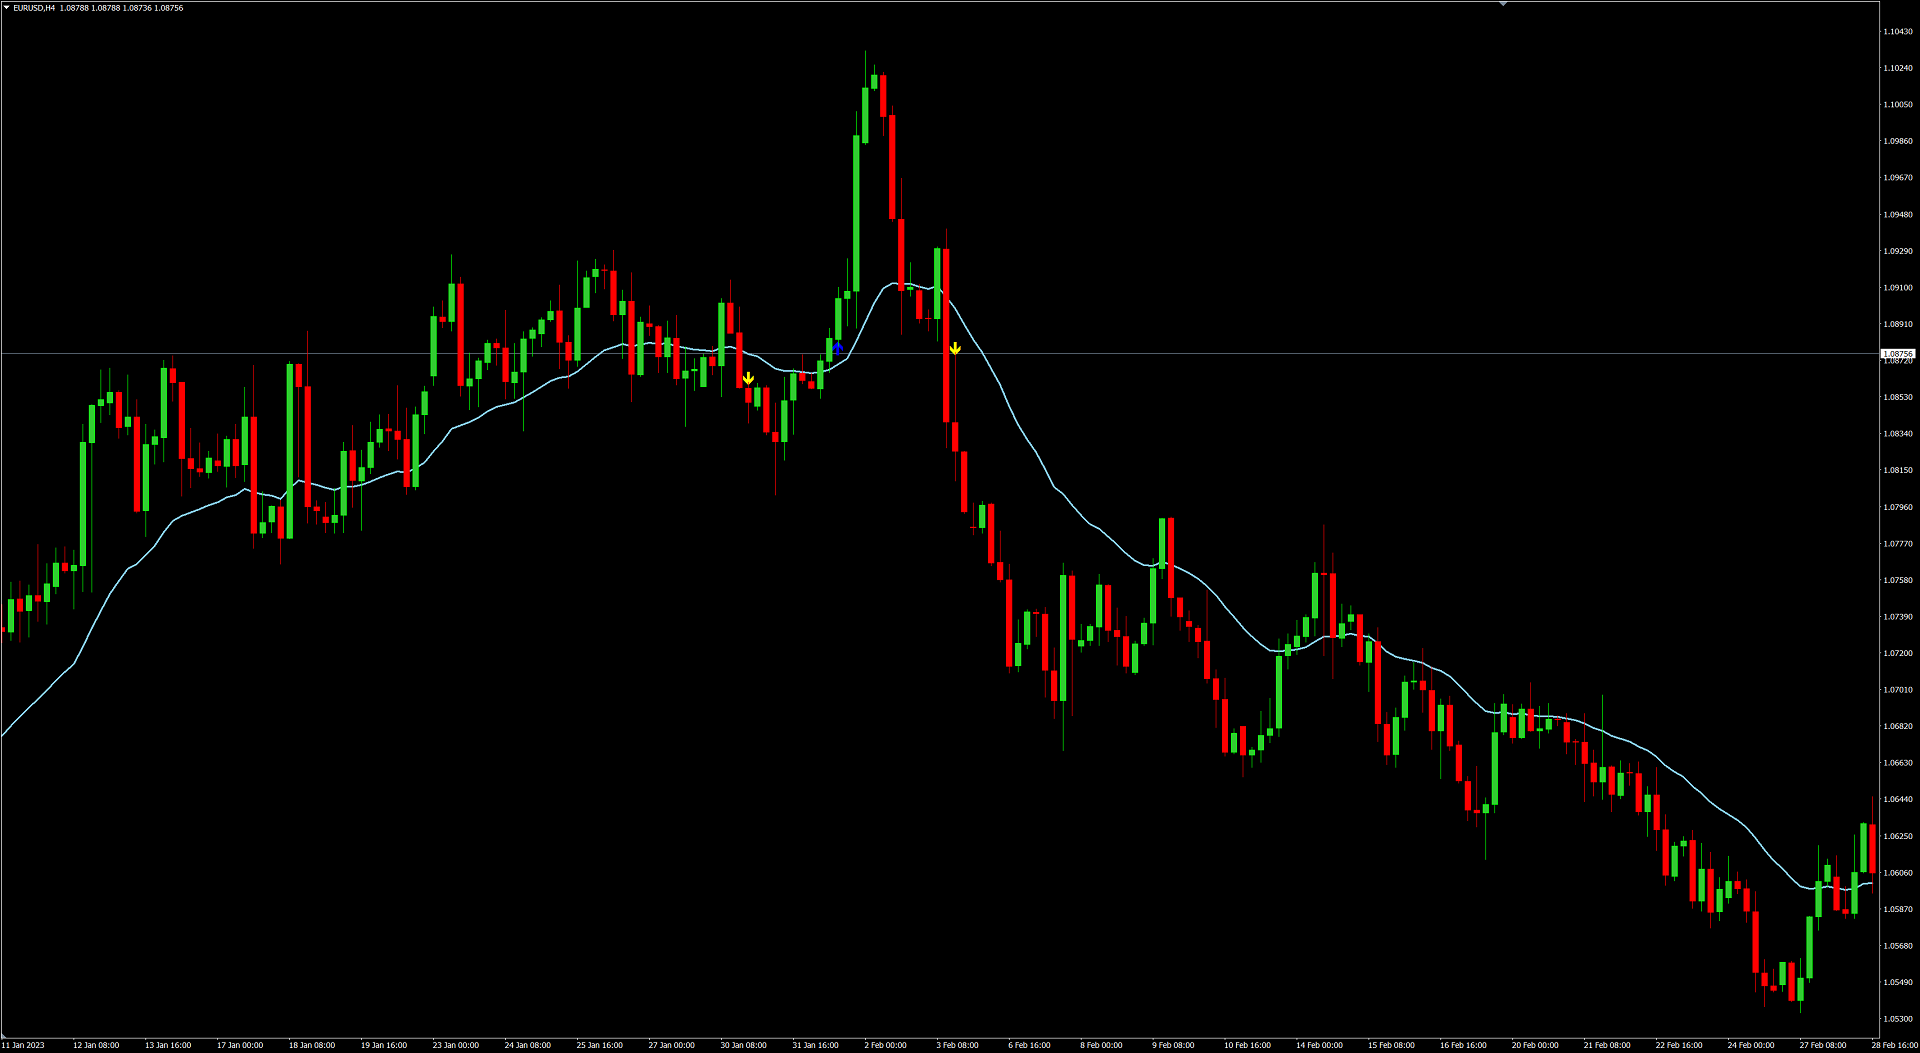
This trend scanner indicator is using two main indicators to identify trends. Frist the EMAs to provide a view on Bullish / Bearish momentum. When the shorter EMA (calculated off more recent price action) crosses, or is above, the slower moving EMA (calculated off a longer period of price action), it suggests that the market is in an uptrend. Second the Stochastic RSI, When RSI is < 20 it is considered oversold, and when > 80 it is overbought. These conditions suggests that momentum is very strong in the direction of the trend.
Usage:
The EMAs indicate when trend shifts (bullish or bearish).
The RSI indicates when the trend is losing momentum.
The combination of the two can be used to suggest when to prefer a directional bias, and subsequently shift in anticipation of a trend reversal. Higher timeframes can provide better setups.
Settings:
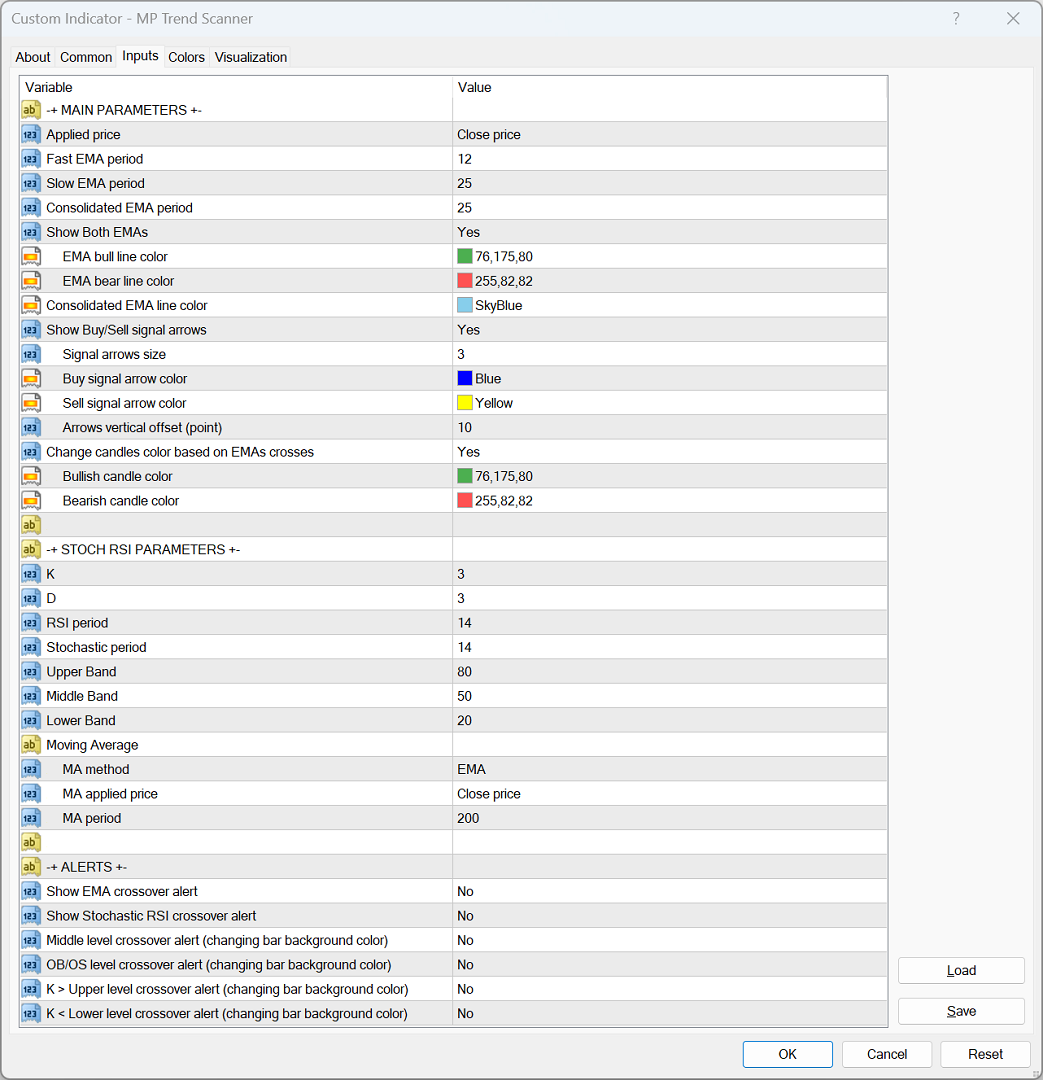
-+ MAIN PARAMETERS +-
- Applied price
- Fast EMA period
- Slow EMA period
- Consolidated EMA period
- Show Both EMAs
- EMA bull line color
- EMA bear line color
- Consolidated EMA line color
- Show Buy/Sell signal arrows
- Signal arrows size
- Buy signal arrow color
- Sell signal arrow color
- Arrows vertical offset (point)
- Change candles color based on EMAs crosses
- Bullish candle color
- Bearish candle color
- K
- D
- RSI period
- Stochastic period
- Upper Band
- Middle Band
- Lower Band
- Moving Average
- MA method
- MA applied price
- MA period
- Show EMA crossover alert
- Show Stochastic RSI crossover alert
- Middle level crossover alert (changing bar background color)
- OB/OS level crossover alert (changing bar background color)
- K > Upper level crossover alert (changing bar background color)
- K < Lower level crossover alert (changing bar background color)
#Tags: Trend Scanner, Trend Finder, Trend Detector, Buy Signal, Sell Signal, EMA, EMA Crossover, RSI, Stochastic RSI, Bullish Momentum, Bearish Momentum, Oversold, Overbought
___________________________________________________________________________________
Disclaimer:
Do NOT trade or invest based upon the analysis presented on this channel. Always do your own research and due diligence before investing or trading. I’ll never tell you what to do with your capital, trades or investments. I’ll also never recommend for you to buy, sell, long or short any asset, commodity, security, derivative or cryptocurrency related instrument as it's extremely HIGH RISK! You should always consult with a professional/licensed financial adviser before trading or investing in any type of assets.

此指标只能在趋势中使用切记横盘勿用。非常感谢