Bayesian predictive leading indicator

This is a predictive indicator (leading indicator) that uses Bayes' formula to calculate the conditional probability of price increases given the angular coefficient. The indicator calculates the angular coefficient and its regression and uses it to predict prices.
Bayes' theorem is a fundamental result of probability theory and is used to calculate the probability of a cause causing the verified event. In other words, for our indicator, Bayes' theorem is used to calculate the conditional probability of one event (price event in this case) with respect to another event by calculating the probabilities of the two events (past price) and the conditional probability of the second event (future price) with respect to the first event.
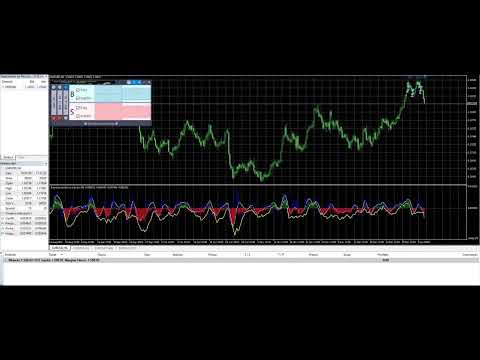
The red line represents the angular coefficient. The blue line represents the normalized expected price. Finally, the yellow line represents the conditional probability that the price will increase or decrease.
How to use it. In addition to the convenient histogram, which follows the angular coefficient, another practical operational application might be to go long when the blue line is above the red and yellow lines. Conversely short when the blue is below the red and yellow.
When the yellow line passes above all others, a reversal in the long direction is imminent and vice versa.
The extent of the reversal depends on how far the yellow line will be away in price from the other 2 lines.
Video Bayesian predictive leading indicator
추천 제품
Advanced Volume Profile Analysis Tool for MetaTrader 5 The Kecia Volume Profile Order Finder provides traders with volume profile analysis capabilities. This MT5 indicator combines volume profile visualization with statistical calculations to help identify potential trading opportunities and suggests entry, stop loss, and take profit levels based on market structure. Market Profile Visualization Transform your chart with customizable volume profile visualizations: Multiple visualization options
Blahtech Market Profile MT5
Blahtech Limited
5 (10)
Was: $249  Now: $99   Market Profile defines a number of day types that can help the trader to determine market behaviour. A key feature is the Value Area, representing the range of price action where 70% of trading took place. Understanding the Value Area can give traders valuable insight into market direction and establish the higher odds trade. It is an excellent addition to any system you may be using. Inspired by Jim Dalton’s book “Mind Over Markets”, this indicator is designed to suit the
표시기는 현재 시세를 작성하여 과거 시세와 비교할 수 있으며 이를 바탕으로 가격 변동을 예측합니다. 표시기에는 원하는 날짜로 빠르게 이동할 수 있는 텍스트 필드가 있습니다. 옵션: 기호 - 표시기가 표시할 기호 선택. SymbolPeriod - 지표가 데이터를 가져올 기간 선택. IndicatorColor - 표시기 색상. HorisontalShift - 지시자가 그린 따옴표를 지정된 막대 수만큼 이동합니다. Inverse - true는 인용 부호를 반대로, false - 원래 보기를 반전합니다. ChartVerticalShiftStep - 차트를 수직으로 이동합니다(키보드의 위/아래 화살표). 다음은 날짜를 입력할 수 있는 텍스트 필드의 설정으로, '엔터'를 누르면 즉시 이동할 수 있습니다.
Volume Profile V6
Andrey Kolesnik
4.67 (3)
시장 매물대 지표(Volume Profile) + 스마트 오실레이터. 통화 쌍, 주식, 선물, 암호화폐 등 거의 모든 종목에서 작동하며, 실제 거래량(Real Volume)과 틱 거래량(Tick Volume)을 모두 지원합니다. 프로파일 생성 범위를 일주일이나 한 달 등으로 자동 설정할 수 있을 뿐만 아니라, 두 개의 수직선(빨간색과 파란색)을 이동하여 수동으로 범위를 설정할 수도 있습니다. 히스트그램 형태로 표시되며, 특정 가격 수준의 히스토그램 너비는 해당 가격대에서 발생한 거래량을 의미합니다. Mode level line color 파라미터를 사용하면 가격이 반등할 가능성이 높은 주요 매물대 수준을 자동으로 표시할 수 있으며, Maximum color 파라미터는 설정된 전체 범위에서 거래가장 많이 발생한 최대 거래량 수준을 별도로 보여줍니다. 스마트 오실레이터는 과매수 및 과매도 구간을 표시합니다. 여러 지표로부터 오는 정보를 분석하고, 처리된 데이터를 바탕으로 과매수 및 과매
BoxChart MT5
Evgeny Shevtsov
5 (7)
The market is unfair if only because 10% of participants manage 90% of funds. An ordinary trader has slim changes to stand against these "vultures". This problem can be solved. You just need to be among these 10%, learn to predict their intentions and move with them. Volume is the only preemptive factor that faultlessly works on any timeframe and symbol. First, the volume appears and is accumulated, and only then the price moves. The price moves from one volume to another. Areas of volume accumu
Volume Profile Canvas
Mauro Italo Gaspari
Volume Profile Canvas - Professional Volume Profile Indicator for MetaTrader 5 DESCRIPTION Volume Profile Canvas is a professional volume profile indicator for MetaTrader 5 that renders directly on the chart using a high-performance Canvas engine. It calculates and displays the volume distribution across price levels, identifying the Point of Control (POC), Value Area High (VAH) and Value Area Low (VAL) in real time. This is a pure analysis tool. It does not trade. It gives you an instant vi
Smart SD Rectangle Tool
Liam Alex Thomas Webb
스마트 공급 및 수요 사각형 도구 인디케이터는 MT5에서 최고의 동반자로, 주요 공급 및 수요 데이터를 즉시 시각화하여 필요한 곳에서 실시간으로 확인할 수 있습니다. 이 도구는 구역 위에 풍부하고 실행 가능한 데이터를 자동으로 오버레이하여 구역 분류, 핍 거리, 강도, 구역 크기 등을 각 구역 안에 깔끔하게 표시합니다. 더 이상 복잡함이나 추측이 필요 없습니다—명확하고 역동적인 인사이트로 여러분의 결정을 지원합니다. 트레이더를 위해 제작. 정밀함으로 구동. 인트라데이 스캘핑을 하든 일일 차트에서 주요 구역을 분석하든, 이 인디케이터는 수동으로 그린 구역을 즉시 스마트 구역으로 전환하여 작업 흐름을 방해하지 않으면서 차트의 정보 가치를 높입니다. ### 주요 기능 **자동 레벨 감지** - 차트상의 모든 구역을 즉시 인식 - 공급 또는 수요로 자동 분류—수동 태깅 불필요 **풍부한 실시간 메트릭** - 표시 항목:   - 구역 크기   - 현재 가격과의 실시간 핍 거리   -
Blahtech Supply Demand MT5
Blahtech Limited
4.54 (13)
Was: $299  Now: $99  Supply Demand uses previous price action to identify potential imbalances between buyers and sellers. The key is to identify the better odds zones, not just the untouched ones. Blahtech Supply Demand indicator delivers functionality previously unavailable on any trading platform. This 4-in-1 indicator not only highlights the higher probability zones using a multi-criteria strength engine, but also combines it with multi-timeframe trend analysis, previously confirmed swings a
Weis Wave Scouter
Jean Carlos Martins Roso
Weis Wave Scouter는 MetaTrader 5용으로 개발된 혁신적인 지표로, Wyckoff 방법론과 VSA(Volume Spread Analysis)의 검증된 원칙을 결합했습니다. 높은 정확성과 깊이 있는 분석을 원하는 트레이더를 위해 설계되었으며, 누적 거래량 파동 분석을 통해 시장을 전술적으로 읽고 추세 반전 및 지속의 핵심 포인트를 식별하는 데 도움을 줍니다. 이 지표는 선명한 시각적 인터페이스를 제공하며, Classic, NightVision, OceanBreeze 등 다양한 테마의 사용자 지정 가능한 색상 히스토그램을 통해 상승 및 하락 파동을 시각화합니다. 주요 기능에는 거래량 급증 감지, 낮은 활동 영역(DeadZone) 식별, 거래량 기반 파동 반전 경고 설정이 포함되어 있습니다. 또한 노력 대비 결과 분석, 원인과 결과 분석, 수요와 공급 분석 등 Wyckoff 및 VSA 이론의 핵심 요소를 지원합니다. Brick Size, Volume Scale Fact
Market Profile 3 ForexArby com
Hussien Abdeltwab Hussien Ryad
4 (15)
Market Profile 3 MetaTrader 5 indicator  version 4.70— is a classic Market Profile implementation that can show the price density over time, outlining the most important price levels, value area, and control value of a given trading session. This indicator can be attached to timeframes between M1 and D1 and will show the Market Profile for daily, weekly, monthly, or even intraday sessions. Lower timeframes offer higher precision. Higher timeframes are recommended for better visibility. It is als
FREE
Order Book, known also as Market Book, market depth, Level 2, - is a dynamically updated table with current volumes of orders to buy and to sell specific financial instument at price levels near Bid and Ask. MetaTrader 5 provides the means for receiving market book from your broker, but in real time only, without access to its history. The indicator OrderBook Cumulative Indicator accumulates market book data online and visualizes them on the chart. In addition, the indicator can show the market
Deriv Synthetic HTF Candle Projection GMT2 Higher Timeframe Candle Projection & Previous Levels Tool for Deriv Synthetic Indices (MT5) Overview Deriv Synthetic HTF Candle Projection GMT2 is a professional MetaTrader 5 indicator built specifically for Deriv Synthetic indices . It projects the current forming Higher Timeframe (HTF) candle onto the chart and automatically draws key reference levels from previous candles. This indicator is designed to help traders maintain higher timeframe context
FREE
Delta Profile Volume
Teresinha Moraes Correia
기술 설명 – MetaTrader 5용 Delta Profile Delta Profile 은 MetaTrader 5에서 정의된 캔들 범위 내의 거래량 흐름을 세부적으로 분석하기 위해 설계된 지표입니다. 이 도구는 각 가격 수준에서 양의 거래량(상승과 관련) 과 음의 거래량(하락과 관련) 간의 불균형을 구조화하고 시각화합니다. 이를 통해 사용자는 실제로 거래가 집중되는 가격 영역과 시장 불균형이 형성되는 구간을 명확하게 파악할 수 있습니다. 핵심 개념 지표는 가격 레벨 을 인식하고 이를 양의 거래량, 음의 거래량 및 순 델타(양-음 차이)로 분류합니다. 각 가격 레벨은 수평 막대 로 차트에 표시되며, 거래가 집중되는 구간을 직관적으로 보여줍니다. 사용자는 분석할 캔들의 개수 , 가격 반올림 정밀도 , 최대 표시 레벨 수 , 표시 옵션 등을 직접 설정할 수 있습니다. 주요 기능 가격 레벨 매핑 : 사용자가 지정한 자릿수에 맞게 가격을 반올림하여 거래량을 집계합니다. 순 델타 계산 : 양
Flow Architect
Alex Amuyunzu Raymond
Flow Architect Lite - Professional Market Structure Toolkit Free Version Features: Core Structure Analysis: Daily VWAP Engine   - Volume-weighted average price for institutional level tracking Standard Deviation Bands (SD1)   - Dynamic support and resistance zones Break of Structure Detection   - Visual markers for market structure shifts Fair Value Gap Identification   - Highlighted imbalance zones on your charts ATR Volatility Context   - Real-time Average True Range measurement Clean Informat
Here is a highly professional, high-converting product description for the Propfolio Auto Gann Zones indicator. This highlights its mathematical precision, clean UI, and advanced auto-mitigation features. MQL5 Product Description Title: Propfolio Auto Gann Zones (MTF & Auto-Mitigating) Description: Gann Theory is one of the most powerful ways to identify market reversals, but drawing the zones manually across multiple timeframes is tedious, subjective, and clutters your charts. The Propfolio Aut
Mirror Chart MT5
Andrej Hermann
5 (1)
The Mirror Chart MT5 is a overlay indicator specifically designed to project a second financial instrument directly onto the main chart window. This tool is invaluable for traders who rely on correlation analysis, as it visualizes the price movements of two different instruments in real time. Unlike traditional overlays, this indicator utilizes intelligent, dynamic centering and scaling logic. It continuously analyzes the visible price range in the current window for both symbols and calculates
FREE
Harmonic Pattern Structure Harmonic Pattern Structure is a professional MetaTrader 5 indicator that automatically detects classic harmonic patterns using strict Fibonacci ratio validation and XABCD price structure. Designed for traders who value precision, clean visuals, and structured analysis, the indicator highlights potential reversal zones based on price geometry, supporting consistent and objective decision-making. SUPPORTED HARMONIC PATTERNS Gartley (222) Butterfly Bat Crab Shark Cy
CVD (Cumulative Volume Delta) for MT5 CVD (Cumulative Volume Delta) for MT5 Simple, fast CVD for volume and order flow trading. It tracks net buying vs selling pressure and plots CVD as candles. The Data Window also shows tick count per candle. What it does Accumulates volume delta from ticks or a chosen timeframe Optional reset: No Reset, Current Chart Period, or a specific timeframe Works on any symbol and timeframe How it’s calculated Tick-based: each incoming tick is labeled as buyer- or sel
CvdDeltaVolumes
Parasbhai N Patel
Delta + CVD & CVD Candles Order-flow indicator combining Delta (Ask–Bid), Cumulative Volume Delta (CVD), and a unique CVD-based synthetic candle system. Shows buy/sell pressure, volume aggressiveness, and momentum shifts with optional Delta histogram, CVD line, and CVD+Delta combined candles. Useful for scalping, intraday trading, divergence detection, and understanding buyer/seller dominance. Overview The Delta + CVD & CVD Candles Indicator combines multiple order-flow tools into one clean
Cumulative Delta NG
Anton Polkovnikov
Cumulative delta indicator As most traders believe, the price moves under the pressure of market buying or selling. When someone redeems an offer standing in the cup, the deal is a "buy". If someone pours into the bid standing in the cup - the deal goes with the direction of "sale". The delta is the difference between purchases and sales. A cumulative delta - the difference between the cumulative sum of purchases and sales for a certain period of time. It allows you to see who is currently contr
BoxInside MT5
Evgeny Shevtsov
5 (4)
This indicator calculates the volume profile and places labels that correspond to the VAH, VAL and POC levels, for each candle individually. Indicator operation features The indicator works on the timeframes from M3 to MN, but it uses the history data of smaller periods: M1 - for periods from M3 to H1, M5 - for periods from H2 to H12, M30 - for the D1 period, H4 - for the W1 period, D1 - for the MN period. The color and location of the VAL, VAH and POC labels on the current candle are considere
FREE
Volume Delta Candle
Muhammad Muzaffar Hussan
Volume Delta Candles: A Comprehensive Tool for In-Depth Trading Analysis Unlock a seamless way to interpret trading experience within each candle. With Volume Delta Candles, there's no need for additional volume indicators—everything you need is built in. This advanced tool utilizes lower timeframes or live market data to present the percentage of buying versus selling volume within each candle as an intuitive color-coded bar. Before diving in, ensure you’re familiar with Volume and Volume Delta
ICT Fair Value Gap Indicator
David Muriithi
4.7 (10)
An ICT fair value gap is a trading concept that identifies market imbalances based on a three-candle sequence. The middle candle has a large body while the adjacent candles have upper and lower wicks that do not overlap with the middle candle. This formation suggests that there is an imbalance where buying and selling powers are not equal. Settings Minimum size of FVG (pips) -> FVGs less than the indicated pips will be not be drawn Show touched FVGs Normal FVG color -> color of FVG that hasn't
FREE
Color Histogram Volume Set
Ricardo Almeida Branco
Do you use volume in your reading of the market? Certainly many traders use it, and do not imagine operating without it. The Color Histogram Volume Set indicator allows the user to choose the value that he considers interesting to monitor. When you pass this you will have visual confirmation and if you want you will also have the audible alert that is given by the indicator. Of course, there are other ways to try to find a high volume, such as assessing whether the volume is above av
Volume Profile Advance
Israr Hussain Shah
Daily & Composite Volume Profile   This is a professional-grade market profile tool designed for MetaTrader 5. It utilizes a   Dual-Profile System   to visualize supply, demand, and liquidity concentrations. Key Features Left Side: Daily Session Profiles Automatically identifies the start and end of every trading day. Generates a unique Volume Profile for each individual day. Allows you to see how value migrated from yesterday to today (e.g., Is today's volume higher or lower than yesterday?).
Quantum Currency Array Indicator for MT5
QUANTUM TRADING SOFTWARE LIMITED
This indicator has been developed to identify and display these trends quickly and easily, allowing you to see instantly, those currency pairs which are trending, and those which are not – and in all timeframes, with just one click. The 28 currency pairs are displayed as a fan as they sweep from strong to weak and back again, and this is why we call it the ‘currency array’. All 28 pairs are arrayed before you, giving an instant visual description of those pairs that are trending strongly, those
Volume Candle Indicator
Pablo Filipe Soares De Almeida
MetaTrader 5용 볼륨 컬러 히스토그램 지표 이 지표는 거래량을 별도의 창에 히스토그램 형태로 표시합니다. 각 막대는 캔들의 방향에 따라 색상이 지정되며, 종가가 시가보다 높을 경우 초록색(상승 추세), 낮을 경우 빨간색(하락 추세)으로 표시됩니다. 색상 변화를 통해 거래자는 가격 움직임과 거래량 간의 관계를 직관적으로 파악할 수 있습니다. 주요 기능 거래량 소스: 틱 볼륨 또는 실제 거래량 선택 가능. 거래량 히스토그램 위에 이동 평균선을 추가할 수 있으며, 이를 통해 거래량의 흐름을 부드럽게 시각화할 수 있습니다. 지원되는 평균 유형: SMA, EMA, SMMA, LWMA. 평균 기간은 사용자가 직접 설정 가능. 모든 종목과 차트 주기에서 완벽하게 호환되며, MetaTrader 5 플랫폼에서 안정적으로 작동합니다. 시각적으로 명확한 디자인으로 거래 결정에 필요한 정보를 빠르게 이해할 수 있습니다.
SMC Venom Model BPR 지표는 Smart Money(SMC) 개념 내에서 일하는 트레이더를 위한 전문 도구입니다. 가격 차트에서 두 가지 주요 패턴을 자동으로 식별합니다. FVG (공정 가치 갭)는 3개의 캔들의 조합으로, 첫 번째와 세 번째 캔들 사이에 갭이 있습니다. 이는 볼륨 지원이 없는 레벨 사이에 구역을 형성하여 종종 가격 수정으로 이어집니다. BPR (균형 가격 범위)은 두 개의 FVG 패턴의 조합으로, "브리지"를 형성합니다. 이는 가격이 낮은 볼륨 활동으로 움직일 때 브레이크아웃과 레벨로의 복귀 구역으로, 캔들 사이에 갭을 생성합니다. 이러한 패턴은 거래자가 차트에서 거래량과 가격 역학을 분석하여 주요 지지/저항 수준, 돌파 구역 및 진입 지점을 식별하는 데 도움이 되며, 여기서 대형 시장 참여자와 일반 참여자 간의 상호 작용이 발생합니다. 이 지표는 사각형과 화살표 형태로 패턴을 시각화하며 유연한 경고 설정도 지원합니다. 주요 특징: 패턴 표시 모드
Wapv Price and volume
Eduardo Da Costa Custodio Santos
MT5용 WAPV 가격 및 거래량 표시기는 (Wyckoff Academy Wave Market) 및 (Wyckoff Academy Price and Volume) 도구 세트의 일부입니다. MT5용 WAPV 가격 및 거래량 표시기는 차트에서 거래량 움직임을 직관적인 방식으로 쉽게 시각화할 수 있도록 만들어졌습니다. 그것으로 당신은 최대 거래량의 순간과 시장이 전문적인 관심을 갖지 않는 순간을 관찰할 수 있습니다 시장이 "스마트 머니"의 움직임이 아니라 관성에 의해 움직이는 순간을 식별합니다. 사용자가 수정할 수 있는 4가지 색상으로 구성되어 있습니다. 빨간색 = 제안 증가 녹색 = 수요 증가 회색 양초 = 수요와 공급의 감소 파란색 = 스마트머니 연기 위쪽 방향으로의 움직임은 강도를 나타냅니다. 하향 움직임 약점을 나타냅니다. Price의 방향에 상관없이 가장 강한 Volume이 올라가야 합니다. R. Wyckoff의 이론에 따라 생성된 지표
VR Atr Pro MT5
Vladimir Pastushak
4.75 (4)
VR ATR Pro 는 이전 거래 기간의 통계적 분석 을 기반으로 목표 수준을 결정하기 위한 기술 지표입니다. 이는 선택한 기간 동안의 평균 가격 변동 을 수학적으로 계산하는 데 기반합니다. 통계에 기반한 지표 작동 원리 이 지표의 작동은 가격의 일일 움직임 관찰에 기반합니다: 각 거래 기간은 특정 변동폭 을 특징으로 합니다 — 가격은 시가를 기준으로 위아래로 일정 포인트 거리를 이동합니다. 마찬가지로, 각 새로운 거래 기간이 시작될 때 가격이 조건부 "주행 거리" 를 가지고 있다고 가정할 수 있습니다... 간단한 수학적 계산을 통해 평균값 이 결정됩니다... 이 평균값은 보장된 것은 아니지만, 현재 기간에서 가능한 움직임 크기를 나타내는 기준 역할을 합니다. 따라서 이 지표는 다음과 같은 원리를 적용합니다: 선택한 기간 동안의 역사적 가격 변동 을 분석하고, 통계적 평균값 을 계산하여 차트에 수준을 표시합니다. 이를 통해 트레이더는 현재 금융 상품의 강도 와 "주행 거리" 를 이해
이 제품의 구매자들이 또한 구매함
SuperScalp Pro
Van Minh Nguyen
5 (14)
SuperScalp Pro – 고급 다중 필터 스캘핑 인디케이터 시스템 SuperScalp Pro는 클래식 Supertrend와 여러 지능형 확인 필터를 결합한 고급 스캘핑 인디케이터 시스템입니다. 해당 인디케이터는 M1부터 H4까지 모든 타임프레임에서 효율적으로 작동하며, 특히 XAUUSD, BTCUSD 및 주요 외환 통화쌍에 적합합니다. 독립형 시스템으로 사용하거나 기존 거래 전략에 유연하게 통합할 수 있습니다. 이 인디케이터는 11개 이상의 필터를 통합하며, 빠른/느린 EMA, 추세 판별용 3개의 EMA, EMA 기울기(EMA slope), RSI, ADX, 거래량(Volume), VWAP, 볼린저 밴드 돌파(Bollinger Bands Breakout) 및 MACD 다이버전스 필터 등을 포함합니다. 스마트 캔들 필터는 캔들 종가를 확인하여 약한 신호를 제거하고, 3 EMA와 MACD 다이버전스 필터를 결합한 추세 인식 메커니즘은 더 높은 승률의 신호를 선별하는 데 도움을 줍니
Azimuth Pro
Ottaviano De Cicco
5 (6)
LAUNCH PROMO Azimuth Pro price is initially set at 299$ for the first 100 buyers. Final price will be 499$ . THE DIFFERENCE BETWEEN RETAIL AND INSTITUTIONAL ENTRIES ISN'T THE INDICATOR — IT'S THE LOCATION. Most traders enter at arbitrary price levels, chasing momentum or reacting to lagging signals. Institutions wait for price to reach structured levels where supply and demand actually shift. Azimuth Pro maps these levels automatically: swing-anchored VWAP, multi-timeframe structure lines, an
Divergence Bomber
Ihor Otkydach
4.9 (86)
이 지표를 구매하신 분께는 다음과 같은 혜택이 무료로 제공됩니다: 각 거래를 자동으로 관리하고, 손절/익절 수준을 설정하며, 전략 규칙에 따라 거래를 종료하는 전용 도우미 툴 "Bomber Utility" 다양한 자산에 맞게 지표를 설정할 수 있는 셋업 파일(Set Files) "최소 위험", "균형 잡힌 위험", "관망 전략" 모드로 설정 가능한 Bomber Utility의 셋업 파일 이 전략을 빠르게 설치, 설정, 시작할 수 있도록 돕는 단계별 영상 매뉴얼 주의: 위의 모든 보너스를 받기 위해서는 MQL5 개인 메시지 시스템을 통해 판매자에게 연락해 주세요. 독창적인 커스텀 지표인 “Divergence Bomber(다이버전스 봄버)”를 소개합니다. 이 지표는 MACD 다이버전스(괴리) 전략을 기반으로 한 올인원(All-in-One) 거래 시스템입니다. 이 기술 지표의 주요 목적은 가격과 MACD 지표 간의 다이버전스를 감지하고, **향후 가격이 어느 방향으로 움직일지를 알려주는
Power Candles MT5
Daniel Stein
5 (7)
Power Candles – 모든 시장을 위한 강도 기반 진입 신호 Power Candles 는 Stein Investments의 검증된 강도 분석을 가격 차트에 직접 제공합니다. 가격 움직임에만 반응하는 대신, 각 캔들은 실제 시장 강도를 기준으로 색상화되어 모멘텀 형성, 강도 가속, 명확한 추세 전환을 즉시 파악할 수 있습니다. 모든 시장을 위한 단일 로직 Power Candles는 모든 거래 심볼 에서 자동으로 작동합니다. 현재 심볼이 Forex인지 비-Forex 시장인지 자동으로 감지하여 내부적으로 적절한 강도 모델을 적용합니다. Forex 및 Gold 는 FX Power Delta 값을 사용합니다 (절대값 범위 최대 100) 지수, 크립토 및 CFD 는 IX Power Strength 값을 사용합니다 (절대값 범위 최대 50) 필요한 강도 계산은 Power Candles에 완전히 내장되어 있습니다. 캔들 색상이나 신호 로직을 위해 추가 인디케이터는 필요하지 않습니다. 가격
Entry In The Zone and SMC Multi Timeframe is a real-time 2-in-1 market analysis tool that combines market structure analysis and a No Repaint BUY / SELL signal system into a single indicator, built on Smart Money Concepts (SMC) — a widely adopted framework used by professional traders to understand market structure. This indicator helps you see the market more clearly, make decisions based on structure rather than guesswork, and focus on high-probability zones where price is more likely to react
이 지표를 구매하면 제 프로페셔널 트레이드 매니저를 무료로 드립니다. 우선 이 거래 시스템이 리페인팅, 리드로잉 및 레이그 인디케이터가 아니라는 점을 강조하는 것이 중요합니다. 이는 수동 및 로봇 거래 모두에 이상적인 것으로 만듭니다. 온라인 강좌, 설명서 및 프리셋 다운로드. "스마트 트렌드 트레이딩 시스템 MT5"은 새로운 및 경험이 풍부한 트레이더를 위해 맞춤형으로 제작된 종합적인 거래 솔루션입니다. 10개 이상의 프리미엄 인디케이터를 결합하고 7개 이상의 견고한 거래 전략을 특징으로 하여 다양한 시장 조건에 대한 다목적 선택이 가능합니다. 트렌드 추종 전략: 효과적인 트렌드 추이를 타기 위한 정확한 진입 및 손절 관리를 제공합니다. 반전 전략: 잠재적인 트렌드 반전을 식별하여 트레이더가 범위 시장을 활용할 수 있게 합니다. 스캘핑 전략: 빠르고 정확한 데이 트레이딩 및 단기 거래를 위해 설계되었습니다. 안정성: 모든 인디케이터가 리페인팅, 리드로잉 및 레이그가 아니므로 신뢰
OmniSync Projection
Antonio-alin Teculescu
5 (1)
Chronos Fractal Engine is an innovative price projection indicator for MetaTrader 5, designed to transform your technical analysis by intelligently identifying and projecting historical price patterns. Built upon an advanced correlation algorithm and the fractal principles of the market, this powerful tool visualizes potential future price movements, giving you a unique edge in your trading decisions. What is Chronos Fractal Engine? At its core, the Chronos Fractal Engine employs a sophisticat
Meridian Pro
Ottaviano De Cicco
5 (1)
Meridian Pro: Professional Multi-Timeframe Trend Matrix for MT5 Overview Meridian Pro is a multi-timeframe trend matrix by Merkava Labs that compresses directional state, strength, momentum condition and matrix agreement into one compact panel. One adaptive engine, applied consistently from M1 to W1. No per-symbol tuning. No indicator stacking. One structured readout across every asset and every timeframe. Launch Offer — Get Meridian Pro for USD 99 (introductory). Regular price: USD 149. 1. Why
Power Bar MT5
Daniel Stein
실제 자금을 투입하기 전에 어떤 전략이 내 심볼에서 효과적인지 확인하세요. Power Bar는 모든 심볼과 모든 타임프레임에서 극단적인 가격 바 를 감지한 다음, 3가지 다른 트레이딩 전략을 즉시 백테스트하여 승률, 수익 팩터, 손익을 나란히 비교할 수 있습니다. 모든 것이 하나의 인터랙티브 패널에 담겨 있습니다. 추측 없음. 커브 피팅 없음. 오직 데이터뿐입니다. Power Bar가 특별한 이유 대부분의 인디케이터는 신호를 주고 그것이 효과가 있는지는 추측에 맡깁니다. Power Bar는 한 걸음 더 나아갑니다 - 모든 신호를 세 가지 전략 에 대해 테스트하고 통계를 보여줍니다. FlipFlop, Momentum, Reversal을 원클릭으로 전환하고 숫자가 즉시 변하는 것을 확인하세요. FlipFlop - 항상 포지션 유지. 신호에 진입하고, 반대 신호에 청산. 당사의 연구에 따르면 US30, US500, DAX와 같은 추세가 있는 지수에서 가장 효과적입니다. Momentum
Trend Screener Pro MT5
STE S.S.COMPANY
4.84 (103)
트렌드 표시기, 트렌드 트레이딩 및 필터링을 위한 획기적인 고유 솔루션, 하나의 도구 안에 내장된 모든 중요한 트렌드 기능! Forex, 상품, 암호 화폐, 지수 및 주식과 같은 모든 기호/도구에 사용할 수 있는 100% 다시 칠하지 않는 다중 시간 프레임 및 다중 통화 표시기입니다. Trend Screener는 차트에 점이 있는 화살표 추세 신호를 제공하는 효율적인 지표 추세 추종 지표입니다. 추세 분석기 표시기에서 사용할 수 있는 기능: 1. 트렌드 스캐너. 2. 최대 이익 분석이 있는 추세선. 3. 추세 통화 강도 측정기. 4. 경고가 있는 추세 반전 점. 5. 경고가 있는 강력한 추세 점. 6. 추세 화살표 Trend Screener Indicator가 있는 일일 분석 예, 일일 신호 성능...등은 여기에서 찾을 수 있습니다. 여기를 클릭하십시오. LIMITED TIME OFFER : Trend Screener Indicator는 50$ 및 평생 동안만 사용할 수 있습니다.
FX Trend MT5 NG
Daniel Stein
5 (4)
FX Trend NG: 차세대 멀티 마켓 트렌드 인텔리전스 개요 FX Trend NG 는 다중 시간 프레임 기반의 전문 트렌드 분석 및 시장 모니터링 도구입니다. 몇 초 만에 전체 시장 구조를 파악할 수 있도록 설계되었습니다. 여러 차트를 일일이 전환할 필요 없이, 어떤 종목이 추세에 있는지, 어디에서 모멘텀이 약화되고 있는지, 그리고 어떤 시간 프레임이 서로 정렬되어 있는지 즉시 확인할 수 있습니다. 출시 기념 특별 혜택 – FX Trend NG 를 $30 (6개월) 또는 $80 평생 라이선스 로 이용할 수 있습니다. 이미 Stein Investments 고객이신가요? -> 메시지를 보내 전용 고객 그룹에 참여하세요. 설정이나 사용 방법이 필요하신가요? -> Stein Investments 공식 페이지 를 방문하세요. 1. FX Trend NG가 특별한 이유 3단계 추세 로직 – 단순한 Buy / Sell이 아닙니다 • 대부분의 지표는 Buy 또는 Sell 두 가지 상태만 제
Atomic Analyst MT5
Issam Kassas
3.94 (31)
우선적으로 언급할 점은이 거래 지표가 다시 그리지 않고 지연되지 않으며 이를 통해 수동 및 로봇 거래 모두에 이상적이라는 점입니다. 사용자 매뉴얼: 설정, 입력 및 전략. Atomic Analyst는 가격의 강도와 모멘텀을 활용하여 시장에서 더 나은 이점을 찾는 PA Price Action Indicator입니다. 고급 필터를 장착하여 잡음과 거짓 신호를 제거하고 거래 잠재력을 높이는 데 도움이 됩니다. 복잡한 지표의 다중 레이어를 사용하여 Atomic Analyst는 차트를 스캔하고 복잡한 수학적 계산을 간단한 신호와 색상으로 변환하여 초보 트레이더가 이해하고 일관된 거래 결정을 내릴 수 있도록합니다. "Atomic Analyst"는 새로운 및 경험이 풍부한 트레이더를위한 종합적인 거래 솔루션입니다. 프리미엄 지표와 최고 수준의 기능을 하나의 거래 전략에 결합하여 모든 종류의 트레이더에 대한 다재다능한 선택지가되었습니다. 인트라데이 거래 및 스캘핑 전략 : 빠르고 정확한 일일
RFI levels PRO MT5
Roman Podpora
3.67 (3)
이 지표는 추세 반전 지점과 가격 반등 영역을 정확하게 보여줍니다.       주요 투자자들   . 새로운 트렌드가 형성되는 곳을 파악하고 최대한 정확하게 의사결정을 내리며 모든 거래를 완벽하게 통제합니다. TREND LINES PRO   지표와 함께 사용할 때 최대의 잠재력을 발휘합니다.  VERSION MT4 지표가 보여주는 내용: 새로운 추세의 시작 시 활성화되는 반전 구조 및 반전 수준. 최소한의 위험 대비 수익률을 갖는 이익 실현   (TAKE PROFIT)   및   손절매(STOP LOSS)   레벨 표시       RR 1:2   . 지능형 손실 감소 로직이 적용된 손절매 기능. 지정된 지표에서 두 가지 추세 유형에 대한 반전 패턴을 표시합니다. 지표: 트렌드를 따라   트렌드 라인 프로   (글로벌 트렌드 변화) 트렌드 프로   (빠른 트렌드 변화) 간단하고 효과적입니다       스캐너       실시간 추세 (신규). 다중 시간 프레임 도구 필터링. 표시하다  
Crystal Heikin Ashi Signals
Muhammad Jawad Shabir
5 (2)
Crystal Heikin Ashi Signals - Professional Trend & Signal Detection Indicator Advanced Heikin Ashi Visualization with Intelligent Signal System for Manual & Automated Trading Final Price: $149 ---------> Price goes up $10 after every 10 sales . Limited slots available — act fast . Overview Crystal Heikin Ashi Signals is a professional-grade MetaTrader 5 indicator that combines pure Heikin Ashi candle visualization with an advanced momentum-shift detection system. Designed for both manual traders
Btmm state engine pro
Garry James Goodchild
5 (3)
BTMM State Engine Pro is a MetaTrader 5 indicator for traders who use the Beat The Market Maker approach: Asian session context, kill zone timing, level progression, peak formation detection, and a multi-pair scanner from a single chart. It combines cycle state logic with a built-in scanner dashboard so you do not need the same tool on many charts at once. What it does Draws the Asian session range; session times can follow broker server offset or be set in inputs. Tracks level progression (L
FX Power MT5 NG
Daniel Stein
5 (31)
FX Power: 통화 강세 분석으로 더 스마트한 거래 결정을 개요 FX Power 는 어떤 시장 상황에서도 주요 통화와 금의 실제 강세를 이해하기 위한 필수 도구입니다. 강한 통화를 매수하고 약한 통화를 매도함으로써 FX Power 는 거래 결정을 단순화하고 높은 확률의 기회를 발견합니다. 트렌드를 따르거나 극단적인 델타 값을 사용해 반전을 예측하고자 한다면, 이 도구는 귀하의 거래 스타일에 완벽히 적응합니다. 단순히 거래하지 말고, FX Power 로 더 스마트하게 거래하세요. 1. FX Power가 거래자에게 매우 유용한 이유 통화와 금의 실시간 강세 분석 • FX Power 는 주요 통화와 금의 상대적 강세를 계산하고 표시하여 시장 역학에 대한 명확한 통찰력을 제공합니다. • 어떤 자산이 앞서고 있고 어떤 자산이 뒤처지는지 모니터링하여 보다 현명한 거래 결정을 내릴 수 있습니다. 포괄적인 멀티 타임프레임 뷰 • 단기, 중기 및 장기 타임프레임에서 통화와 금의 강세를
Currency Strength Dashboard Pro
Anastasia Danilova
5 (1)
Currency Strength Dashboard Pro MetaTrader 5 를 위한 실시간 통화 강도 분석 전문 대시보드 입니다. 이 지표는 8개의 주요 통화 (EUR, USD, GBP, JPY, CHF, AUD, CAD, NZD)의 강도를 계산하고, 28개의 통화쌍 을 동시에 여러 시간 프레임에서 분석하여 표시합니다. 이 대시보드는 트레이더가 추가 계산이나 여러 차트 간 전환 없이 한눈에 시장 전체 상황을 파악 할 수 있도록 해줍니다. 계산 방법 이 지표는 고급 수학적 통화 강도 분석 방법 을 기반으로 합니다. 이는 유사한 지표에서 널리 사용되는 RSI 기반 방법 보다 더 정확하고 객관적인 결과를 제공합니다. 이 방법은 28개의 모든 통화쌍 간의 관계를 동시에 분석 하여 시장에서 실제로 형성되는 힘의 균형을 보다 명확하고 편향 없이 보여줍니다. 실시간 대시보드 메인 테이블에는 8개의 통화 에 대한 전체 데이터가 표시됩니다. Rank (순위) — 전체 강도 기준 통화 순위, 1
Trend indicator AI mt5
Ramil Minniakhmetov
5 (16)
트렌드 인공 지능 지표는 실행 가능한 진입 점 및 반전 경고와 추세 식별을 결합하여 상인의 시장 분석을 향상시킬 훌륭한 도구입니다. 이 표시기는 사용자가 자신감과 정밀도로 외환 시장의 복잡성을 탐색 할 수 있도록 지원합니다 기본 신호 외에도 트렌드 인공 지능 지표는 풀백 또는 되돌림 중에 발생하는 2 차 진입 점을 식별하여 거래자가 기존 트렌드 내에서 가격 수정을 활용할 수 있도록합니다. 중요한 장점: ·작동 4 및 5 *명확한 구매 또는 판매 신호 *다시 칠하지 않습니다 *모든 자산에서 작동 나는 전보 사기에 개 또는 세트를 판매하지 않도록주의. 모든 설정은 블로그에 여기에 무료.  중요! 지침 및 보너스를 얻기 위해 구입 후 즉시 저에게 연락! 진짜 가동 감시는 뿐 아니라 나의 다른 제품 여기에서 찾아낼 수 있습니다: https://www.mql5.com/en/users/mechanic/seller&nbsp ; 설정 및 입력: 모든 자산에 대해 기본 설정을 권
RelicusRoad Pro MT5
Relicus LLC
5 (24)
RelicusRoad Pro: 퀀트 시장 운영 체제 70% 할인 평생 이용권 (한정 시간) - 2,000명 이상의 트레이더와 함께하세요 왜 대부분의 트레이더는 "완벽한" 지표를 가지고도 실패할까요? 진공 상태에서 단일 개념 만으로 거래하기 때문입니다. 문맥 없는 신호는 도박입니다. 지속적인 승리를 위해서는 컨플루언스(중첩) 가 필요합니다. RelicusRoad Pro는 단순한 화살표 지표가 아닙니다. 완전한 퀀트 시장 생태계 입니다. 독점적인 변동성 모델링을 사용하여 가격이 이동하는 "공정 가치 로드"를 매핑하고, 단순 노이즈와 실제 구조적 돌파를 구분합니다. 추측은 그만두세요. 기관급 로드 로직으로 거래를 시작하세요. 핵심 엔진: "Road" 알고리즘 시스템의 중심에는 시장 상황에 실시간으로 적응하는 동적 변동성 채널인 Road Algo 가 있습니다. 세이프 라인(평형) 과 가격이 수학적으로 반전될 가능성이 높은 확장 레벨 을 투영합니다. Simple Road: 일반적인 시장을 위
Gann Made Easy MT5
Oleg Rodin
5 (1)
Gann Made Easy 는 mr.의 이론을 사용하여 최고의 거래 원칙을 기반으로 하는 전문적이고 사용하기 쉬운 Forex 거래 시스템입니다. W.D. 간. 이 표시기는 Stop Loss 및 Take Profit Levels를 포함하여 정확한 BUY 및 SELL 신호를 제공합니다. PUSH 알림을 사용하여 이동 중에도 거래할 수 있습니다. 구매 후 거래 방법 안내 및 유용한 추가 지표를 무료로 받으시려면 저에게 연락주세요! 아마도 Gann 거래 방법에 대해 이미 여러 번 들었을 것입니다. 일반적으로 Gann의 이론은 초보자 거래자뿐만 아니라 이미 거래 경험이 있는 사람들에게도 매우 복잡한 것입니다. Gann의 거래 방식은 이론적으로 적용하기 쉽지 않기 때문입니다. 나는 그 지식을 연마하고 Forex 지표에 최고의 원칙을 적용하기 위해 몇 년을 보냈습니다. 표시기는 적용하기가 매우 쉽습니다. 차트에 첨부하고 간단한 거래 권장 사항을 따르기만 하면 됩니다. 지표는 지속적으로 시장 분석
ARICoins
Temirlan Kdyrkhan
ARICoin is a powerful trading companion designed to generate high-probability entry signals with dynamic TP/SL/DP levels based on volatility. Built-in performance tracking shows win/loss stats, PP1/PP2 hits, and success rates all updated live. Key Features: Buy/Sell signals with adaptive volatility bands Real-time TP/SL/DP levels based on ATR Built-in MA Filter with optional ATR/StdDev volatility Performance stats panel (Success, Profit/Loss, PP1/PP2) Alerts via popup, sound, push, or email Cust
Market Structure Order Block Dashboard MT5 는 MetaTrader 5용 MT5 인디케이터 로, 시장 구조 및 ICT / Smart Money Concepts에 기반합니다: HH/HL/LH/LL , BOS , ChoCH 뿐 아니라 Order Blocks , Fair Value Gaps (FVG) , 유동성 (EQH/EQL, sweeps), 세션 / Kill Zones , 그리고 Volume Profile 을 통합하여 콤팩트한 컨플루언스 대시보드를 제공합니다. 중요: 본 제품은 분석 도구 입니다. 자동 매매를 실행하지 않습니다( EA가 아님 ). 구매자 보너스 구매 후 제 스토어에서 보너스 인디케이터 2개 를 (선택하여) 무료로 받을 수 있습니다. 보너스 수령 방법: 1) 본 제품에 대한 솔직한 리뷰를 남겨주세요. 2) MQL5 메시지로 BONUS MSOB + 선택한 인디케이터 2개 이름 을 보내주세요. 주요 기능 시장 구조: HH/HL/LH/LL
Bill Williams Advanced
Siarhei Vashchylka
5 (11)
Bill Williams Advanced is designed for automatic chart analysis using Bill Williams' "Profitunity" system. The indicator analyzes four timeframes at once. Manual (Be sure to read before purchasing) Advantages 1. Analyzes the chart using Bill Williams' "Profitunity" system. Signals are displayed in a table in the corner of the screen and on the price chart. 2. Finds all known AO and AC signals, as well as zone signals. Equipped with a trend filter based on the Alligator. 3. Finds "Divergence Bar
CGE Trading Suite
Carl Gustav Johan Ekstrom
5 (1)
CGE Trading Suite delivers the analytical edge typically reserved for professional trading desks. The platform integrates a full suite of analytical tools into one seamless workflow: dynamic grid mapping, liquidity behavior analysis, ECM, trend lines, MIDAS, trade cycles, and directional channel projections. Together, these provide a unified view of market structure and momentum. Directional clarity is further enhanced by the capital flow index, which measures currency basket strength to identif
ARIPoint
Temirlan Kdyrkhan
ARIPoint is a powerful trading companion designed to generate high-probability entry signals with dynamic TP/SL/DP levels based on volatility. Built-in performance tracking shows win/loss stats, PP1/PP2 hits, and success rates all updated live. Key Features: Buy/Sell signals with adaptive volatility bands Real-time TP/SL/DP levels based on ATR Built-in MA Filter with optional ATR/StdDev volatility Performance stats panel (Success, Profit/Loss, PP1/PP2) Alerts via popup, sound, push, or email Cu
Quantum TrendPulse
Bogdan Ion Puscasu
5 (22)
SuperTrend   ,   RSI   ,   Stochastic   의 힘을 하나의 포괄적인 지표로 결합하여 트레이딩 잠재력을 극대화하는 궁극의 트레이딩 도구   인 Quantum TrendPulse를   소개합니다. 정밀성과 효율성을 추구하는 트레이더를 위해 설계된 이 지표는 시장 추세, 모멘텀 변화, 최적의 진입 및 종료 지점을 자신 있게 식별하는 데 도움이 됩니다. 주요 특징: SuperTrend 통합:   주요 시장 추세를 쉽게 따라가고 수익성의 물결을 타세요. RSI 정밀도:   매수 과다 및 매도 과다 수준을 감지하여 시장 반전 시점을 파악하는 데 적합하며 SuperTrend 필터로 사용 가능 확률적 정확도:   변동성이 큰 시장에서 숨겨진 기회를 찾기 위해 확률적 진동   을 활용하고 SuperTrend의 필터로 사용 다중 시간대 분석:   M5부터 H1 또는 H4까지 다양한 시간대에 걸쳐 시장을 최신 상태로 유지하세요. 맞춤형 알림:   맞춤형 거래 조건이 충족되면
Gold Sniper Scalper Pro
Ich Khiem Nguyen
3.78 (9)
Gold Sniper Scalper Pro는 XAUUSD에서 허위 돌파 (false breakout) 패턴을 감지하기 위해 특별히 설계된 MetaTrader 5 지표입니다. 가격이 레인지 경계를 돌파하여 돌파 트레이더를 유인한 후 반전하는 4봉 트랩 구조를 식별합니다. 지표는 각 셋업을 17개 품질 요소로 평가하고, 4계층 합류 파이프라인을 통해 처리하며, 7타임프레임 추세 합의 엔진으로 검증하고, 금 변동성 상태 분류기로 필터링합니다. 이 모든 과정이 신호가 차트에 표시되기 전에 완료됩니다. 자세한 사용자 가이드는 작성자의   MQL5 블로그 에서 확인할 수 있습니다. 추가 업데이트는 작성자의   MQL5 채널 을 통해 제공됩니다. 현재 지원 정책에 따라 구매자는 저자가 개발한 선별된 보조 도구에 대한 추가 접근 권한을 받을 수 있습니다. Forex 쌍, 지수 및 암호화폐에서도 작동하지만, 감지 매개변수, 변동성 처리 및 필터 로직은 XAUUSD 특성에 최적화되어 있습니다.
Trend Lines PRO MT5
Roman Podpora
5 (1)
트렌드 라인즈 프로       이 지표는 시장이 실제로 어떤 방향으로 전환되는지 파악하는 데 도움이 됩니다. 실제 추세 반전 지점과 주요 시장 참여자들이 다시 진입하는 지점을 보여줍니다. 보시다시피       BOS 라인       복잡한 설정이나 불필요한 노이즈 없이 더 높은 시간대의 추세 변화와 주요 레벨을 확인할 수 있습니다. 신호는 차트에 다시 그려지지 않고 캔들이 마감된 후에도 계속 표시됩니다. MT4 버전   -   RFI LEVELS PRO   표시기   와 결합 시 최대 잠재력을 발휘합니다. 지표가 보여주는 내용: 실제 변화       추세(BOS 라인) 한 번 신호가 나타나면 그 신호는 계속 유효합니다! 이는 신호를 발생시킨 후 변경될 수 있는 리페인팅 방식의 지표와 중요한 차이점입니다. 리페인팅 방식의 지표는 잠재적으로 자금 손실로 이어질 수 있습니다. 이제 더욱 높은 확률과 정확도로 시장에 진입할 수 있습니다. 또한 화살표가 나타난 후 목표가(익절)에 도달하거나
FX Levels MT5
Daniel Stein
5 (13)
FX Levels: 모든 시장을 위한 뛰어난 정확도의 지지와 저항 간단 요약 통화쌍, 지수, 주식, 원자재 등 어떤 시장이든 믿을 만한 지지·저항 레벨을 찾고 싶나요? FX Levels 는 전통적인 “Lighthouse” 기법과 첨단 동적 접근을 결합해, 거의 보편적인 정확성을 제공합니다. 실제 브로커 경험을 반영하고, 자동화된 일별 업데이트와 실시간 업데이트를 결합함으로써 FX Levels 는 가격 반전 포인트를 파악하고, 수익 목표를 설정하며, 자신 있게 트레이드를 관리할 수 있게 돕습니다. 지금 바로 시도해 보세요—정교한 지지/저항 분석이 어떻게 여러분의 트레이딩을 한 단계 끌어올릴 수 있는지 직접 확인하세요! 1. FX Levels가 트레이더에게 매우 유용한 이유 뛰어난 정확도의 지지·저항 존 • FX Levels 는 다양한 브로커 환경에서도 거의 동일한 존을 생성하도록 설계되어, 데이터 피드나 시간 설정 차이로 인한 불일치를 해소합니다. • 즉, 어떤 브로커를 사용하
Smart Stop Indicator – 차트 위에서 직접 작동하는 지능형 스톱로스 시스템 개요 Smart Stop Indicator는 감이나 추측이 아닌 명확하고 체계적인 방식으로 스톱로스를 설정하고 싶은 트레이더를 위한 맞춤형 솔루션입니다. 이 도구는 클래식 프라이스 액션 논리(고점, 저점 구조)와 현대적인 브레이크아웃 인식을 결합하여 실제로 가장 논리적인 다음 스톱 레벨을 정확히 식별합니다. 추세, 박스권, 빠른 브레이크아웃 상황 등 어떤 시장에서도 인디케이터는 최적의 SL 구역과 상태(“new”, “broken”, “valid”)를 차트에 직접 표시합니다. 새로운 기능으로 SL 거리의 %ADR 표시가 추가되었습니다. 핵심 기능 자동 시장구조 기반 스톱 설정 • 시장 구조와 실시간 가격 움직임을 기반으로 의미 있는 스톱로스 레벨을 자동으로 탐지합니다. 스마트 브레이크아웃 감지 • 빠른 방향 변화나 돌파 상황에서도 불필요한 조기 스톱 조정을 강요하지 않으며 유연하게 반응합
제작자의 제품 더 보기
Rsi Pro Trader
Luigi Amoresano
RSI PRO Trader v1.80  is a no-nonsense, fully-automated Expert Advisor for MetaTrader 5 that trades off the classic Relative Strength Index (RSI), with an optional Stochastic filter and a suite of advanced risk-management tools. It’s not a holy grail—but if you know what you’re doing, it’ll give you plenty of control over entries, exits and position sizing. Core Logic RSI-based entries Trades open when RSI(Period) breaches configurable overbought/oversold levels. Lower threshold is auto-compu
필터:
리뷰 없음
리뷰 답변