Cumulative Volume Delta CVD Indicator

CVD (Cumulative Volume Delta) for MT5 CVD (Cumulative Volume Delta) for MT5

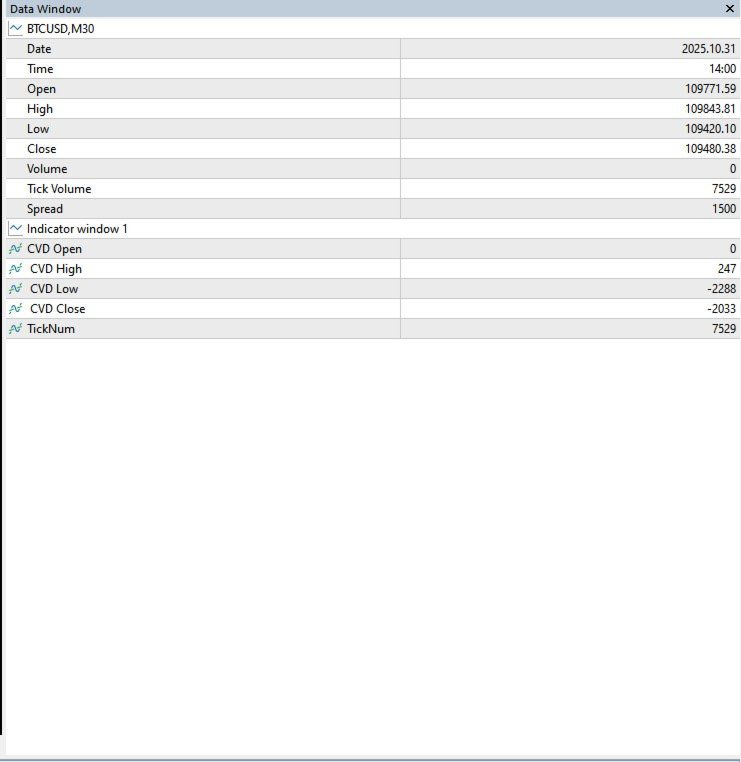
Simple, fast CVD for volume and order flow trading. It tracks net buying vs selling pressure and plots CVD as candles. The Data Window also shows tick count per candle.

What it does

  • Accumulates volume delta from ticks or a chosen timeframe
  • Optional reset: No Reset, Current Chart Period, or a specific timeframe
  • Works on any symbol and timeframe

How it’s calculated

  • Tick-based: each incoming tick is labeled as buyer- or seller-initiated by comparing price changes (bid/ask). CVD adds +1 for a buy tick, −1 for a sell tick (0 if unchanged). This counts upticks vs downticks in real time.
  • Timeframe-based: for each calculation candle, the sign comes from candle direction (close vs open). The magnitude is that candle’s tick volume. CVD adds signed tick volume to the running total.
  • The running total is plotted as CVD candles. The Data Window also shows the number of ticks per chart candle.

Notes

  • First-time load: MT5 may need to download candles and ticks from your broker. Give it a moment; scrolling the chart or changing timeframe can help MT5 fetch data.
  • Accuracy vs performance: Tick-based is most accurate; M1 is generally more accurate than M5, M15, and so on. Tick-based can be heavier on CPU/data than timeframe modes.

Inputs

  • Calculation Period: Tick Based or M1–MN1
  • Reset Period: No Reset, Current Chart, or M1–MN1

Troubleshooting

  • Not visible: Ensure the file is in MQL5/Indicators and restart MT5
  • No ticks (tick mode): Switch to timeframe mode or wait for market open; ensure the symbol has tick data
  • Not updating: Calculation Period ≤ chart timeframe, Reset Period ≥ chart timeframe; check connection
  • Slow terminal: Prefer timeframe mode (M5/M15) or close extra charts

Support

Message via MQL5 for quick help, settings guidance, or simple customizations.

Disclaimer: This is an analysis tool, not a standalone signal. Use with sound risk management.

추천 제품
Volume Profile V6
Andrey Kolesnik
4.67 (3)
시장 매물대 지표(Volume Profile) + 스마트 오실레이터. 통화 쌍, 주식, 선물, 암호화폐 등 거의 모든 종목에서 작동하며, 실제 거래량(Real Volume)과 틱 거래량(Tick Volume)을 모두 지원합니다. 프로파일 생성 범위를 일주일이나 한 달 등으로 자동 설정할 수 있을 뿐만 아니라, 두 개의 수직선(빨간색과 파란색)을 이동하여 수동으로 범위를 설정할 수도 있습니다. 히스트그램 형태로 표시되며, 특정 가격 수준의 히스토그램 너비는 해당 가격대에서 발생한 거래량을 의미합니다. Mode level line color 파라미터를 사용하면 가격이 반등할 가능성이 높은 주요 매물대 수준을 자동으로 표시할 수 있으며, Maximum color 파라미터는 설정된 전체 범위에서 거래가장 많이 발생한 최대 거래량 수준을 별도로 보여줍니다. 스마트 오실레이터는 과매수 및 과매도 구간을 표시합니다. 여러 지표로부터 오는 정보를 분석하고, 처리된 데이터를 바탕으로 과매수 및 과매
Weis Wave Scouter
Jean Carlos Martins Roso
Weis Wave Scouter는 MetaTrader 5용으로 개발된 혁신적인 지표로, Wyckoff 방법론과 VSA(Volume Spread Analysis)의 검증된 원칙을 결합했습니다. 높은 정확성과 깊이 있는 분석을 원하는 트레이더를 위해 설계되었으며, 누적 거래량 파동 분석을 통해 시장을 전술적으로 읽고 추세 반전 및 지속의 핵심 포인트를 식별하는 데 도움을 줍니다. 이 지표는 선명한 시각적 인터페이스를 제공하며, Classic, NightVision, OceanBreeze 등 다양한 테마의 사용자 지정 가능한 색상 히스토그램을 통해 상승 및 하락 파동을 시각화합니다. 주요 기능에는 거래량 급증 감지, 낮은 활동 영역(DeadZone) 식별, 거래량 기반 파동 반전 경고 설정이 포함되어 있습니다. 또한 노력 대비 결과 분석, 원인과 결과 분석, 수요와 공급 분석 등 Wyckoff 및 VSA 이론의 핵심 요소를 지원합니다. Brick Size, Volume Scale Fact
Advanced Volume Profile Analysis Tool for MetaTrader 5 The Kecia Volume Profile Order Finder provides traders with volume profile analysis capabilities. This MT5 indicator combines volume profile visualization with statistical calculations to help identify potential trading opportunities and suggests entry, stop loss, and take profit levels based on market structure. Market Profile Visualization Transform your chart with customizable volume profile visualizations: Multiple visualization options
Blahtech Market Profile MT5
Blahtech Limited
5 (10)
Was: $249  Now: $99   Market Profile defines a number of day types that can help the trader to determine market behaviour. A key feature is the Value Area, representing the range of price action where 70% of trading took place. Understanding the Value Area can give traders valuable insight into market direction and establish the higher odds trade. It is an excellent addition to any system you may be using. Inspired by Jim Dalton’s book “Mind Over Markets”, this indicator is designed to suit the
Cumulative Delta NG
Anton Polkovnikov
Cumulative delta indicator As most traders believe, the price moves under the pressure of market buying or selling. When someone redeems an offer standing in the cup, the deal is a "buy". If someone pours into the bid standing in the cup - the deal goes with the direction of "sale". The delta is the difference between purchases and sales. A cumulative delta - the difference between the cumulative sum of purchases and sales for a certain period of time. It allows you to see who is currently contr
WaveTrend Oscillator MT5는 모멘텀 변화와 잠재적인 추세 반전을 식별하여 시장 분석을 향상시키기 위해 설계된 강력한 거래 지표입니다. 모든 수준의 트레이더에게 이상적인 이 도구는 forex, 암호화폐 및 상품을 포함한 다양한 시장에서 과매수 및 과매도 조건에 대한 귀중한 통찰력을 제공합니다. 정확한 매수 및 매도 신호를 생성할 수 있는 능력을 갖춘 WaveTrend Oscillator MT5는 트레이더가 정보에 기반한 결정을 내릴 수 있도록 하여 단기 및 장기 거래 전략 모두에서 성공 확률을 효과적으로 높입니다. MQL 제품 설치 가이드 | MT4/MT5에서 구매한 MQL 제품 업데이트 | 일반 문제 해결 가이드 | 지표 설정 / 가이드 주요 기능 버퍼 통합: 신호 기반 거래 전략을 활용할 수 있도록 지표 값을 접근 가능한 버퍼로 노출합니다. 빠르고 백테스트 가능: MetaTrader의 기본 OnCalculate() 엔진을 기반으로 구축되어 빠른 계산과 전략 테스터
Wedge Pattern MT5
Sathit Sukhirun
Korean 이 보조지표는 차트 패턴 거래를 즐기는 트레이더를 위한 고급 차트 분석 비서 역할을 합니다. 시각적 분석의 부담을 줄이고 수익 창출의 정확성을 높이도록 설계되었습니다. 실제 사용 관점에서 본 이 보조지표의 주요 장점과 특징입니다: 1. 자동 패턴 감지 (Automated Pattern Detection) 시간 절약 및 편향(Bias) 감소: 수동으로 추세선을 그릴 필요가 없습니다. 인디케이터가 가격 스윙(Pivot High/Low)을 검색하고 가격 구조가 조건에 부합할 때 라이징 웨지(Rising Wedge, 상승 쐐기형) 및 폴링 웨지(Falling Wedge, 하락 쐐기형) 구조를 자동으로 그립니다. 모든 상황 포괄: 패턴이 형성되는 중, 브레이크아웃(돌파), 심지어 실패한 패턴까지 감지할 수 있어 시장의 전반적인 흐름을 명확하게 파악할 수 있습니다. 2. 내장된 목표가 및 피보나치 익절 (Built-in Targets & Fibonacci TP) 자동 목표가 계산:
Volume Profile Canvas
Mauro Italo Gaspari
Volume Profile Canvas - Professional Volume Profile Indicator for MetaTrader 5 DESCRIPTION Volume Profile Canvas is a professional volume profile indicator for MetaTrader 5 that renders directly on the chart using a high-performance Canvas engine. It calculates and displays the volume distribution across price levels, identifying the Point of Control (POC), Value Area High (VAH) and Value Area Low (VAL) in real time. This is a pure analysis tool. It does not trade. It gives you an instant vi
Wapv Price and volume
Eduardo Da Costa Custodio Santos
MT5용 WAPV 가격 및 거래량 표시기는 (Wyckoff Academy Wave Market) 및 (Wyckoff Academy Price and Volume) 도구 세트의 일부입니다. MT5용 WAPV 가격 및 거래량 표시기는 차트에서 거래량 움직임을 직관적인 방식으로 쉽게 시각화할 수 있도록 만들어졌습니다. 그것으로 당신은 최대 거래량의 순간과 시장이 전문적인 관심을 갖지 않는 순간을 관찰할 수 있습니다 시장이 "스마트 머니"의 움직임이 아니라 관성에 의해 움직이는 순간을 식별합니다. 사용자가 수정할 수 있는 4가지 색상으로 구성되어 있습니다. 빨간색 = 제안 증가 녹색 = 수요 증가 회색 양초 = 수요와 공급의 감소 파란색 = 스마트머니 연기 위쪽 방향으로의 움직임은 강도를 나타냅니다. 하향 움직임 약점을 나타냅니다. Price의 방향에 상관없이 가장 강한 Volume이 올라가야 합니다. R. Wyckoff의 이론에 따라 생성된 지표
SMC Venom Model BPR 지표는 Smart Money(SMC) 개념 내에서 일하는 트레이더를 위한 전문 도구입니다. 가격 차트에서 두 가지 주요 패턴을 자동으로 식별합니다. FVG (공정 가치 갭)는 3개의 캔들의 조합으로, 첫 번째와 세 번째 캔들 사이에 갭이 있습니다. 이는 볼륨 지원이 없는 레벨 사이에 구역을 형성하여 종종 가격 수정으로 이어집니다. BPR (균형 가격 범위)은 두 개의 FVG 패턴의 조합으로, "브리지"를 형성합니다. 이는 가격이 낮은 볼륨 활동으로 움직일 때 브레이크아웃과 레벨로의 복귀 구역으로, 캔들 사이에 갭을 생성합니다. 이러한 패턴은 거래자가 차트에서 거래량과 가격 역학을 분석하여 주요 지지/저항 수준, 돌파 구역 및 진입 지점을 식별하는 데 도움이 되며, 여기서 대형 시장 참여자와 일반 참여자 간의 상호 작용이 발생합니다. 이 지표는 사각형과 화살표 형태로 패턴을 시각화하며 유연한 경고 설정도 지원합니다. 주요 특징: 패턴 표시 모드
The Accumulation / Distribution is an indicator which was essentially designed to measure underlying supply and demand. It accomplishes this by trying to determine whether traders are actually accumulating (buying) or distributing (selling). This indicator should be more accurate than other default MT5 AD indicator for measuring buy/sell pressure by volume, identifying trend change through divergence and calculating Accumulation/Distribution (A/D) level. Application: - Buy/sell pressure: above
TRI Visualizer
Yoshimi Mon 三 Ura
TRI Visualizer MT5 – Thermodynamic Market Analysis Overview The TRI (Thermal Range Indicator) Visualizer Enhanced is a rare market analysis indicator that goes beyond conventional technical analysis, applying principles of thermodynamics from physics. It interprets market price fluctuations as “thermodynamic energy,” enabling the highly accurate detection of subtle market changes that are often overlooked. Innovative Mechanisms 1. Dual Calculation Engines Classic TRI Mode Formula: |Close
Flow Architect
Alex Amuyunzu Raymond
Flow Architect Lite - Professional Market Structure Toolkit Free Version Features: Core Structure Analysis: Daily VWAP Engine   - Volume-weighted average price for institutional level tracking Standard Deviation Bands (SD1)   - Dynamic support and resistance zones Break of Structure Detection   - Visual markers for market structure shifts Fair Value Gap Identification   - Highlighted imbalance zones on your charts ATR Volatility Context   - Real-time Average True Range measurement Clean Informat
Max Min Delta Indicator - Market Volume Imbalance Analysis Gain Deeper Insights into Market Volume Imbalance with Delta Analysis What is the Max Min Delta Indicator? The Max Min Delta Indicator is a powerful market volume analysis tool that visually represents maximum and minimum delta values using a histogram. It helps traders identify market strength, weakness, absorption, and aggressive buying/selling activity with precision. Key Features Histogram Visualization: Displays Max Delta (Green) an
Volume Candle Indicator
Pablo Filipe Soares De Almeida
MetaTrader 5용 볼륨 컬러 히스토그램 지표 이 지표는 거래량을 별도의 창에 히스토그램 형태로 표시합니다. 각 막대는 캔들의 방향에 따라 색상이 지정되며, 종가가 시가보다 높을 경우 초록색(상승 추세), 낮을 경우 빨간색(하락 추세)으로 표시됩니다. 색상 변화를 통해 거래자는 가격 움직임과 거래량 간의 관계를 직관적으로 파악할 수 있습니다. 주요 기능 거래량 소스: 틱 볼륨 또는 실제 거래량 선택 가능. 거래량 히스토그램 위에 이동 평균선을 추가할 수 있으며, 이를 통해 거래량의 흐름을 부드럽게 시각화할 수 있습니다. 지원되는 평균 유형: SMA, EMA, SMMA, LWMA. 평균 기간은 사용자가 직접 설정 가능. 모든 종목과 차트 주기에서 완벽하게 호환되며, MetaTrader 5 플랫폼에서 안정적으로 작동합니다. 시각적으로 명확한 디자인으로 거래 결정에 필요한 정보를 빠르게 이해할 수 있습니다.
Donchian Time Sync Analyzer는   기존 Donchian 채널 분석에 강력한   다중 시간대   기능을 추가하여 트레이더가 다섯 가지 차트 기간에 걸쳐   추세 강도   와 잠재적   반전 신호를   동시에 모니터링할 수 있도록 합니다. 이 고급 지표는 선택한 시간대의 최고가와 최저가를 계산하여 여러 시간대에 걸쳐 추세 방향의 수렴을 파악하는 데 도움이 되는   명확한 시각적 신호를   생성합니다. 분 단위부터 시간 단위까지 통합된 분석을 제공함으로써 단일 시간대 도구보다 더 심층적인 시장 통찰력을 제공하여 트레이더가   중요한 돌파를 확인   하고 시간대 확인을 통해   잘못된 신호를 피할 수 있도록   지원합니다. 핵심 기능 이 정교한 도구는 검증된   돈키안 채널 전략을   여러 시간대에 걸쳐 동시에 적용하여 단기 가격 변동이 장기 추세와 일치하는지 여부를 보여주는 동기화된 신호를 표시합니다. 이 시스템은 선택한 시간대에서 가격이 중요한 지지선 또는 저항선
DAILY OH/OL SDEV QUANT MODEL - STATISTICAL TRADING WITH PRECISION RISK MANAGEMENT TRADE WITH MATHEMATICAL CERTAINTY - KNOW YOUR EXACT STOP-LOSS AND TAKE-PROFIT BEFORE YOU ENTER This indicator analyzes 5,000+ days of price history to give you: Exact entry levels (sigma bands locked at daily open) Exact stop-loss distance (from M
CvdDeltaVolumes
Parasbhai N Patel
Delta + CVD & CVD Candles Order-flow indicator combining Delta (Ask–Bid), Cumulative Volume Delta (CVD), and a unique CVD-based synthetic candle system. Shows buy/sell pressure, volume aggressiveness, and momentum shifts with optional Delta histogram, CVD line, and CVD+Delta combined candles. Useful for scalping, intraday trading, divergence detection, and understanding buyer/seller dominance. Overview The Delta + CVD & CVD Candles Indicator combines multiple order-flow tools into one clean
표시기는 현재 시세를 작성하여 과거 시세와 비교할 수 있으며 이를 바탕으로 가격 변동을 예측합니다. 표시기에는 원하는 날짜로 빠르게 이동할 수 있는 텍스트 필드가 있습니다. 옵션: 기호 - 표시기가 표시할 기호 선택. SymbolPeriod - 지표가 데이터를 가져올 기간 선택. IndicatorColor - 표시기 색상. HorisontalShift - 지시자가 그린 따옴표를 지정된 막대 수만큼 이동합니다. Inverse - true는 인용 부호를 반대로, false - 원래 보기를 반전합니다. ChartVerticalShiftStep - 차트를 수직으로 이동합니다(키보드의 위/아래 화살표). 다음은 날짜를 입력할 수 있는 텍스트 필드의 설정으로, '엔터'를 누르면 즉시 이동할 수 있습니다.
HMA Trend Professional MT5
Pavel Zamoshnikov
4.25 (4)
Improved version of the free HMA Trend indicator (for MetaTrader 4) with statistical analysis. HMA Trend is a trend indicator based on the Hull Moving Average (HMA) with two periods. HMA with a slow period identifies the trend, while HMA with a fast period determines the short-term movements and signals in the trend direction. The main differences from the free version: Ability to predict the probability of a trend reversal using analysis of history data. Plotting statistical charts for analyzi
Volume Delta Candle
Muhammad Muzaffar Hussan
Volume Delta Candles: A Comprehensive Tool for In-Depth Trading Analysis Unlock a seamless way to interpret trading experience within each candle. With Volume Delta Candles, there's no need for additional volume indicators—everything you need is built in. This advanced tool utilizes lower timeframes or live market data to present the percentage of buying versus selling volume within each candle as an intuitive color-coded bar. Before diving in, ensure you’re familiar with Volume and Volume Delta
Trade smarter, not harder: Empower your trading with Harmonacci Patterns This is arguably the most complete harmonic price formation auto-recognition indicator you can find for the MetaTrader Platform. It detects 19 different patterns, takes fibonacci projections as seriously as you do, displays the Potential Reversal Zone (PRZ) and finds suitable stop-loss and take-profit levels. [ Installation Guide | Update Guide | Troubleshooting | FAQ | All Products ] It detects 19 different harmonic pri
Here is a highly professional, high-converting product description for the Propfolio Auto Gann Zones indicator. This highlights its mathematical precision, clean UI, and advanced auto-mitigation features. MQL5 Product Description Title: Propfolio Auto Gann Zones (MTF & Auto-Mitigating) Description: Gann Theory is one of the most powerful ways to identify market reversals, but drawing the zones manually across multiple timeframes is tedious, subjective, and clutters your charts. The Propfolio Aut
Premium level Pro
Dmitriy Kashevich
Premium level is a unique indicator with more than 80% accuracy of correct predictions! This indicator has been tested for more than two months by the best Trading Specialists! The author's indicator you will not find anywhere else! From the screenshots you can see for yourself the accuracy of this tool! 1 is great for trading binary options with an expiration time of 1 candle. 2 works on all currency pairs, stocks, commodities, cryptocurrencies Instructions: As soon as the red arrow app
Buy Sell Smart
Syamsurizal Dimjati
BUY and SELL smart The BUY and SELL Smart Indicator is a next-generation trading tool engineered for precision scalpers, intraday strategists, and professional analysts who demand both speed and clarity in market visualization. It seamlessly integrates smart candle-based analytics, adaptive ATR logic, and real-time economic event awareness — giving you a fully synchronized view of market volatility and momentum. Through an elegant and optimized interface, FlashScalp delivers   instant signal fee
This indicator is the same as the popular Heiken Ashi Smoothed. The Heikin Ashi indicator for MetaTrader 5 already exists, but it has two disadvantages: It paints the candles not accurate. It's not possible to change the candle width. See also Heikin Ashi in MQL5 Code Base . In this version there are no such disadvantages.
Crash 1000 Scalping Indicator for the Crash 1000 Deriv Synthetic Index. Introduction The Crash 1000 Scalping Indicator is a specialized tool designed for the Crash 1000 index on the Deriv Synthetic market. This indicator is particularly useful for scalping on the M1 timeframe, helping traders to identify precise entry and exit points for buy positions. It is designed to be non-repainting, providing clear signals with audible alerts and push notifications, and is compatible with mobile devices th
# DRAWDOWN INDICATOR V4.0 - The Essential Tool to Master Your Trading ## Transform Your Trading with a Complete Real-Time Performance Overview In the demanding world of Forex and CFD trading, **knowing your real-time performance** isn't a luxury—it's an **absolute necessity**. The **Drawdown Indicator V4.0** is much more than a simple indicator: it's your **professional dashboard** that gives you a clear, precise, and instant view of your trading account status. --- ## Why This Indicator
MultiTimeframe Support and Resistance Zones
Mohamed Gamal Abdelnasser Yous Hashesh
A powerful indicator that highlights key market zones and helps traders identify potential opportunities across multiple timeframes. Designed for clarity and efficiency, it provides real-time alerts to keep you informed of important price levels. Key Features: Works on multiple timeframes: M1, M5, M15, M30, H1, H4, D1, W1, MN1. Customizable zone colors for each timeframe. Real-time alerts and notifications when price reaches significant zones. Automatically manages chart objects to keep your wor
Cumulative Volume Delta (CVD) MA-X: 지능형 오더 플로우 센티먼트 도구 Cumulative Volume Delta (CVD) MA-X 를 통해 시장의 숨겨진 메커니즘을 파악해 보세요. 일반적인 거래량 지표는 '얼마나' 거래되었는지만 알려주지만, CVD MA-X는 누가 구매자와 판매자 사이의 전투에서 승리하고 있는지, 그리고 그 시점이 언제 인지 알려줍니다. 틱(Tick) 단위의 가격 액션과 거래량 분포를 집계하여 시장의 확신과 고갈 지점을 명확한 지도로 제공합니다. 트레이더의 우위: 왜 CVD MA-X인가? 대부분의 트레이더가 실패하는 이유는 가격 후행성에 반응하기 때문입니다. CVD MA-X는 거래량에 가중치를 둔 캔들의 내부 압력(꼬리 대비 몸통 비율)을 분석하여 **선행적 우위(Leading Edge)**를 제공합니다. 실시간으로 세 가지 핵심 질문에 답합니다: 이 움직임은 실제 자금에 의해 뒷받침되는가? (CVD/제로 라인 정렬) 트렌드가 힘을 잃
이 제품의 구매자들이 또한 구매함
SuperScalp Pro
Van Minh Nguyen
4.72 (18)
SuperScalp Pro – 고급 다중 필터 스캘핑 인디케이터 시스템 SuperScalp Pro는 클래식 Supertrend와 여러 지능형 확인 필터를 결합한 고급 스캘핑 인디케이터 시스템입니다. 해당 인디케이터는 M1부터 H4까지 모든 타임프레임에서 효율적으로 작동하며, 특히 XAUUSD, BTCUSD 및 주요 외환 통화쌍에 적합합니다. 독립형 시스템으로 사용하거나 기존 거래 전략에 유연하게 통합할 수 있습니다. 이 인디케이터는 11개 이상의 필터를 통합하며, 빠른/느린 EMA, 추세 판별용 3개의 EMA, EMA 기울기(EMA slope), RSI, ADX, 거래량(Volume), VWAP, 볼린저 밴드 돌파(Bollinger Bands Breakout) 및 MACD 다이버전스 필터 등을 포함합니다. 스마트 캔들 필터는 캔들 종가를 확인하여 약한 신호를 제거하고, 3 EMA와 MACD 다이버전스 필터를 결합한 추세 인식 메커니즘은 더 높은 승률의 신호를 선별하는 데 도움을 줍니
Power Candles MT5
Daniel Stein
5 (7)
Power Candles – 모든 시장을 위한 강도 기반 진입 신호 Power Candles 는 Stein Investments의 검증된 강도 분석을 가격 차트에 직접 제공합니다. 가격 움직임에만 반응하는 대신, 각 캔들은 실제 시장 강도를 기준으로 색상화되어 모멘텀 형성, 강도 가속, 명확한 추세 전환을 즉시 파악할 수 있습니다. 모든 시장을 위한 단일 로직 Power Candles는 모든 거래 심볼 에서 자동으로 작동합니다. 현재 심볼이 Forex인지 비-Forex 시장인지 자동으로 감지하여 내부적으로 적절한 강도 모델을 적용합니다. Forex 및 Gold 는 FX Power Delta 값을 사용합니다 (절대값 범위 최대 100) 지수, 크립토 및 CFD 는 IX Power Strength 값을 사용합니다 (절대값 범위 최대 50) 필요한 강도 계산은 Power Candles에 완전히 내장되어 있습니다. 캔들 색상이나 신호 로직을 위해 추가 인디케이터는 필요하지 않습니다. 가격
Azimuth Pro
Ottaviano De Cicco
5 (6)
LAUNCH PROMO Azimuth Pro price is initially set at 299$ for the first 100 buyers. Final price will be 499$ . THE DIFFERENCE BETWEEN RETAIL AND INSTITUTIONAL ENTRIES ISN'T THE INDICATOR — IT'S THE LOCATION. Most traders enter at arbitrary price levels, chasing momentum or reacting to lagging signals. Institutions wait for price to reach structured levels where supply and demand actually shift. Azimuth Pro maps these levels automatically: swing-anchored VWAP, multi-timeframe structure lines, an
Entry In The Zone and SMC Multi Timeframe is a real-time 2-in-1 market analysis tool that combines market structure analysis and a No Repaint BUY / SELL signal system into a single indicator, built on Smart Money Concepts (SMC) — a widely adopted framework used by professional traders to understand market structure. This indicator helps you see the market more clearly, make decisions based on structure rather than guesswork, and focus on high-probability zones where price is more likely to react
Divergence Bomber
Ihor Otkydach
4.9 (86)
이 지표를 구매하신 분께는 다음과 같은 혜택이 무료로 제공됩니다: 각 거래를 자동으로 관리하고, 손절/익절 수준을 설정하며, 전략 규칙에 따라 거래를 종료하는 전용 도우미 툴 "Bomber Utility" 다양한 자산에 맞게 지표를 설정할 수 있는 셋업 파일(Set Files) "최소 위험", "균형 잡힌 위험", "관망 전략" 모드로 설정 가능한 Bomber Utility의 셋업 파일 이 전략을 빠르게 설치, 설정, 시작할 수 있도록 돕는 단계별 영상 매뉴얼 주의: 위의 모든 보너스를 받기 위해서는 MQL5 개인 메시지 시스템을 통해 판매자에게 연락해 주세요. 독창적인 커스텀 지표인 “Divergence Bomber(다이버전스 봄버)”를 소개합니다. 이 지표는 MACD 다이버전스(괴리) 전략을 기반으로 한 올인원(All-in-One) 거래 시스템입니다. 이 기술 지표의 주요 목적은 가격과 MACD 지표 간의 다이버전스를 감지하고, **향후 가격이 어느 방향으로 움직일지를 알려주는
OmniSync Projection
Antonio-alin Teculescu
5 (1)
Chronos Fractal Engine is an innovative price projection indicator for MetaTrader 5, designed to transform your technical analysis by intelligently identifying and projecting historical price patterns. Built upon an advanced correlation algorithm and the fractal principles of the market, this powerful tool visualizes potential future price movements, giving you a unique edge in your trading decisions. What is Chronos Fractal Engine? At its core, the Chronos Fractal Engine employs a sophisticat
Meridian Pro
Ottaviano De Cicco
5 (1)
Meridian Pro: Professional Multi-Timeframe Trend Matrix for MT5 Overview Meridian Pro is a multi-timeframe trend matrix by Merkava Labs that compresses directional state, strength, momentum condition and matrix agreement into one compact panel. One adaptive engine, applied consistently from M1 to W1. No per-symbol tuning. No indicator stacking. One structured readout across every asset and every timeframe. Launch Offer — Get Meridian Pro for USD 99 (introductory). Regular price: USD 149. 1. Why
이 지표를 구매하면 제 프로페셔널 트레이드 매니저를 무료로 드립니다. 우선 이 거래 시스템이 리페인팅, 리드로잉 및 레이그 인디케이터가 아니라는 점을 강조하는 것이 중요합니다. 이는 수동 및 로봇 거래 모두에 이상적인 것으로 만듭니다. 온라인 강좌, 설명서 및 프리셋 다운로드. "스마트 트렌드 트레이딩 시스템 MT5"은 새로운 및 경험이 풍부한 트레이더를 위해 맞춤형으로 제작된 종합적인 거래 솔루션입니다. 10개 이상의 프리미엄 인디케이터를 결합하고 7개 이상의 견고한 거래 전략을 특징으로 하여 다양한 시장 조건에 대한 다목적 선택이 가능합니다. 트렌드 추종 전략: 효과적인 트렌드 추이를 타기 위한 정확한 진입 및 손절 관리를 제공합니다. 반전 전략: 잠재적인 트렌드 반전을 식별하여 트레이더가 범위 시장을 활용할 수 있게 합니다. 스캘핑 전략: 빠르고 정확한 데이 트레이딩 및 단기 거래를 위해 설계되었습니다. 안정성: 모든 인디케이터가 리페인팅, 리드로잉 및 레이그가 아니므로 신뢰
Trend Screener Pro MT5
STE S.S.COMPANY
4.85 (104)
트렌드 표시기, 트렌드 트레이딩 및 필터링을 위한 획기적인 고유 솔루션, 하나의 도구 안에 내장된 모든 중요한 트렌드 기능! Forex, 상품, 암호 화폐, 지수 및 주식과 같은 모든 기호/도구에 사용할 수 있는 100% 다시 칠하지 않는 다중 시간 프레임 및 다중 통화 표시기입니다. Trend Screener는 차트에 점이 있는 화살표 추세 신호를 제공하는 효율적인 지표 추세 추종 지표입니다. 추세 분석기 표시기에서 사용할 수 있는 기능: 1. 트렌드 스캐너. 2. 최대 이익 분석이 있는 추세선. 3. 추세 통화 강도 측정기. 4. 경고가 있는 추세 반전 점. 5. 경고가 있는 강력한 추세 점. 6. 추세 화살표 Trend Screener Indicator가 있는 일일 분석 예, 일일 신호 성능...등은 여기에서 찾을 수 있습니다. 여기를 클릭하십시오. LIMITED TIME OFFER : Trend Screener Indicator는 50$ 및 평생 동안만 사용할 수 있습니다.
FX Trend MT5 NG
Daniel Stein
5 (4)
FX Trend NG: 차세대 멀티 마켓 트렌드 인텔리전스 개요 FX Trend NG 는 다중 시간 프레임 기반의 전문 트렌드 분석 및 시장 모니터링 도구입니다. 몇 초 만에 전체 시장 구조를 파악할 수 있도록 설계되었습니다. 여러 차트를 일일이 전환할 필요 없이, 어떤 종목이 추세에 있는지, 어디에서 모멘텀이 약화되고 있는지, 그리고 어떤 시간 프레임이 서로 정렬되어 있는지 즉시 확인할 수 있습니다. 출시 기념 특별 혜택 – FX Trend NG 를 $30 (6개월) 또는 $80 평생 라이선스 로 이용할 수 있습니다. 이미 Stein Investments 고객이신가요? -> 메시지를 보내 전용 고객 그룹에 참여하세요. 설정이나 사용 방법이 필요하신가요? -> Stein Investments 공식 페이지 를 방문하세요. 1. FX Trend NG가 특별한 이유 3단계 추세 로직 – 단순한 Buy / Sell이 아닙니다 • 대부분의 지표는 Buy 또는 Sell 두 가지 상태만 제
Quantum TrendPulse
Bogdan Ion Puscasu
5 (22)
SuperTrend   ,   RSI   ,   Stochastic   의 힘을 하나의 포괄적인 지표로 결합하여 트레이딩 잠재력을 극대화하는 궁극의 트레이딩 도구   인 Quantum TrendPulse를   소개합니다. 정밀성과 효율성을 추구하는 트레이더를 위해 설계된 이 지표는 시장 추세, 모멘텀 변화, 최적의 진입 및 종료 지점을 자신 있게 식별하는 데 도움이 됩니다. 주요 특징: SuperTrend 통합:   주요 시장 추세를 쉽게 따라가고 수익성의 물결을 타세요. RSI 정밀도:   매수 과다 및 매도 과다 수준을 감지하여 시장 반전 시점을 파악하는 데 적합하며 SuperTrend 필터로 사용 가능 확률적 정확도:   변동성이 큰 시장에서 숨겨진 기회를 찾기 위해 확률적 진동   을 활용하고 SuperTrend의 필터로 사용 다중 시간대 분석:   M5부터 H1 또는 H4까지 다양한 시간대에 걸쳐 시장을 최신 상태로 유지하세요. 맞춤형 알림:   맞춤형 거래 조건이 충족되면
Btmm state engine pro
Garry James Goodchild
5 (3)
BTMM State Engine Pro is a MetaTrader 5 indicator for traders who use the Beat The Market Maker approach: Asian session context, kill zone timing, level progression, peak formation detection, and a multi-pair scanner from a single chart. It combines cycle state logic with a built-in scanner dashboard so you do not need the same tool on many charts at once. What it does Draws the Asian session range; session times can follow broker server offset or be set in inputs. Tracks level progression (L
Trend indicator AI mt5
Ramil Minniakhmetov
5 (16)
트렌드 인공 지능 지표는 실행 가능한 진입 점 및 반전 경고와 추세 식별을 결합하여 상인의 시장 분석을 향상시킬 훌륭한 도구입니다. 이 표시기는 사용자가 자신감과 정밀도로 외환 시장의 복잡성을 탐색 할 수 있도록 지원합니다 기본 신호 외에도 트렌드 인공 지능 지표는 풀백 또는 되돌림 중에 발생하는 2 차 진입 점을 식별하여 거래자가 기존 트렌드 내에서 가격 수정을 활용할 수 있도록합니다. 중요한 장점: ·작동 4 및 5 *명확한 구매 또는 판매 신호 *다시 칠하지 않습니다 *모든 자산에서 작동 나는 전보 사기에 개 또는 세트를 판매하지 않도록주의. 모든 설정은 블로그에 여기에 무료.  중요! 지침 및 보너스를 얻기 위해 구입 후 즉시 저에게 연락! 진짜 가동 감시는 뿐 아니라 나의 다른 제품 여기에서 찾아낼 수 있습니다: https://www.mql5.com/en/users/mechanic/seller&nbsp ; 설정 및 입력: 모든 자산에 대해 기본 설정을 권
Gann Made Easy MT5
Oleg Rodin
5 (2)
Gann Made Easy 는 mr.의 이론을 사용하여 최고의 거래 원칙을 기반으로 하는 전문적이고 사용하기 쉬운 Forex 거래 시스템입니다. W.D. 간. 이 표시기는 Stop Loss 및 Take Profit Levels를 포함하여 정확한 BUY 및 SELL 신호를 제공합니다. PUSH 알림을 사용하여 이동 중에도 거래할 수 있습니다. 구매 후 거래 방법 안내 및 유용한 추가 지표를 무료로 받으시려면 저에게 연락주세요! 아마도 Gann 거래 방법에 대해 이미 여러 번 들었을 것입니다. 일반적으로 Gann의 이론은 초보자 거래자뿐만 아니라 이미 거래 경험이 있는 사람들에게도 매우 복잡한 것입니다. Gann의 거래 방식은 이론적으로 적용하기 쉽지 않기 때문입니다. 나는 그 지식을 연마하고 Forex 지표에 최고의 원칙을 적용하기 위해 몇 년을 보냈습니다. 표시기는 적용하기가 매우 쉽습니다. 차트에 첨부하고 간단한 거래 권장 사항을 따르기만 하면 됩니다. 지표는 지속적으로 시장 분석
Crystal Heikin Ashi Signals
Muhammad Jawad Shabir
5 (2)
Crystal Heikin Ashi Signals - Professional Trend & Signal Detection Indicator Advanced Heikin Ashi Visualization with Intelligent Signal System for Manual & Automated Trading Final Price: $149 ---------> Price goes up $10 after every 10 sales . Limited slots available — act fast . Overview Crystal Heikin Ashi Signals is a professional-grade MetaTrader 5 indicator that combines pure Heikin Ashi candle visualization with an advanced momentum-shift detection system. Designed for both manual traders
RFI levels PRO MT5
Roman Podpora
3.67 (3)
이 지표는 추세 반전 지점과 가격 반등 영역을 정확하게 보여줍니다.       주요 투자자들   . 새로운 트렌드가 형성되는 곳을 파악하고 최대한 정확하게 의사결정을 내리며 모든 거래를 완벽하게 통제합니다. TREND LINES PRO   지표와 함께 사용할 때 최대의 잠재력을 발휘합니다.  VERSION MT4 지표가 보여주는 내용: 새로운 추세의 시작 시 활성화되는 반전 구조 및 반전 수준. 최소한의 위험 대비 수익률을 갖는 이익 실현   (TAKE PROFIT)   및   손절매(STOP LOSS)   레벨 표시       RR 1:2   . 지능형 손실 감소 로직이 적용된 손절매 기능. 지정된 지표에서 두 가지 추세 유형에 대한 반전 패턴을 표시합니다. 지표: 트렌드를 따라   트렌드 라인 프로   (글로벌 트렌드 변화) 트렌드 프로   (빠른 트렌드 변화) 간단하고 효과적입니다       스캐너       실시간 추세 (신규). 다중 시간 프레임 도구 필터링. 표시하다  
Power Bar MT5
Daniel Stein
실제 자금을 투입하기 전에 어떤 전략이 내 심볼에서 효과적인지 확인하세요. Power Bar는 모든 심볼과 모든 타임프레임에서 극단적인 가격 바 를 감지한 다음, 3가지 다른 트레이딩 전략을 즉시 백테스트하여 승률, 수익 팩터, 손익을 나란히 비교할 수 있습니다. 모든 것이 하나의 인터랙티브 패널에 담겨 있습니다. 추측 없음. 커브 피팅 없음. 오직 데이터뿐입니다. Power Bar가 특별한 이유 대부분의 인디케이터는 신호를 주고 그것이 효과가 있는지는 추측에 맡깁니다. Power Bar는 한 걸음 더 나아갑니다 - 모든 신호를 세 가지 전략 에 대해 테스트하고 통계를 보여줍니다. FlipFlop, Momentum, Reversal을 원클릭으로 전환하고 숫자가 즉시 변하는 것을 확인하세요. FlipFlop - 항상 포지션 유지. 신호에 진입하고, 반대 신호에 청산. 당사의 연구에 따르면 US30, US500, DAX와 같은 추세가 있는 지수에서 가장 효과적입니다. Momentum
Atomic Analyst MT5
Issam Kassas
3.94 (31)
우선적으로 언급할 점은이 거래 지표가 다시 그리지 않고 지연되지 않으며 이를 통해 수동 및 로봇 거래 모두에 이상적이라는 점입니다. 사용자 매뉴얼: 설정, 입력 및 전략. Atomic Analyst는 가격의 강도와 모멘텀을 활용하여 시장에서 더 나은 이점을 찾는 PA Price Action Indicator입니다. 고급 필터를 장착하여 잡음과 거짓 신호를 제거하고 거래 잠재력을 높이는 데 도움이 됩니다. 복잡한 지표의 다중 레이어를 사용하여 Atomic Analyst는 차트를 스캔하고 복잡한 수학적 계산을 간단한 신호와 색상으로 변환하여 초보 트레이더가 이해하고 일관된 거래 결정을 내릴 수 있도록합니다. "Atomic Analyst"는 새로운 및 경험이 풍부한 트레이더를위한 종합적인 거래 솔루션입니다. 프리미엄 지표와 최고 수준의 기능을 하나의 거래 전략에 결합하여 모든 종류의 트레이더에 대한 다재다능한 선택지가되었습니다. 인트라데이 거래 및 스캘핑 전략 : 빠르고 정확한 일일
우선적으로, 이 거래 도구는 전문적인 거래에 이상적인 비-다시 그리기 및 지연되지 않는 지표입니다.  온라인 강좌, 사용자 매뉴얼 및 데모. 스마트 가격 액션 컨셉트 인디케이터는 신규 및 경험 많은 트레이더 모두에게 매우 강력한 도구입니다. Inner Circle Trader Analysis 및 Smart Money Concepts Trading Strategies와 같은 고급 거래 아이디어를 결합하여 20가지 이상의 유용한 지표를 하나로 결합합니다. 이 인디케이터는 스마트 머니 컨셉트에 중점을 두어 대형 기관의 거래 방식을 제공하고 이동을 예측하는 데 도움을 줍니다.  특히 유동성 분석에 뛰어나 기관이 어떻게 거래하는지 이해하는 데 도움을 줍니다. 시장 트렌드를 예측하고 가격 변동을 신중하게 분석하는 데 탁월합니다. 귀하의 거래를 기관 전략에 맞추어 시장의 동향에 대해 더 정확한 예측을 할 수 있습니다. 이 인디케이터는 시장 구조를 분석하고 중요한 주문 블록을 식별하고 다양
Auto Optimized Parabolic RSI: 고급 3D 모멘텀 엔진 대부분의 개인 투자자용 보조지표는 시장의 변동성이 변하는 순간 무용지물이 되는 정적인 입력값에 의존하기 때문에 실패합니다. Auto Optimized Parabolic RSI는 자체적인 수학적 우위를 지속적으로 재계산하여 "보조지표 노후화" 문제를 해결하며, 기관급 퀀트 트레이딩의 적응력을 귀하의 MT5 터미널에 직접 제공합니다. 핵심 이점: 맞춤형 인메모리 3D 최적화 표준 자동 최적화 도구들은 일반적인 보조지표 호출로 터미널에 과부하를 일으켜 MT5 플랫폼을 멈추게 하는 경우가 많습니다. 이 도구는 이러한 병목 현상을 완전히 우회합니다. 맞춤형 네이티브 RAM 기반 계산기로 구축된 내부 엔진은 차트를 로드하거나 타임프레임을 변경할 때마다 빛처럼 빠른 3D 그리드 검색을 실행합니다. RSI 기간(주기), SAR 스텝(가속도) 및 SAR 최대치(속도 제한)를 동시에 스캔하여 플랫폼 지연 없이 수만 개의 파라
RelicusRoad Pro MT5
Relicus LLC
5 (24)
RelicusRoad Pro: 퀀트 시장 운영 체제 70% 할인 평생 이용권 (한정 시간) - 2,000명 이상의 트레이더와 함께하세요 왜 대부분의 트레이더는 "완벽한" 지표를 가지고도 실패할까요? 진공 상태에서 단일 개념 만으로 거래하기 때문입니다. 문맥 없는 신호는 도박입니다. 지속적인 승리를 위해서는 컨플루언스(중첩) 가 필요합니다. RelicusRoad Pro는 단순한 화살표 지표가 아닙니다. 완전한 퀀트 시장 생태계 입니다. 독점적인 변동성 모델링을 사용하여 가격이 이동하는 "공정 가치 로드"를 매핑하고, 단순 노이즈와 실제 구조적 돌파를 구분합니다. 추측은 그만두세요. 기관급 로드 로직으로 거래를 시작하세요. 핵심 엔진: "Road" 알고리즘 시스템의 중심에는 시장 상황에 실시간으로 적응하는 동적 변동성 채널인 Road Algo 가 있습니다. 세이프 라인(평형) 과 가격이 수학적으로 반전될 가능성이 높은 확장 레벨 을 투영합니다. Simple Road: 일반적인 시장을 위
FX Power MT5 NG
Daniel Stein
5 (31)
FX Power: 통화 강세 분석으로 더 스마트한 거래 결정을 개요 FX Power 는 어떤 시장 상황에서도 주요 통화와 금의 실제 강세를 이해하기 위한 필수 도구입니다. 강한 통화를 매수하고 약한 통화를 매도함으로써 FX Power 는 거래 결정을 단순화하고 높은 확률의 기회를 발견합니다. 트렌드를 따르거나 극단적인 델타 값을 사용해 반전을 예측하고자 한다면, 이 도구는 귀하의 거래 스타일에 완벽히 적응합니다. 단순히 거래하지 말고, FX Power 로 더 스마트하게 거래하세요. 1. FX Power가 거래자에게 매우 유용한 이유 통화와 금의 실시간 강세 분석 • FX Power 는 주요 통화와 금의 상대적 강세를 계산하고 표시하여 시장 역학에 대한 명확한 통찰력을 제공합니다. • 어떤 자산이 앞서고 있고 어떤 자산이 뒤처지는지 모니터링하여 보다 현명한 거래 결정을 내릴 수 있습니다. 포괄적인 멀티 타임프레임 뷰 • 단기, 중기 및 장기 타임프레임에서 통화와 금의 강세를
Bill Williams Advanced
Siarhei Vashchylka
5 (11)
Bill Williams Advanced is designed for automatic chart analysis using Bill Williams' "Profitunity" system. The indicator analyzes four timeframes at once. Manual (Be sure to read before purchasing) Advantages 1. Analyzes the chart using Bill Williams' "Profitunity" system. Signals are displayed in a table in the corner of the screen and on the price chart. 2. Finds all known AO and AC signals, as well as zone signals. Equipped with a trend filter based on the Alligator. 3. Finds "Divergence Bar
Currency Strength Dashboard Pro
Anastasia Danilova
5 (1)
Currency Strength Dashboard Pro MetaTrader 5 를 위한 실시간 통화 강도 분석 전문 대시보드 입니다. 이 지표는 8개의 주요 통화 (EUR, USD, GBP, JPY, CHF, AUD, CAD, NZD)의 강도를 계산하고, 28개의 통화쌍 을 동시에 여러 시간 프레임에서 분석하여 표시합니다. 이 대시보드는 트레이더가 추가 계산이나 여러 차트 간 전환 없이 한눈에 시장 전체 상황을 파악 할 수 있도록 해줍니다. 계산 방법 이 지표는 고급 수학적 통화 강도 분석 방법 을 기반으로 합니다. 이는 유사한 지표에서 널리 사용되는 RSI 기반 방법 보다 더 정확하고 객관적인 결과를 제공합니다. 이 방법은 28개의 모든 통화쌍 간의 관계를 동시에 분석 하여 시장에서 실제로 형성되는 힘의 균형을 보다 명확하고 편향 없이 보여줍니다. 실시간 대시보드 메인 테이블에는 8개의 통화 에 대한 전체 데이터가 표시됩니다. Rank (순위) — 전체 강도 기준 통화 순위, 1
CGE Trading Suite
Carl Gustav Johan Ekstrom
5 (1)
CGE Trading Suite delivers the analytical edge typically reserved for professional trading desks. The platform integrates a full suite of analytical tools into one seamless workflow: dynamic grid mapping, liquidity behavior analysis, ECM, trend lines, MIDAS, trade cycles, and directional channel projections. Together, these provide a unified view of market structure and momentum. Directional clarity is further enhanced by the capital flow index, which measures currency basket strength to identif
Trend Lines PRO MT5
Roman Podpora
5 (1)
트렌드 라인즈 프로       이 지표는 시장이 실제로 어떤 방향으로 전환되는지 파악하는 데 도움이 됩니다. 실제 추세 반전 지점과 주요 시장 참여자들이 다시 진입하는 지점을 보여줍니다. 보시다시피       BOS 라인       복잡한 설정이나 불필요한 노이즈 없이 더 높은 시간대의 추세 변화와 주요 레벨을 확인할 수 있습니다. 신호는 차트에 다시 그려지지 않고 캔들이 마감된 후에도 계속 표시됩니다. MT4 버전   -   RFI LEVELS PRO   표시기   와 결합 시 최대 잠재력을 발휘합니다. 지표가 보여주는 내용: 실제 변화       추세(BOS 라인) 한 번 신호가 나타나면 그 신호는 계속 유효합니다! 이는 신호를 발생시킨 후 변경될 수 있는 리페인팅 방식의 지표와 중요한 차이점입니다. 리페인팅 방식의 지표는 잠재적으로 자금 손실로 이어질 수 있습니다. 이제 더욱 높은 확률과 정확도로 시장에 진입할 수 있습니다. 또한 화살표가 나타난 후 목표가(익절)에 도달하거나
ARIPoint
Temirlan Kdyrkhan
ARIPoint is a powerful trading companion designed to generate high-probability entry signals with dynamic TP/SL/DP levels based on volatility. Built-in performance tracking shows win/loss stats, PP1/PP2 hits, and success rates all updated live. Key Features: Buy/Sell signals with adaptive volatility bands Real-time TP/SL/DP levels based on ATR Built-in MA Filter with optional ATR/StdDev volatility Performance stats panel (Success, Profit/Loss, PP1/PP2) Alerts via popup, sound, push, or email Cu
Berma Bands
Muhammad Elbermawi
5 (8)
Berma Bands(BBs) 지표는 시장 동향을 파악하고 이를 활용하려는 트레이더에게 귀중한 도구입니다. 가격과 BBs 간의 관계를 분석함으로써 트레이더는 시장이 추세 단계인지 범위 단계인지를 분별할 수 있습니다. 자세한 내용을 알아보려면 [ Berma Home Blog ]를 방문하세요. 버마 밴드는 세 개의 뚜렷한 선으로 구성되어 있습니다. 어퍼 버마 밴드, 미들 버마 밴드, 로어 버마 밴드입니다. 이 선들은 가격 주위에 그려져 전체 추세에 대한 가격 움직임을 시각적으로 표현합니다. 이 밴드들 사이의 거리는 변동성과 잠재적인 추세 반전에 대한 통찰력을 제공할 수 있습니다. 버마 밴드 라인이 각각에서 분리될 때, 그것은 종종 시장이 횡보 또는 범위 이동 기간에 접어들고 있음을 시사합니다. 이는 명확한 방향 편향이 없음을 나타냅니다. 트레이더는 이러한 기간 동안 추세를 파악하기 어려울 수 있으며 더 명확한 추세가 나타날 때까지 기다릴 수 있습니다. 버마 밴드 라인이 단일 라인으로
Advanced Supply Demand MT5
Bernhard Schweigert
4.53 (15)
현재 33% 할인! 초보자나 전문 트레이더를 위한 최고의 솔루션! 이 보조지표는 우리가 다수의 독창적 기능과 새로운 공식을 통합한 독특하고 고품질이며 저렴한 거래 도구입니다. 이 업데이트를 통해 이중 시간대를 표시할 수 있습니다. 더 높은 TF를 표시할 수 있을 뿐만 아니라 차트 TF와 더 높은 TF 모두를 표시할 수 있습니다: 중첩 영역 표시. 모든 Supply Demand 트레이더들이 좋아할 것입니다. :) 중요한 정보 공개 Advanced Supply Demand의 잠재력을 극대화하려면 다음을 방문하십시오. https://www.mql5.com/ko/blogs/post/720245   진입 또는 목표의 명확한 트리거 포인트를 정확히 찾아냄으로 해서 거래가 어떻게 개선될지 상상해 보십시오. 새로운 알고리즘을 기반으로 매수자와 매도자 간의 잠재적인 불균형을 훨씬 더 쉽게 분간할 수 있습니다. 왜냐하면 가장 강한 공급영역과 가장 강한 수요 영역과 과거에 어떻게 진행 되었는지를(이전
PZ Trend Trading MT5
PZ TRADING SLU
3.8 (5)
Capture every opportunity: your go-to indicator for profitable trend trading Trend Trading is an indicator designed to profit as much as possible from trends taking place in the market, by timing pullbacks and breakouts. It finds trading opportunities by analyzing what the price is doing during established trends. [ Installation Guide | Update Guide | Troubleshooting | FAQ | All Products ] Trade financial markets with confidence and efficiency Profit from established trends without getting whip
제작자의 제품 더 보기
SuperTrend MultiTF
Salman Soltaniyan
A powerful trend-following tool that uses ATR-based volatility to identify market trends across multiple timeframes . This enhanced version allows you to overlay the SuperTrend of a higher timeframe directly on your current chart, helping you align your trades with the dominant trend. How It Works The indicator calculates dynamic support and resistance levels using Average True Range (ATR) : Upper Band = Source Price + (Multiplier × ATR) Lower Band = Source Price - (Multiplier × ATR) In an uptre
Product Overview The Simple Telegram Copy Trader is a FREE unified Expert Advisor that combines both Master and Slave functionality in a single EA with easy mode switching. This simplified version focuses on OPEN TRADES ONLY , making it perfect for basic copy trading setups without the complexity of advanced features. Get professional-grade copy trading with complete lifecycle management: Telegram Signal Broadcaster MT5 (Master)   Telegram Signal Subscriber MT5 (Slave) Key Features Unified Des
FREE
Create a new custom symbol based on average of Multiple arbitrary symbols (for MT5) An Expert Advisor (EA) used to create custom symbol by averaging multiple input symbols (e.g. EURUSD and GBPUSD)  and provide real-time updates. This is an MT4 "offline" chart equivalent which is very simple to use. You can attach any MT5 compatible indicator or template to  this new symbol and perform your technical analysis. You can back-test any EA on this new custom symbol in strategy tester. for example y
It's a trading dashboard appears on strategy tester, allows you to backtest your own strategies, testing them on multiple symbols and timeframes. It is equipped with useful features such as risk management, trailing stops, breakeven points, and more, enabling you to evaluate and refine your strategies effectively. Trading panels are typically designed to facilitate real-time trading and may not function properly on a strategy tester. However, this particular trading panel is specifically designe
1. Method Overview Random Trader EA is an automated trading system for MetaTrader 5 that initiates trades with a randomly chosen buy or sell direction. Despite the random entry, the EA incorporates robust risk management, dynamic position sizing, and sophisticated exit strategies. This unique approach serves as a valuable tool for research, portfolio diversification, and as a foundational template for developing and evaluating risk management techniques within algorithmic trading. 2. Key Featur
OVERVIEW Transform your MT5 trading account into a professional signal broadcasting station! This Expert Advisor automatically publishes your trading activity to Telegram channels in real-time, enabling seamless copy trading operations.  SYSTEM NOTICE: This EA broadcasts trading signals TO Telegram channels. To receive and execute signals FROM Telegram, you need the companion EA: " Telegram Signal Subscriber MT5 " (sold separately). KEY FEATURES: Real-time trade broadcasting to Telegram Support
OVERVIEW Transform your MT5 trading account into an automated signal execution station! This Expert Advisor automatically receives and executes trading signals from Telegram channels in real-time, enabling seamless copy trading operations from master accounts. SYSTEM NOTICE: This EA receives and executes trading signals FROM Telegram channels. To broadcast signals TO Telegram, you need the companion EA: " Telegram Signal Broadcaster MT5 " (sold separately).  KEY FEATURES: Automated signal recept
필터:
리뷰 없음
리뷰 답변