ArchIntel Pivot Point

This tool draws all the pivot point lines on chart. It is important to remind/tell you that there are 5 pivot method according to BabyPips website. All these methods have their unique mathematical formula.

1. Floor Method.

2. Woodie Method.

3. Camarilla Method.

4. DeMark Method.

5. Fibonacci Method.

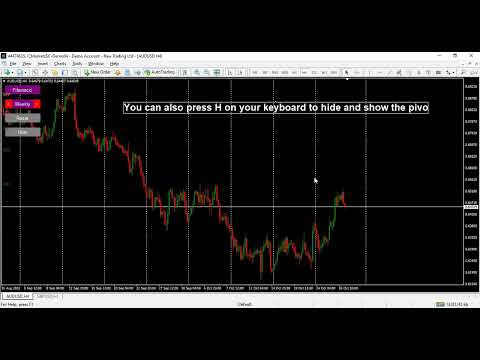
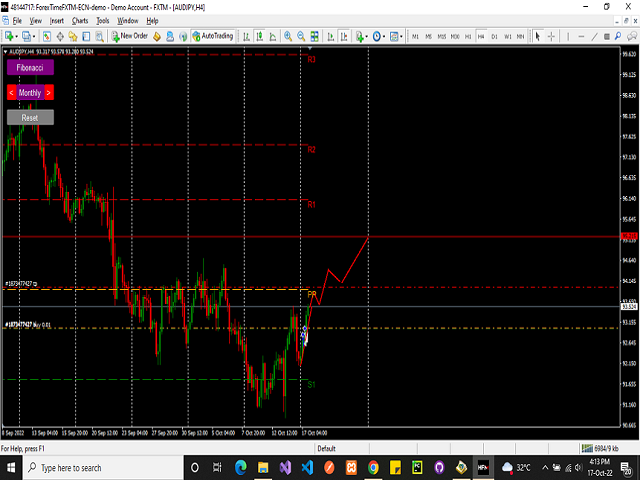
What makes this pivot tool unique is that you can click the "Fibonacci" button to select the pivot method you want. You can click the "Monthly" button to select the Period you want to use for the pivot calculation. If you click "<" it will go to history to draw pivot line, you can click ">" to come back to the current/latest day or week or month. Click reset to reinitialized the settings.

추천 제품
Classic Fractals indicator for MT4, with additional Trendlines connecting the latest couples of fractals ( fractals are showing highest high, and lowest low on each period) Rules for trendlines: -if new top fractal is below the last one = new resistance line -if new bot fractal is above the last one = new support line -Trendlines can be hidden -Fractals can be hidden Fractal Period = can be both even or uneven number, as it is setting for half (one side) of the bars sequence for findin
Supply Demand Zone Pro Indicator works with all products and timeframes. It is using a new calculation method, and now you can select the desired zone on any timeframe! Strongest Zones are already enabled by default This is a great advantage in trading.This indicator has a built in backtester enabled by default, just move the chart. Supply and Demand ? Supply is a price zone where sellers outnumbered buyers and drove the price lower. Demand is a price zone where buyers outnumbers sellers and dr
Reversals typically refer to large price changes, where the trend changes direction. Small counter-moves against the trend are called pullbacks or consolidations.When it starts to occur, a reversal isn't distinguishable from a pullback. A reversal keeps going and forms a new trend, while a pullback ends and then the price starts moving back in the trending direction. Difference Between a Reversal and a Pullback A reversal is a trend change in the price of an asset. A pullback is a counter-move w
Pivot Points MT4
KEENBASE SOFTWARE SOLUTIONS
KT Pivot Points는 최신 데이터를 기반으로 일간, 주간, 월간 피벗 레벨을 차트에 자동으로 표시합니다. 피벗 포인트는 외환 시장을 포함한 기술적 분석에서 널리 사용되는 지표입니다. 주요 기능 가격이 피벗 레벨에 도달하면 알림을 전송합니다.  각 피벗 레벨 종류별로 완전한 사용자 지정이 가능합니다.   일간, 주간, 월간 피벗 레벨을 깔끔하게 표시합니다. CPU 자원을 적게 사용하여 빠르게 계산됩니다. 차트상의 다른 지표들과 호환됩니다. 피벗 포인트란? 피벗 포인트는 전일의 고가, 저가, 종가의 평균을 이용하여 계산됩니다.  이 계산된 피벗 포인트를 기반으로 향후의 지지 및 저항 수준을 예측할 수 있으며, 이는 해당 수준 근처에서의 가격 움직임을 판단하는 데 도움이 됩니다. 일반적으로 가격이 피벗 포인트 위에서 거래되면 강세 심리를, 아래에서 거래되면 약세 심리를 나타냅니다. 피벗 계산식 피벗 레벨을 계산하기 위해 전일, 주간 또는 월간의 고가, 저가, 종가 데이터를
DoAid
Samuel Akinbowale
5 (1)
DoAid DoAid indicator is a simple channel indicator with an advance timeframe correlation board. DoAid indicator: can be used with any instrument provided by your broker and MetaTrader, be it Currency , Commodity ,Stock, or Cryptocurrencies. DoAid indicator   can be used for swing, scalping and day trading. DoAid indicator   is also a multi time-frame indicator {MTF}. DoAid indicator can be used with any timeframe. It does not repaint.It does not repaint. When To Buy if the market price is
Apollo BuySell Predictor 는 여러 거래 모듈을 포함하는 전문 거래 시스템입니다. 트레이더에게 고유한 브레이크아웃 영역, 피보나치 기반 지원 및 저항 수준, 피벗 추세선, 풀백 볼륨 신호 및 모든 트레이더가 매일 필요로 하는 기타 유용한 기능을 제공합니다. 시스템은 모든 쌍과 함께 작동합니다. 권장 시간 프레임은 M30, H1, H4입니다. 지표는 H4보다 높은 시간 프레임을 제외하고 다른 시간 프레임에서도 작동할 수 있습니다. 이 시스템은 모든 트레이더가 성공적인 거래에 필요한 모든 것을 제공하므로 보편적입니다. 이 시스템은 여러 가지 방법으로 사용할 수 있습니다. 데이 트레이딩, 스윙 트레이딩, 심지어 스캘핑까지 사용할 수 있습니다. 귀하가 선호하는 거래 스타일에 관계없이 시스템은 귀하가 시장을 실제 모습으로 볼 수 있도록 도와줄 것입니다. 모든 신호는 다시 칠하지 않고 지체하지 마십시오! 거래 기본 설정 및 작업에 따라 시스템의 다른 모듈을 켜거나 끌 수 있습
What is a Pivot? A pivot is a significant price level known in advance which traders view as important and may make trading decisions around that level. As a technical indicator, a pivot price is similar to a resistance or support level. If the pivot level is exceeded, the price is expected to continue in that direction. Or the price could reverse at or near that level. What does a Pivot Tell You? There are pivots and pivot points. These terms may mean different things to different people.
• Candle Length/Direction indicator •Show s the Length /direction of candle s : You can choose one of these two formulas to get the length/direction of candles in all time frames: 1- Open – Close 2- High – Low •Shows the Length of candles: It gives you a table showing the length of the candle of your choice in all time frames (in points). •Shows the Direction of candles: It uses color to indicate candles that are bullish (with positive points) or bearish (with negative points).   • Add candle sh
SMC Venom Model BPR 지표는 Smart Money(SMC) 개념 내에서 일하는 트레이더를 위한 전문 도구입니다. 가격 차트에서 두 가지 주요 패턴을 자동으로 식별합니다. FVG (공정 가치 갭)는 3개의 캔들의 조합으로, 첫 번째와 세 번째 캔들 사이에 갭이 있습니다. 이는 볼륨 지원이 없는 레벨 사이에 구역을 형성하여 종종 가격 수정으로 이어집니다. BPR (균형 가격 범위)은 두 개의 FVG 패턴의 조합으로, "브리지"를 형성합니다. 이는 가격이 낮은 볼륨 활동으로 움직일 때 브레이크아웃과 레벨로의 복귀 구역으로, 캔들 사이에 갭을 생성합니다. 이러한 패턴은 거래자가 차트에서 거래량과 가격 역학을 분석하여 주요 지지/저항 수준, 돌파 구역 및 진입 지점을 식별하는 데 도움이 되며, 여기서 대형 시장 참여자와 일반 참여자 간의 상호 작용이 발생합니다. 이 지표는 사각형과 화살표 형태로 패턴을 시각화하며 유연한 경고 설정도 지원합니다. 주요 특징: 패턴 표시 모드:
FiboZag
Andriy Sydoruk
Indicator FiboZag - transfer the indicator to the chart and the Fibonacci levels will be built automatically on the last ZigZag turn. The main advantage lies in the correct construction of Fibonacci levels and markup of price levels. Simple, visual and effective use. The indicator is not redrawn and does not lag. Works on all currency pairs and on all timeframes.
우리의 Basic Support and Resistance 표시기는 기술 분석을 향상시키는 데 필요한 솔루션입니다.이 표시기는 차트/ MT5 버전 특징 피보나치 수준의 통합 : 지원 및 저항 수준과 함께 피보나치 수준을 표시하는 옵션과 함께, 우리의 지표는 시장 행동과 가능한 역전 영역에 대한 더 깊은 통찰력을 제공합니다. 성능 최적화 : 각 막대의 개구부에서만 확장 라인을 업데이트하는 옵션을 사용하여, 우리의 지표는 지원 및 저항 수준의 정확도를 희생하지 않고 최적의 성능을 보장합니다. 입력 주요 설정 Timeframe:  이 입력을 통해 차트에 더 높은 기간의 지지선과 저항선을 표시하도록 선택할 수 있습니다. Support/Resistance Strength [Number of Bars]:  이 입력을 사용하면 지지대와 저항의 강도를 결정할 수 있습니다.숫자가 높을수록지지/저항이 더 강해집니다. Price mode: 이 매개 변수를 사용하면 지원 및 저항 수준을 계산하는
Set TP and SL like Financial Institutions Traders' TP expectations do not often occur and their SL often hits when they only rely on primitive indicators like pivot-points and Fibonacci or classic support or resistance areas. There are a variety of indicators for support/resistance levels, whereas they are seldom accurate enough. Classical support/resistance indicators, often present miss levels and are not noteworthy based on current market volatility dynamic. Fibonacci is good but not enough
Binary Option Signal
Yaroslav Varankin
Indicator for binary options arrow is easy to use and does not require configuration works on all currency pairs, cryptocurrencies buy signal blue up arrow sell signal red down arrow tips do not trade during news and 15-30 minutes before their release, as the market is too volatile and there is a lot of noise it is worth entering trades one or two candles from the current period (recommended for 1 candle) timeframe up to m 15 recommended money management fixed lot or fixed percentage of the depo
ChartGetSignal
Wartono
1 (1)
Provides instant signals on the chart in panel form. Equipped with signal description and trading analysis tools such as drawing auto trendlines, support/resistance area, regression channel, Fibonacci levels, Pivot levels and current signal price, signal time, signal expiry and stoploss recommendation. Also sending alert messages to all available mt4 alert tool. A detailed description panel provides information about where the signal comes from and what indicators are behind the signal. Includin
Forex Gump
Andrey Kozak
2.4 (5)
Forex Gump is a fully finished semi-automatic trading system. In the form of arrows, signals are displayed on the screen for opening and closing deals. All you need is to follow the instructions of the indicator. When the indicator shows a blue arrow, you need to open a buy order. When the indicator shows a red arrow, you need to open a sell order. Close orders when the indicator draws a yellow cross. In order to get the most effective result, we recommend using the timeframes H1, H4, D1. There
VR Cub
Vladimir Pastushak
VR Cub 은 고품질 진입점을 얻는 지표입니다. 이 지표는 수학적 계산을 용이하게 하고 포지션 진입점 검색을 단순화하기 위해 개발되었습니다. 지표가 작성된 거래 전략은 수년 동안 그 효율성을 입증해 왔습니다. 거래 전략의 단순성은 초보 거래자라도 성공적으로 거래할 수 있다는 큰 장점입니다. VR Cub은 포지션 개시 지점과 이익 실현 및 손절매 목표 수준을 계산하여 효율성과 사용 편의성을 크게 높입니다. 간단한 거래 규칙을 이해하려면 아래 전략을 사용한 거래 스크린샷을 살펴보세요. 설정, 세트 파일, 데모 버전, 지침, 문제 해결 등은 다음에서 얻을 수 있습니다. [블로그] 다음에서 리뷰를 읽거나 작성할 수 있습니다. [링크] 버전 [MetaTrader 5] 진입점 계산 규칙 포지션 개설 진입점을 계산하려면 VR Cub 도구를 마지막 최고점에서 마지막 최저점까지 늘려야 합니다. 첫 번째 지점이 두 번째 지점보다 빠른 경우, 거래자는 막대가 중간선 위에서 마감될 때까지 기다립니다
Smart Trendlines
Suvashish Halder
5 (1)
Smart Trendlines – No.1 Trendlines Indicator Smart Trendlines is a precision tool that automatically draws trendlines based on every valid pivot point, helping traders identify key support and resistance zones. It continuously adjusts as new market pivots form, providing a live and accurate reflection of price structure. Whether you’re tracking trends, preparing for reversals, or anticipating breakouts — this indicator keeps you one step ahead. It works seamlessly across all assets including For
Simple supply and demand indicator which should help identify and visualize S&D zones. Settings: Color for supply zones, color for demand zones - default colors are set for dark (black) background. Number of how much zones should be created above and below current price - value "3" means there will be 3 zones above current price and 3 zones below current price. Principle: When price creates "V", reversal zone is registered. Rectangle filled based on zone type (supply / demand) is drawn if price
The Th3Eng PipFinite indicator is based on a very excellent analysis of the right trend direction with perfect custom algorithms. It show the true direction and the best point to start trading. With StopLoss point and Three Take Profit points. Also it show the right pivot of the price and small points to order to replace the dynamic support and resistance channel, Which surrounds the price. And Finally it draws a very helpful Box on the left side on the chart includes (take profits and Stop loss
Introduction This indicator detects volume spread patterns for buy and sell opportunity. The patterns include demand and supply patterns. You might use each pattern for trading. However, these patterns are best used to detect the demand zone (=accumulation area) and supply zone (=distribution area). Demand pattern indicates generally potential buying opportunity. Supply pattern indicates generally potential selling opportunity. These are the underlying patterns rather than direct price action. T
EARLY REMINDER: The Starting price is 65 price will rise soon up to 365$ and then 750$ after first 10 copies of sales. Grab this offer now! Introduction Hello, traders! Welcome to the demonstration of the Forex Beast Indicator , a comprehensive tool designed to assist aspiring traders in navigating the complexities of the forex market. This indicator incorporates seven essential components to provide a well-rounded trading experience: Moving Averages Colored Zones Support and Resistance Levels
Nirvana prop controler MT4
Aiireza Arjmandi Nezhad
전문 트레이더와 평가형 계정(Prop)을 위한 위험 관리 및 한도 모니터링 지표 이 도구는 위험 관리와 한도에 관한 정보를 차트에 표시만 하여, 더 집중해서 의사결정을 내리도록 돕습니다. 인디케이터는 포지션을 열거나/닫거나/변경하지 않으며, 익스퍼트 어드바이저(EA)와도 충돌하지 않습니다. 기능 일일 및 총 드로우다운 모니터링 잔고(Balance) 또는 에쿼티(Equity)를 기준으로 일일/총 드로우다운을 계산·표시합니다(설정 가능). 설정된 한도까지 남은 비율을 표시합니다. 차트 내 깔끔하고 전문적인 패널 요약 표: Balance, Equity, 현재 P/L, 일일/총 DD, 경고 임계값. 의사결정에 집중할 수 있도록 간결하고 가독성 높은 UI. 위험 기반 포지션 사이징 퍼센트/고정 금액 리스크와 선택한 손절폭(SL)에 따라 대략적인 거래량을 산출. 위험대비보상비(R:R)와 진입, SL, TP 레벨을 차트에 표시. 경고와 알림 일일/총 DD 임계값에 근접 시 경고(임계값 퍼센트
Newlevel
Sergey Nanov
Indicator. Zones of support and resistance levels The most reliable tool in the hands of any technical analyst is support and resistance levels.It is these levels that magically work in the market, because the price then bounces off them, on the contrary, gaining maximum acceleration, punching them and striving for a new price point.However, in practice, many beginners face enormous difficulties in building them.This is due to the fact that the price may react quite differently to them, and ofte
FREE
Average Daily Range SR
William Jidekene Igwe
5 (1)
Average Daily Range (ADR) SR is an indicator which shows how far a currency pair can move in a day. It can be used to find hidden support and resistance levels (SR), estimate effective profit and stop loss targets, and provide short term trade signals from the hidden SR levels. Features Automatically plots on the chat, the top and bottom of the ADR value (i.e. a horizontal channel) which acts as Support and Resistance Levels Automatically calculates the percentage of the ADR reached by the curre
Introduction to Fractal Pattern Scanner Fractal Indicator refers to the technical indicator that makes use of the fractal geometry found in the financial market. Fractal Pattern Scanner is the advanced Fractal Indicator that brings the latest trading technology after the extensive research and development work in the fractal geometry in the financial market. The most important feature in Fractal Pattern Scanner is the ability to measure the turning point probability as well as the trend probabi
The PUA MultiType Pivot indicator is built on the daily chart of the previous day. The PUA MultiType Pivot indicator is one of the most popular tools in technical analysis, used by traders to identify potential reversal points in financial markets. This indicator constructs three types of Pivot points: Classic, Fibonacci, and Camarilla, each offering its unique approach to market analysis. The advantages of this indicator include: Simplicity and Clarity PUA MultiType Pivot provides clearly defi
If the direction of the market is upward, the market is said to be in an  uptrend ; if it is downward, it is in a  downtrend  and if you can classify it neither upward nor downward or rather fluctuating between two levels, then the market is said to be in a sideways trend. This indicator shows Up Trend (Green Histogram), Down Trend (Red Histogram) and Sideways Trend (Yellow Histogram). Only one input parameter: ActionLevel. This parameter depends of the length of the shown sideways trend.
MetaTrend M4
Vahidreza Heidar Gholami
Meta Trend Indicator is an efficient way to forecast and detect the trend in any market. It reveals the trend, support and resistance levels, volatility and the maximum potential target, all in one indicator. To adapt to the price and to decrease consecutive trend failures, the internal trend detector algorithm studies the market and dynamically chooses the right values for the internal parameters. This indicator is a perfect trend filter for any strategy or expert advisor. Features Super Adapti
Trend Impulse Scanner
Mehmet Ozhan Hastaoglu
Provides maximum revenue from trends. You can receive signals from Zigzag, Front Fibonacci Retracement, Back Fibonacci Retracement and Stochastic Oscillator indicators. You can run these indicators in the background. It will give you a warning at the levels you set. You can change all levels from the settings. Designed to help you get the most out of trends. Fibo Level : 38.2 / 61.8 / 76.4 Stochastic : 20 / 80
MetaTrader 4용 스마트 피벗 포인트 - 스마트 트레이딩을 위한 명확한 레벨 스마트 피벗 포인트는 MetaTrader 4용 전문 지표로, 차트에 주요 트레이딩 레벨을 자동으로 계산하여 표시해 줍니다. 복잡한 가격 움직임을 명확하고 구조화된 지도로 변환하여 지지선, 저항선, 가격 균형점, 그리고 잠재적 목표가를 강조합니다. 명확성을 중시하는 트레이더를 위해 설계된 이 도구는 외환, 암호화폐(비트코인, 이더리움), 주가지수, 주식, 원자재(XAUUSD) 등 모든 시장에서 활용 가능합니다. 이 지표는 계산 시간을 절약하고 분석에 객관성을 더하는 믿음직한 분석 도우미입니다. 시장 신호를 제공하거나 트레이딩 결정을 대신해 주는 것이 아니라, 트레이더 스스로 정보에 기반한 트레이딩 결정을 내릴 수 있도록 고품질의 정보를 제공합니다. 주요 기능 및 이점 바로 사용 가능한 가격 좌표 시스템: 더 이상 레벨을 수동으로 그릴 필요가 없습니다. 중심 레벨(균형점), 지지선, 저항선, 매수
이 제품의 구매자들이 또한 구매함
Gann Made Easy
Oleg Rodin
4.83 (161)
Gann Made Easy 는 mr.의 이론을 사용하여 최고의 거래 원칙을 기반으로 하는 전문적이고 사용하기 쉬운 Forex 거래 시스템입니다. W.D. 간. 이 표시기는 Stop Loss 및 Take Profit Levels를 포함하여 정확한 BUY 및 SELL 신호를 제공합니다. PUSH 알림을 사용하여 이동 중에도 거래할 수 있습니다. 구매 후 거래 방법 안내 및 유용한 추가 지표를 무료로 받으시려면 저에게 연락주세요! 아마도 Gann 거래 방법에 대해 이미 여러 번 들었을 것입니다. 일반적으로 Gann의 이론은 초보자 거래자뿐만 아니라 이미 거래 경험이 있는 사람들에게도 매우 복잡한 것입니다. Gann의 거래 방식은 이론적으로 적용하기 쉽지 않기 때문입니다. 나는 그 지식을 연마하고 Forex 지표에 최고의 원칙을 적용하기 위해 몇 년을 보냈습니다. 표시기는 적용하기가 매우 쉽습니다. 차트에 첨부하고 간단한 거래 권장 사항을 따르기만 하면 됩니다. 지표는 지속적으로 시장 분석
M1 Sniper
Oleg Rodin
5 (22)
M1 SNIPER 는 사용하기 쉬운 거래 지표 시스템입니다. M1 시간대에 맞춰 설계된 화살표 지표입니다. 이 지표는 M1 시간대 스캘핑을 위한 단독 시스템으로 사용할 수 있으며, 기존 거래 시스템의 일부로도 사용할 수 있습니다. 이 거래 시스템은 M1 시간대 거래용으로 특별히 설계되었지만, 다른 시간대에도 사용할 수 있습니다. 원래는 XAUUSD와 BTCUSD 거래를 위해 이 방법을 설계했지만, 다른 시장 거래에도 유용하다는 것을 알게 되었습니다. 이 지표의 신호는 추세 방향과 반대로 거래될 수 있습니다. 저는 지표의 신호를 활용하여 양방향으로 거래할 수 있도록 돕는 특별한 거래 기법을 알려드립니다. 이 방법은 특별한 동적 지지선과 저항선 가격 영역을 활용하는 것을 기반으로 합니다. 구매하시면 M1 SNIPER 화살표 지표를 바로 다운로드하실 수 있습니다. 또한, 아래 스크린샷에 표시된 Apollo Dynamic SR 지표는 M1 SNIPER 도구를 사용하는 모든 사용자에게 무료로
Ultimate Sniper Dashboard
Hispraise Chinedum Abraham
4.82 (22)
299달러로 할인! 추후 가격이 인상될 수 있습니다! 아래 설명을 읽어보세요! Ultimate Sniper Dashboard를 위한 최고의 엔트리 시스템: ULTIMATE DYNAMIC LEVELS. (내 제품을 확인하십시오) Ultimate Sniper Dashboard는 MT4 다중 통화 테스트 제한으로 인해 라이브 시장에서만 작동합니다. Ultimate-Sniper 대시보드를 소개합니다! HA-Sniper와 MA-Sniper를 모두 포함하는 최고의 제품입니다. 그리고 많은 특수 모드. Ultimate Sniper Dashboard는 절대 야수입니다! 초보자 또는 전문가 트레이더를 위한 최고의 솔루션! 다시 움직임을 놓치지 마세요! 단순함과 핍을 좋아하는 트레이더를 위해 특별한 제품을 준비했습니다. 본질적으로 단순한 대시보드는 여러 사용자 지정 알고리즘을 기반으로 28개의 통화 쌍을 살펴보는 모든 작업을 수행합니다. 단 하나의 차트로 전문가처럼 시장을 읽을 수 있습니다. 움직이기
Market Makers
Mohamed Hassan
5 (3)
After purchase, contact me privately to receive 1 month of free testing with EA Forex Proton! This advanced MT4 trading robot automatically executes signals from any MT4 indicator, including Market Makers. The latest version also includes AI integration, allowing each trade signal to be analyzed using Artificial Intelligence. Live Signal with EA Forex Proton: Click here Market Makers is a powerful price action trading system designed to identify high-probability Buy and Sell opportunities based
Trend Screener
STE S.S.COMPANY
4.79 (95)
트렌드 표시기, 트렌드 트레이딩 및 필터링을 위한 획기적인 고유 솔루션, 하나의 도구 안에 내장된 모든 중요한 트렌드 기능! Forex, 상품, 암호 화폐, 지수 및 주식과 같은 모든 기호/도구에 사용할 수 있는 100% 다시 칠하지 않는 다중 시간 프레임 및 다중 통화 표시기입니다. 기간 한정 특가: 지원 및 저항 스크리너 지표는 단 250 달러에 평생 제공됩니다. (원래 가격 150 달러) (제안 연장) Trend Screener는 차트에 점이 있는 화살표 추세 신호를 제공하는 효율적인 지표 추세 추종 지표입니다. 추세 분석기 표시기에서 사용할 수 있는 기능: 1. 트렌드 스캐너. 2. 최대 이익 분석이 있는 추세선. 3. 추세 통화 강도 측정기. 4. 경고가 있는 추세 반전 점. 5. 경고가 있는 강력한 추세 점. 6. 추세 화살표 Trend Screener Indicator가 있는 일일 분석 예, 일일 신호 성능...등은 여기에서 찾을 수 있습니다.   여기를 클릭하십시오.
Dynamic Scalper System
Vitalyi Belyh
5 (1)
" Dynamic Scalper System " 지표는 추세 파동 내에서 스캘핑 방식으로 거래하도록 설계되었습니다. 주요 통화쌍 및 금에서 테스트되었으며, 다른 거래 상품과의 호환성이 가능합니다. 추가적인 가격 변동 지원을 통해 추세에 따라 단기 포지션 진입 신호를 제공합니다. 지표의 원리 큰 화살표는 추세 방향을 결정합니다. 작은 화살표 형태의 스캘핑 신호를 생성하는 알고리즘은 추세 파동 내에서 작동합니다. 빨간색 화살표는 상승 방향을, 파란색 화살표는 하락 방향을 나타냅니다. 민감한 가격 변동선은 추세 방향으로 그려지며, 작은 화살표의 신호와 함께 작용합니다. 신호는 다음과 같이 작동합니다. 적절한 시점에 선이 나타나면 진입 신호가 형성되고, 선이 있는 동안 미결제 포지션을 유지하며, 완료되면 거래를 종료합니다. 권장되는 작업 시간대는 M1~H4입니다. 화살표는 현재 캔들에 형성되며, 다음 캔들이 이미 시작되었더라도 이전 캔들의 화살표는 다시 그려지지 않습니다. 입력 매개
GoldRush Trend Arrow Signal
Kirk Lee Holloway
5 (2)
GoldRush 트렌드 화살표 신호 GoldRush 트렌드 화살표 신호 지표는 XAU/USD 시장에서 고속 단기 스캘핑 트레이더를 위해 설계된 정밀한 실시간 트렌드 분석을 제공합니다. 1분 시간대에 특화되어 설계된 이 도구는 명확한 진입점을 표시하는 방향성 화살표를 제공하여 스캘퍼들이 변동성이 높은 시장 환경에서도 자신 있게 거래할 수 있도록 합니다. 이 지표는 PRIMARY 및 SECONDARY 경고 화살표로 구성됩니다. PRIMARY 신호는 추세 방향의 변화를 나타내는 흰색과 검은색 방향성 화살표이며, SECONDARY 신호는 PRIMARY 화살표가 지시하는 방향을 확인하고 잠재적인 거래 진입점을 표시하는 파란색과 빨간색 화살표입니다. 참고: 추세 방향이 변경된 후 PRIMARY 경고 화살표가 단 하나만 표시될 경우, 다수의 SECONDARY 파란색/빨간색 화살표가 표시될 수 있음을 유의해야 합니다. SECONDARY 신호는 신호 기준을 충족하는 어떤 캔들 이후에도 표시
Scalper Inside PRO
Alexey Minkov
4.74 (69)
Scalper Inside PRO – Since 2020. An exclusive indicator that utilizes an innovative algorithm to swiftly and accurately determine the market trend. The indicator automatically calculates opening, closing, and profit levels, providing detailed trading statistics. With these features, you can choose the most appropriate trading instrument for the current market conditions. Additionally, you can easily integrate your own arrow indicators into Scalper Inside Pro to quickly evaluate their statistics
Super Signal – Skyblade Edition 전문가용 노리페인트 / 노래그 트렌드 신호 시스템, 뛰어난 승률 제공 | MT4 / MT5용 1분, 5분, 15분과 같은 낮은 타임프레임에서 가장 좋은 성능을 보입니다. 핵심 기능: Super Signal – Skyblade Edition은 추세 매매를 위해 설계된 스마트 신호 시스템입니다. 이 시스템은 다중 필터 로직을 활용하여, 명확한 방향성과 실질적인 모멘텀이 수반된 고품질 추세만을 감지합니다. 이 시스템은 고점 또는 저점을 예측하지 않으며 , 다음 세 가지 조건이 모두 충족될 때만 신호를 발생시킵니다: 명확한 추세 방향 강화되는 모멘텀 건전한 변동성 구조 또한, 시장 세션 기반의 유동성 분석을 통해 신호의 신뢰성과 타이밍을 더욱 향상시킵니다. 신호 특성: 모든 화살표 신호는 100% 리페인트 없음 / 지연 없음 신호가 한 번 발생하면 고정되며, 깜빡이거나 사라지지 않음 차트 상의 시각적 화살표, 정보 패널, 팝업 알
PRO Renko System
Oleg Rodin
5 (30)
PRO Renko System 은 RENKO 차트 거래를 위해 특별히 고안된 매우 정확한 거래 시스템입니다. 이것은 다양한 거래 상품에 적용될 수있는 보편적 인 시스템입니다. 체계는 효과적으로 당신에게 정확한 반전 신호에 접근을 주는 소위 시장 소음을 중화합니다. 이 표시기는 사용하기가 매우 쉽고 신호 생성을 담당하는 매개 변수가 하나만 있습니다. 당신은 쉽게 당신의 선택의 어떤 무역 계기에 공구를 적응시킬 수 있고 renko 막대기의 크기. 나는 항상 당신이 내 소프트웨어로 수익성있게 거래 할 수 있도록 추가 지원을 제공 할 준비가되어 있습니다! 나는 당신에게 행복하고 수익성있는 거래를 기원합니다! 구매 후 저에게 연락하십시오! 내 렌코 차트 생성기를 보내드립니다. 또한 내 개인 권장 사항 및 시스템의 다른 모듈을 무료로 공유 할 것입니다!
Smart Price Action Concepts
Issam Kassas
4.77 (13)
우선적으로, 이 거래 도구는 전문적인 거래에 이상적인 비-다시 그리기 및 지연되지 않는 지표입니다.  온라인 강좌, 사용자 매뉴얼 및 데모. 스마트 가격 액션 컨셉트 인디케이터는 신규 및 경험 많은 트레이더 모두에게 매우 강력한 도구입니다. Inner Circle Trader Analysis 및 Smart Money Concepts Trading Strategies와 같은 고급 거래 아이디어를 결합하여 20가지 이상의 유용한 지표를 하나로 결합합니다. 이 인디케이터는 스마트 머니 컨셉트에 중점을 두어 대형 기관의 거래 방식을 제공하고 이동을 예측하는 데 도움을 줍니다.  특히 유동성 분석에 뛰어나 기관이 어떻게 거래하는지 이해하는 데 도움을 줍니다. 시장 트렌드를 예측하고 가격 변동을 신중하게 분석하는 데 탁월합니다. 귀하의 거래를 기관 전략에 맞추어 시장의 동향에 대해 더 정확한 예측을 할 수 있습니다. 이 인디케이터는 시장 구조를 분석하고 중요한 주문 블록을 식별하고 다양한
Ultimate Dynamic Levels
Hispraise Chinedum Abraham
4.7 (10)
現在、ホリデーディスカウントで399ドル! 今後値上がりする可能性があります。以下の説明をお読みください。 Ultimate Dynamic Levelsの紹介 - Ultimate Sniper DashboardのBESTエントリーインジケーター! 極めてローリスクなタイムリーエントリーと高RR!!! アルティメットスナイパーダッシュボードはこちら。 初心者はもちろん、プロのトレーダーにとっても最も重要な能力は、いつどこで相場が転換するかを正確に判断し、いかに安全に参入し、利益を得て退場するかを見極めることです。 アルティメット・ダイナミック・レベルズ・インディケーターは、相場が転換する可能性が最も高い場所を簡単に教えてくれるので、極めてローリスクなトレードを自信を持って行うことができ、同時にチャートをクリーンでシンプルに保ちながら、$$$を稼ぐことができるのです! アルティメット・ダイナミック・レベルズ・インディケーターは、複数の時間枠で重要な隠れたレベルを一度に見つけるユニークで強力なアルゴリズムを持っています。また、他の典型的なSRインジケーターのように、レベルを再描
Atomic Analyst
Issam Kassas
5 (5)
우선적으로 언급할 점은이 거래 지표가 다시 그리지 않고 지연되지 않으며 이를 통해 수동 및 로봇 거래 모두에 이상적이라는 점입니다. 사용자 매뉴얼: 설정, 입력 및 전략. Atomic Analyst는 가격의 강도와 모멘텀을 활용하여 시장에서 더 나은 이점을 찾는 PA Price Action Indicator입니다. 고급 필터를 장착하여 잡음과 거짓 신호를 제거하고 거래 잠재력을 높이는 데 도움이 됩니다. 복잡한 지표의 다중 레이어를 사용하여 Atomic Analyst는 차트를 스캔하고 복잡한 수학적 계산을 간단한 신호와 색상으로 변환하여 초보 트레이더가 이해하고 일관된 거래 결정을 내릴 수 있도록합니다. "Atomic Analyst"는 새로운 및 경험이 풍부한 트레이더를위한 종합적인 거래 솔루션입니다. 프리미엄 지표와 최고 수준의 기능을 하나의 거래 전략에 결합하여 모든 종류의 트레이더에 대한 다재다능한 선택지가되었습니다. 인트라데이 거래 및 스캘핑 전략 : 빠르고 정확한 일일
Route Lines Prices - 은 가격 방향을 찾는 데 사용되는 지표입니다. 간단한 인터페이스에는 가격 움직임 및 미래 방향 계산을 위한 다양한 알고리즘이 포함되어 있습니다. 이러한 알고리즘에는 사용된 시간대에 따른 변동성 계산 및 가격 평활화 기능이 있습니다. 이 지표는 " Calculating price values " 값을 변경하는 단일 매개변수를 제공합니다. 기본값인 1은 균형 잡힌 자동 계산을 제공하며, 별도의 설정 없이 바로 사용할 수 있습니다. 2에서 500 사이의 값을 수동으로 변경하여 자신만의 거래 시스템에 맞게 지표를 맞춤 설정할 수 있습니다. 이 지표는 M1부터 H4까지의 시간대에서 사용을 권장합니다. 모든 거래 상품에 적용 가능합니다. 신호 화살표는 캔들 종가에 생성되며, 과거 차트에는 다시 그려지지 않습니다. 메인 차트에 동일한 화살표가 표시됩니다. 다양한 유형의 알림을 사용할 수 있으며, 내장된 라인 궤적 카운터는 종가를 기반으로 작동합니다. 이는
Apollo SR Master
Oleg Rodin
5 (2)
Apollo SR Master는 지지/저항 구간에서의 거래를 더욱 쉽고 안정적으로 만들어 주는 특수 기능을 갖춘 지지/저항 지표입니다. 이 지표는 지역 가격의 고점과 저점을 감지하여 시간 지연 없이 실시간으로 지지/저항 구간을 계산합니다. 새롭게 형성된 저항 구간을 확인하기 위해 지표는 해당 저항 구간을 실제 매도 또는 매수 신호로 활용할 수 있음을 나타내는 특수 신호를 표시합니다. 이 경우, 저항 구간의 강도가 높아지고, 따라서 저항 구간에서의 성공적인 거래 가능성도 높아집니다. 이것이 바로 이 지표의 핵심 아이디어입니다. SR 존은 손절매와 이익실현을 더욱 쉽게 할 수 있도록 해줍니다. 신호 방향에 따라 SR 존 위 또는 아래 공간을 손절매로 활용할 수 있습니다. 또한, 반대쪽 SR 존은 잠재적 이익실현 영역으로 활용할 수 있습니다. 또한 Apollo SR Master 지표를 사용하는 모든 사용자에게 "Apollo Price Action System" 지표를 무료로 제공합니다.
Currency Strength Exotics
Bernhard Schweigert
4.88 (33)
현재 20% 할인! 초보자 또는 전문가 트레이더를 위한 최고의 솔루션! 이 표시기는 Exotic Pairs Commodities, Indexes 또는 Futures와 같은 기호에 대한 통화 강도를 표시하는 데 특화되어 있습니다. 금, 은, 석유, DAX, US30, MXN, TRY, CNH 등의 진정한 통화 강도를 보여주기 위해 9번째 줄에 모든 기호를 추가할 수 있습니다. 이것은 독특하고 고품질이며 저렴한 거래 도구입니다. 우리는 많은 독점 기능과 새로운 공식을 통합했습니다. 새로운 추세 또는 스캘핑 기회의 정확한 트리거 포인트를 정확히 찾아낼 수 있기 때문에 거래가 어떻게 개선될지 상상해 보십시오. 사용 설명서: 여기를 클릭 https://www.mql5.com/en/blogs/post/708876 모든 시간대에 작동합니다. TREND를 빠르게 확인할 수 있습니다! 새로운 기본 알고리즘을 기반으로 설계되어 잠재적인 거래를 더욱 쉽게 식별하고 확인할 수 있습니다. 8개의
BTMM State Engine Pro MT4
Garry James Goodchild
BTMM State Engine Pro is a MetaTrader 4 indicator for traders who use the Beat The Market Maker approach: Asian session context, kill zone timing, level progression, peak formation detection, and a multi-pair scanner from a single chart. It combines cycle state logic with a built-in scanner dashboard so you do not need the same tool on many charts at once. What it does Draws the Asian session range; session times can follow broker server offset or be set in inputs. Tracks level progression (L
Advanced Currency Strength28 Indicator
Bernhard Schweigert
4.91 (657)
현재 40% 할인 초보자 또는 전문가 트레이더를 위한 최고의 솔루션! 이 지표는 우리가 독점 기능과 새로운 공식을 통합했기 때문에 독특하고 고품질이며 저렴한 거래 도구입니다. 단 하나의 차트로 28 Forex 쌍의 통화 강도를 읽을 수 있습니다! 새로운 추세 또는 스캘핑 기회의 정확한 트리거 포인트를 정확히 찾아낼 수 있기 때문에 거래가 어떻게 개선될지 상상해 보십시오. 사용 설명서: 여기를 클릭  https://www.mql5.com/en/blogs/post/697384 그것이 첫 번째, 원본입니다! 쓸모없는 지망생 클론을 사지 마십시오. 더 스페셜  강력한 통화 모멘텀을 보여주는 하위 창의 화살표 GAP가 거래를 안내합니다! 기본 또는 호가 통화가 과매도/과매도 영역(외부 시장 피보나치 수준)에 있을 때 개별 차트의 기본 창에 경고 표시가 나타납니다. 통화 강도가 외부 범위에서 떨어질 때 풀백/반전 경고. 교차 패턴의 특별 경고 추세를 빠르게 볼 수 있는 다중 시간
Currency Strength Wizard
Oleg Rodin
4.85 (59)
통화 강도 마법사는 성공적인 거래를 위한 올인원 솔루션을 제공하는 매우 강력한 지표입니다. 표시기는 여러 시간 프레임의 모든 통화 데이터를 사용하여 이 또는 해당 외환 쌍의 힘을 계산합니다. 이 데이터는 특정 통화의 힘을 확인하는 데 사용할 수 있는 사용하기 쉬운 통화 지수 및 통화 전력선의 형태로 표시됩니다. 필요한 것은 거래하려는 차트에 표시기를 부착하는 것뿐입니다. 표시기는 거래하는 통화의 실제 강세를 보여줍니다. 지표는 또한 추세와 거래할 때 유리하게 사용할 수 있는 구매 및 판매 거래량 압력의 극한값을 보여줍니다. 지표는 또한 피보나치에 기반한 가능한 대상을 보여줍니다. 표시기는 PUSH 알림을 포함한 모든 유형의 알림을 제공합니다. 구매 후 연락주세요. 나는 당신과 거래 팁을 공유하고 당신에게 무료로 훌륭한 보너스 지표를 줄 것입니다! 나는 당신에게 행복하고 유익한 거래를 기원합니다!
Advanced Supply Demand
Bernhard Schweigert
4.91 (299)
현재 40% 할인! 초보자나 전문 트레이더를 위한 최고의 솔루션! 이 보조지표는 우리가 다수의 독창적 기능과 새로운 공식을 통합한 독특하고 고품질이며 저렴한 거래 도구입니다. 이 업데이트를 통해 이중 시간대를 표시할 수 있습니다. 더 높은 TF를 표시할 수 있을 뿐만 아니라 차트 TF와 더 높은 TF 모두를 표시할 수 있습니다: 중첩 영역 표시. 모든 Supply Demand 트레이더들이 좋아할 것입니다. :) 중요한 정보 공개 Advanced Supply Demand의 잠재력을 극대화하려면 다음을 방문하십시오. https://www.mql5.com/ko/blogs/post/720245   진입 또는 목표의 명확한 트리거 포인트를 정확히 찾아냄으로 해서 거래가 어떻게 개선될지 상상해 보십시오. 새로운 알고리즘을 기반으로 매수자와 매도자 간의 잠재적인 불균형을 훨씬 더 쉽게 분간할 수 있습니다. 왜냐하면 가장 강한 공급영역과 가장 강한 수요 영역과 과거에 어떻게 진행 되었는지를(이전
- Real price is 80$ - 40% Discount (It is 49$ now) Contact me for instruction, add group and any questions! - Non-repaint - I just sell my products in Elif Kaya profile, any other websites are stolen old versions, So no any new updates or support. - Lifetime update free Related product:   Bitcoin Expert Introduction The breakout and retest strategy is traded support and resistance levels. it involves price breaking through a previous level.  The break and retest strategy is designed to help tr
GOLD Impulse with Alert
Bernhard Schweigert
4.67 (12)
이 지표는 Advanced Currency IMPULSE with ALERT  +   Currency Strength Exotics  의 2가지 제품의 슈퍼 조합입니다. 그것은 모든 시간 프레임에 대해 작동하며 8개의 주요 통화와 하나의 기호에 대한 강약의 충동을 그래픽으로 보여줍니다! 이 표시기는 금, 이국적인 쌍, 상품, 지수 또는 선물과 같은 기호에 대한 통화 강도 가속을 표시하는 데 특화되어 있습니다. 금, 은, 오일, DAX, US30, MXN, TRY, CNH 등의 진정한 통화 강도 가속(충동 또는 속도)을 표시하기 위해 9번째 줄에 모든 기호를 추가할 수 있습니다. 새로운 기본 알고리즘을 기반으로 구축되어 잠재적인 거래를 훨씬 더 쉽게 식별하고 확인할 수 있습니다. 이는 통화의 강세 또는 약세가 가속되는지 여부를 그래픽으로 표시하고 가속 속도를 측정하기 때문입니다. 자동차의 속도계처럼 생각하면 됩니다. 가속화할 때 Forex 시장에서 동일한 일이 분명히 더 빠르
Cycle Sniper
Elmira Memish
4.39 (36)
Please contact us after your purchase and we will send you the complimentary indicators to complete the system Cycle Sniper is not a holy grail but when you use it in a system which is explained in the videos, you will feel the difference. If you are not willing to focus on the charts designed with Cycle Sniper and other free tools we provide, we recommend not buying this indicator. We recommend watching the videos about the indiactor and system before purchasing. Videos, settings  and descri
Auto Optimized Parabolic RSI: 고급 3D 모멘텀 엔진 대부분의 개인 투자자용 보조지표는 시장의 변동성이 변하는 순간 무용지물이 되는 정적인 입력값에 의존하기 때문에 실패합니다. Auto Optimized Parabolic RSI는 자체적인 수학적 우위를 지속적으로 재계산하여 "보조지표 노후화" 문제를 해결하며, 기관급 퀀트 트레이딩의 적응력을 귀하의 MT5 터미널에 직접 제공합니다. 핵심 이점: 맞춤형 인메모리 3D 최적화   표준 자동 최적화 도구들은 일반적인 보조지표 호출로 터미널에 과부하를 일으켜 MT5 플랫폼을 멈추게 하는 경우가 많습니다. 이 도구는 이러한 병목 현상을 완전히 우회합니다. 맞춤형 네이티브 RAM 기반 계산기로 구축된 내부 엔진은 차트를 로드하거나 타임프레임을 변경할 때마다 빛처럼 빠른 3D 그리드 검색을 실행합니다. RSI 기간(주기), SAR 스텝(가속도) 및 SAR 최대치(속도 제한)를 동시에 스캔하여 플랫폼 지연 없이 수만 개의
Market Structure Order Block Dashboard MT4 는 차트에서 시장 구조와 주요 가격 반응 영역을 직접 읽으려는 트레이더를 위해 설계된 MetaTrader 4 지표입니다. BOS, ChoCH, Order Blocks, Fair Value Gaps (FVG), 유동성, Kill Zones, Volume Profile 및 빠른 분석을 위한 컴팩트한 대시보드를 결합합니다. 이 지표는 시장 구조, ICT 및 Smart Money 개념을 의사 결정 프레임워크로 사용하는 트레이더를 대상으로 합니다. 추세 연속성, 가능한 반전, 가격 불균형, 유동성 목표 및 관심 영역을 보다 구조화된 방식으로 식별하는 데 도움이 됩니다. 구매자에게 제공되는 리소스 구매 후 MQL5 비공개 메시지로 간단히 요청하여 완전한 PDF 사용자 가이드 및 매개변수 설정 팁을 받을 수 있습니다. MQL5 비공개 메시지를 통한 직접 기술 지원. 이 MT4 버전은 MT5 버전 1.20의 모든 기능을
Volatility Trend System - a trading system that gives signals for entries. The volatility system gives linear and point signals in the direction of the trend, as well as signals to exit it, without redrawing and delays. The trend indicator monitors the direction of the medium-term trend, shows the direction and its change. The signal indicator is based on changes in volatility and shows market entries. The indicator is equipped with several types of alerts. Can be applied to various trading ins
Linear Trend Predictor - 진입 지점과 방향성 지원선을 결합한 추세 지표입니다. 고가/저가 채널을 돌파하는 원칙에 따라 작동합니다. 지표 알고리즘은 시장 노이즈를 걸러내고 변동성과 시장 역학을 고려합니다. 표시기 기능  평활화 방법을 사용하여 시장 추세와 BUY 또는 SELL 주문을 시작하기 위한 진입 시점을 보여줍니다.  모든 기간의 차트를 분석하여 단기 및 장기 시장 움직임을 파악하는 데 적합합니다.  어떠한 시장과 시간대에도 적용할 수 있으며, 입력 매개변수를 통해 거래자는 자신에게 맞게 지표를 독립적으로 사용자 지정할 수 있습니다.  설정된 지표 신호는 사라지거나 다시 그려지지 않습니다. 이는 캔들 마감 시 결정됩니다.  여러 유형의 알림이 화살표와 결합되어 있습니다.  이 지표는 독립적인 거래 시스템으로 사용할 수도 있고, 다른 거래 시스템에 추가하는 용도로도 사용할 수 있습니다.  모든 수준의 경험을 가진 거래자가 사용할 수 있습니다. 주요 매
Trend indicator AI
Ramil Minniakhmetov
4.53 (83)
트렌드 인공 지능 지표는 실행 가능한 진입 점 및 반전 경고와 추세 식별을 결합하여 상인의 시장 분석을 향상시킬 훌륭한 도구입니다. 이 표시기는 사용자가 자신감과 정밀도로 외환 시장의 복잡성을 탐색 할 수 있도록 지원합니다 기본 신호 외에도 트렌드 인공 지능 지표는 풀백 또는 되돌림 중에 발생하는 2 차 진입 점을 식별하여 거래자가 기존 트렌드 내에서 가격 수정을 활용할 수 있도록합니다. 중요한 장점: ·작동 4 및 5 *명확한 구매 또는 판매 신호 *다시 칠하지 않습니다 *모든 자산에서 작동 나는 전보 사기에 개 또는 세트를 판매하지 않도록주의. 모든 설정은 블로그에 여기에 무료.  중요! 지침 및 보너스를 얻기 위해 구입 후 즉시 저에게 연락! 진짜 가동 감시는 뿐 아니라 나의 다른 제품 여기에서 찾아낼 수 있습니다: https://www.mql5.com/en/users/mechanic/seller&nbsp ; 설정 및 입력: 모든 자산에 대해 기본 설정을 권
MBFX Timing
Mohamed Hassan
5 (3)
After purchase, contact me in private to get 7 days of FREE testing with EA Forex Proton where the robot automatically takes the trade alerts from MBFX Timing! MBFX Timing is an indicator that was developed and created by Mostafa Belkhayate, one of the best traders in the world. We decided to create a modified version that takes inspiration from the Stochastic Oscillator and the Relative Strength Quality Index indicators to improve your trading.  One of the main reasons we released MBFX Timing
Easy Reversal
Mohamed Hassan
Easy Reversal is designed to help traders spot turning points in the market with clear buy and sell signals. The indicator is based on the Keltner Channel but improved with a custom calculation that uses ATR and EMA confirmation. This makes it more reliable and less noisy than standard reversal tools.  The signals from Easy Reversal appear directly from peak candlestick behavior, showing you when price action is reaching exhaustion. A buy signal is generated when a candlestick forms a strong r
제작자의 제품 더 보기
ArchIntel Dashboard
Raphael Adetunji Olaiyapo
ArchIntel Strength meter is different from the conventional strength meter. It displays correlation index for currency pair and individual currencies, see image 4 and image 6 for the currency pair correlation index and currency strength index. This strength meter displays correlated pair. EURJPY is used to explain the formula, EURUSD and USDJPY must be going up before I can buy (Long ) EURJPY , vice-versa is for sell. When any of the currency pair is correlated using this formular the the rectan
필터:
jonclark365
207
jonclark365 2023.01.25 14:17 
 

사용자가 평가에 대한 코멘트를 남기지 않았습니다

sabah2001
1002
sabah2001 2022.11.17 05:54 
 

사용자가 평가에 대한 코멘트를 남기지 않았습니다

Raphael Adetunji Olaiyapo
608
개발자의 답변 Raphael Adetunji Olaiyapo 2022.11.17 06:56
When did it stop working? Did it work yesterday?
리뷰 답변