Chart Replay
- 유틸리티
- 버전: 1.0
- 활성화: 5

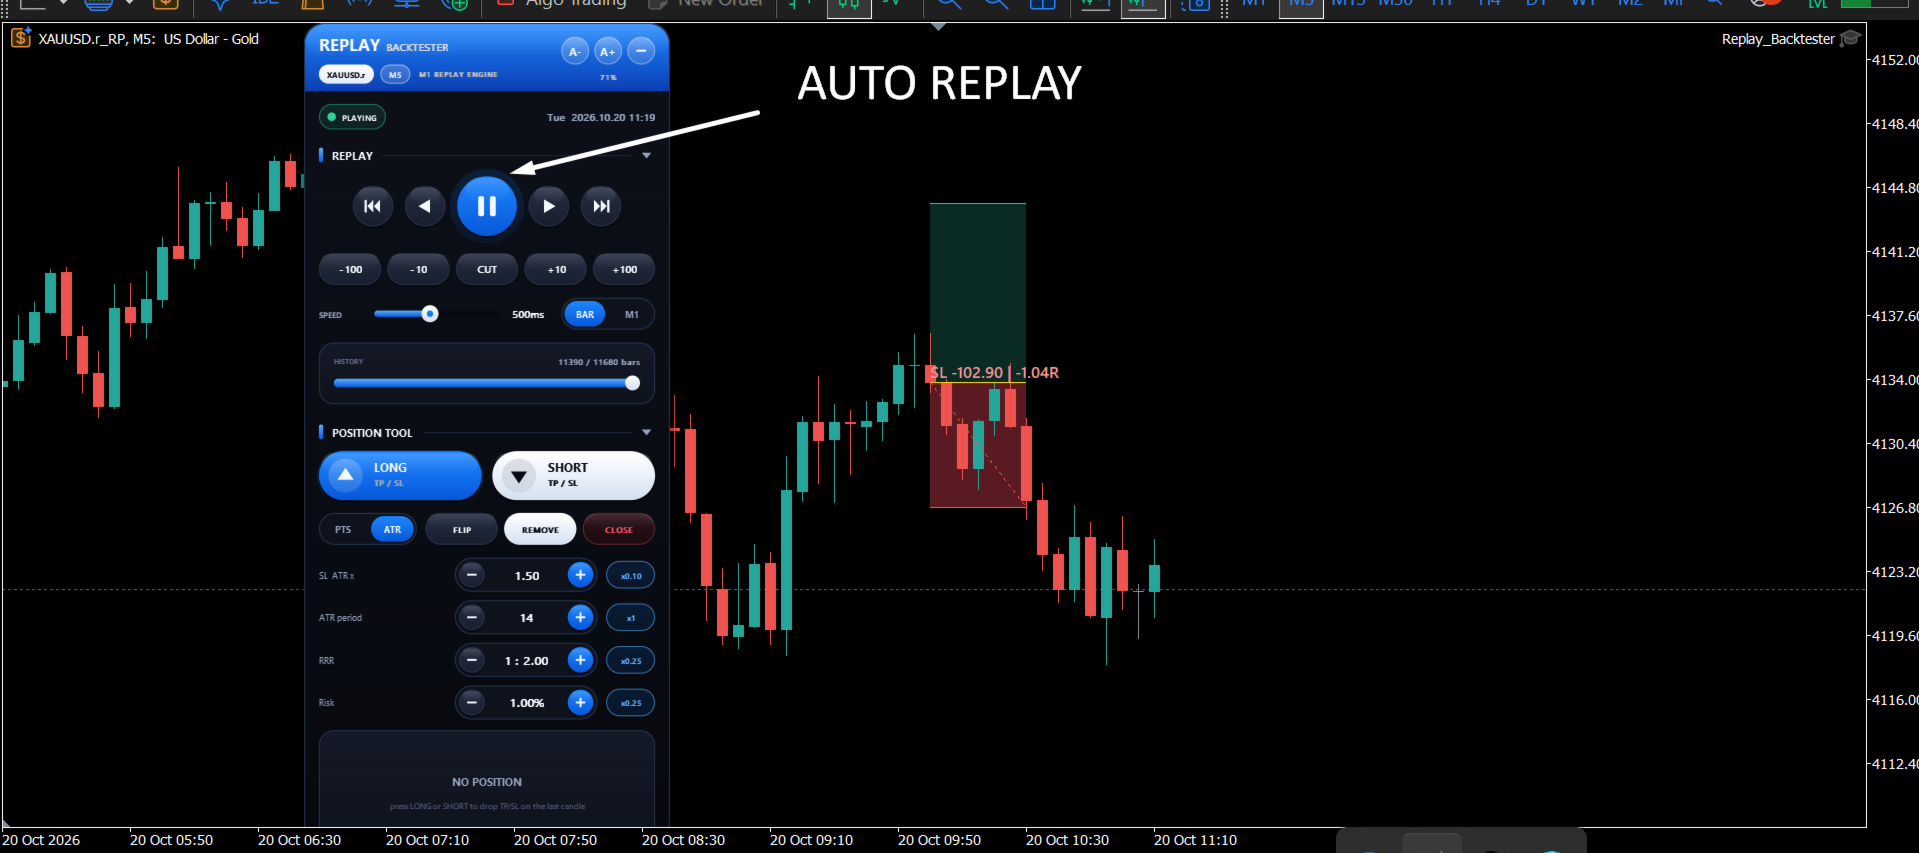
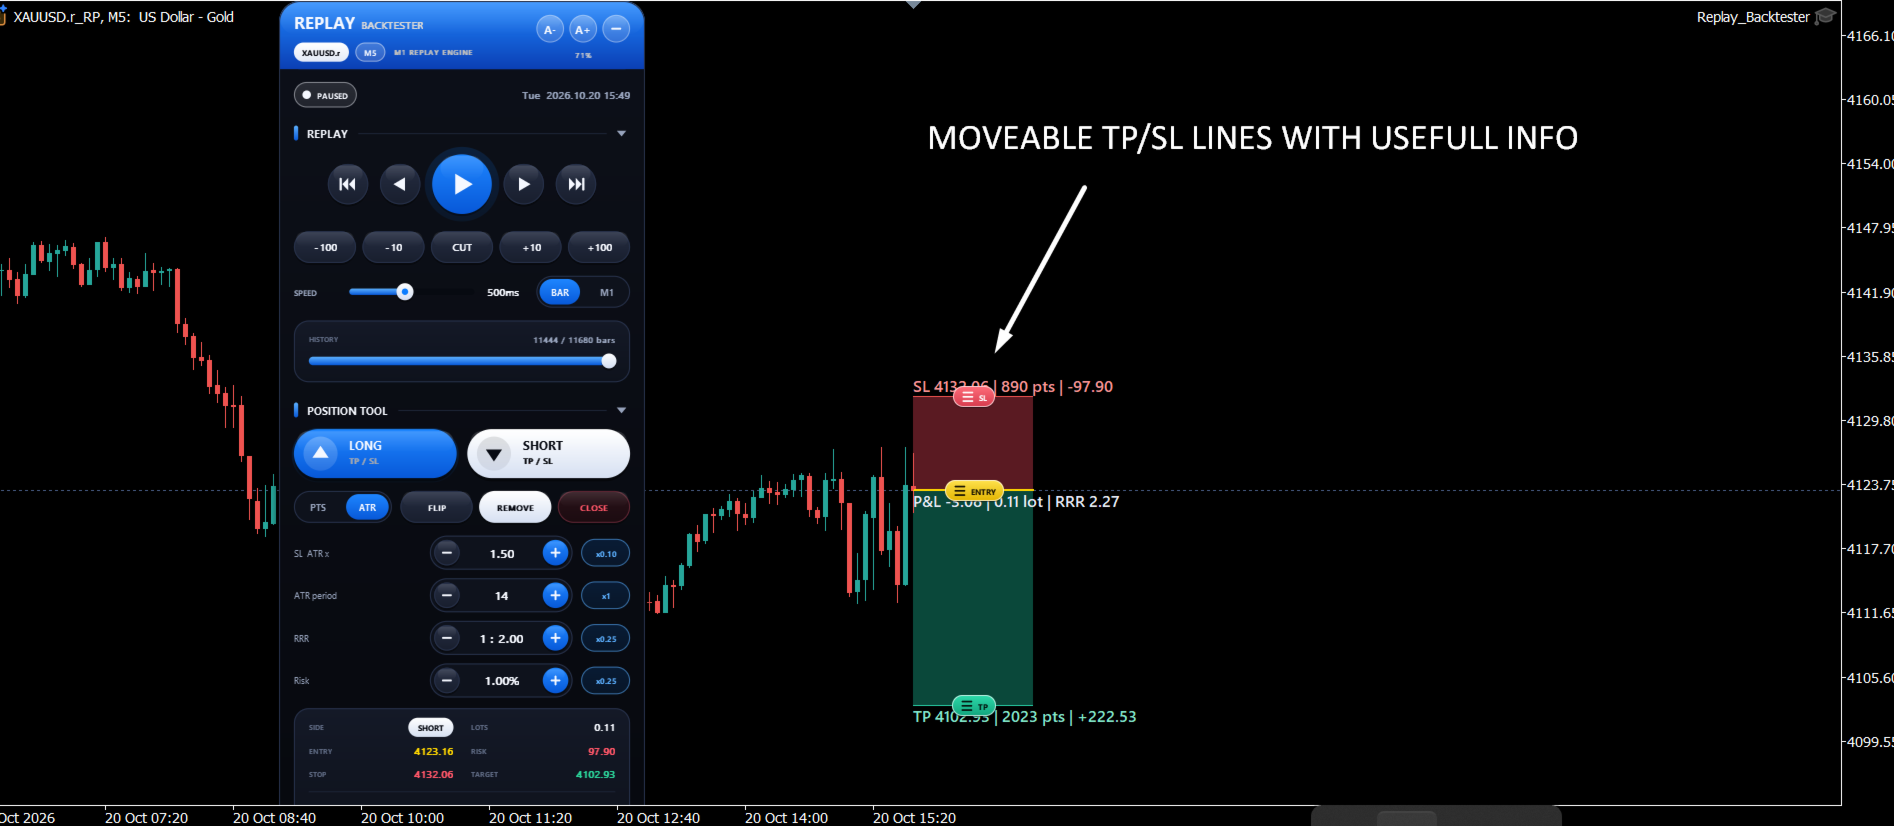
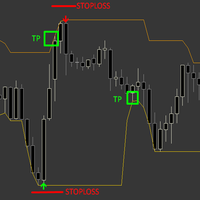
this tool allows you to go back in history on live chart, and replay it candle by candle or make it auto run with x speed, the tool also provides tp and sl lines that are easy to click and move, this tool is mainly used for backtesting strategys and studying market behavior.
HOW TO USE:
Replay
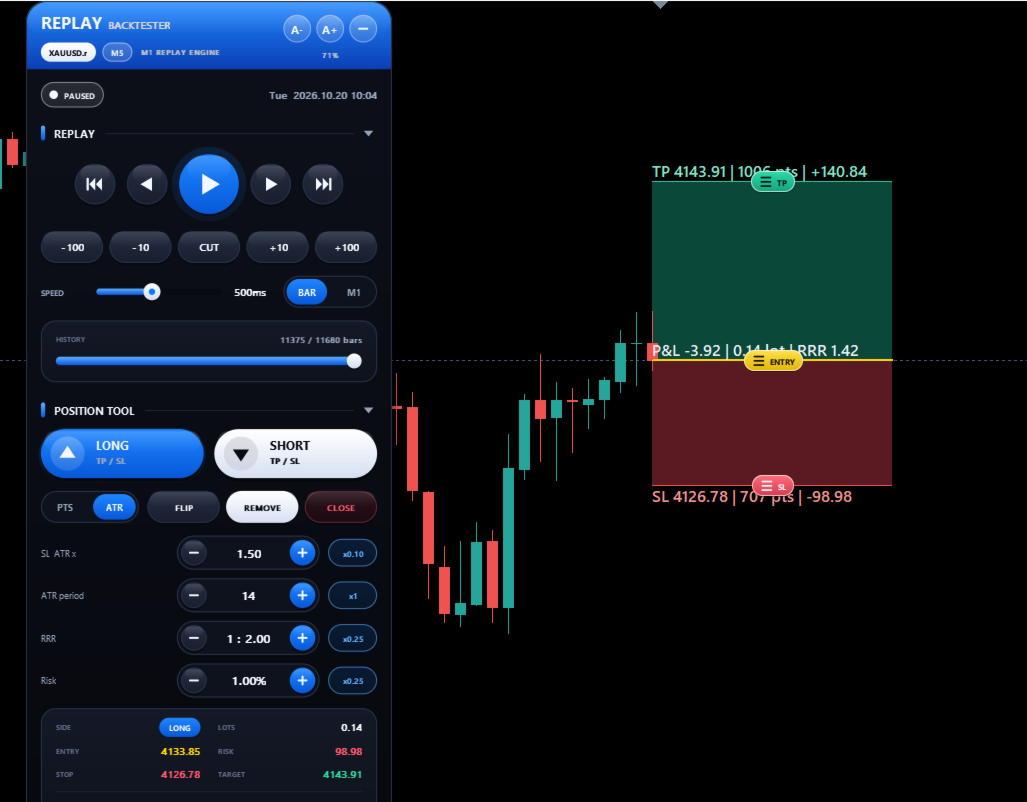
- PLAY / PAUSE plays bars automatically; the SPEED slider sets the pace.
- < / > step one bar; -100 -10 +10 +100 jump; |<< / >>| go to start or end.
- CUT: click a past bar to restart from there.
- BAR / M1: step full candles or minute by minute.
- Click the history bar to jump anywhere.
Trading
- LONG / SHORT places a trade on the last candle with yellow entry, green TP and red SL.
- Drag the middle grip of any line with one click to move it.
- REMOVE wipes the TP/SL; CLOSE closes and records the result; FLIP reverses it.
- Set SL (points or ATR), RRR and Risk % in POSITION TOOL.
Panel
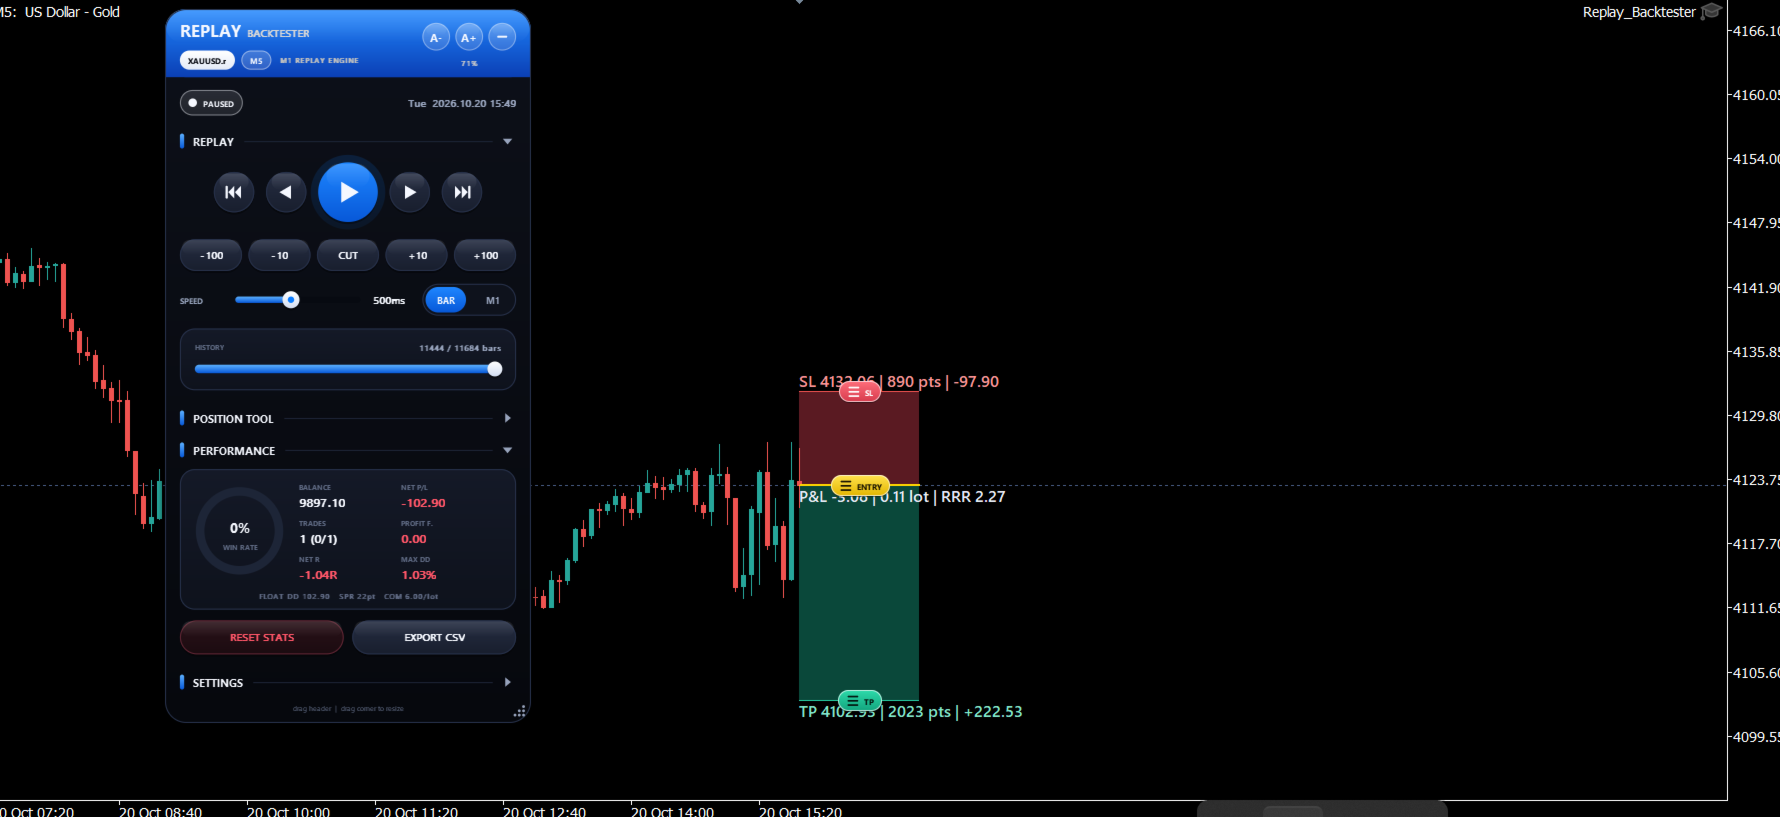
Drag the header to move it, drag the bottom-right corner to resize, and click section titles to open them. PERFORMANCE shows win rate, P/L, PF and drawdown. EXIT returns to the normal chart.
Keys: arrows step, Space plays, ESC cancels CUT.