Price Action Pure Indi

📊 SR Zones & Pivot Panel EA - All-in-One Trading Tool

SR Zones & Pivot Panel EA is a powerful hybrid tool that combines automatic Support/Resistance Zones, Daily Pivot Points, and a Compact Trading Panel into one interface. It helps traders visualize key price levels on any timeframe while executing trades quickly and efficiently.
Designed for precision and speed, this tool keeps your chart clean while providing all the data you need for intraday trading.

🔑 Key Features

1. Automatic Support & Resistance Zones
  • Automatically scans the H1 timeframe to find the strongest Supply and Demand levels.
  • Displays clear Red Zones (Resistance) and Green Zones (Support).
  • Zones remain fixed regardless of the current chart timeframe (M15, M5, M1, etc.), ensuring stable analysis.
2. Advanced Daily Pivot Points
  • Calculates and plots 9 key Pivot levels based on the previous day's High, Low, and Close.
  • Includes intermediate levels for precise entry/exit points.
  • Labels are smart-positioned to avoid cluttering the chart.
3. Compact Trading Panel
  • A sleek, space-saving dashboard (1/3 standard size) located at the bottom of the chart.
  • Includes dedicated buttons for Buying, Selling, and Risk Management.
4. Smart Lot Management
  • One-click (+) and (-) buttons to adjust lot size.
  • Automatically validates minimum and maximum lot limits set by your broker.

📊 Pivot Points Logic

The system calculates standard daily pivots plus "Mid" (intermediate) levels:
  • DR2 / DR1: Daily Resistance levels.
  • DS1 / DS2: Daily Support levels.
  • mR2 / mR1: Mid Resistance (between Pivot and R levels).
  • mS1 / mS2: Mid Support (between Pivot and S levels).
  • DPV: Daily Pivot Value (Center Point).

🛠️ Trading Panel Functions

  • BUY / SELL: Instantly open a position with the current lot size.
  • CLOSE BUY / CLOSE SELL: Close only Buy or only Sell positions (partial close utility).
  • CLOSE ALL: Close every open position immediately.
  • CLOSE PROFIT: Close only positions that are currently in profit.
  • CLOSE LOSS: Close only positions that are currently in loss (Stop Loss utility).
  • Account Info: Real-time display of Balance, Equity, and Floating Profit.

⚙️ Settings

  • Lookback Bars: Number of H1 bars to scan for zones (Default: 30).
  • Zone Pips: Thickness of the Support/Resistance zones.
  • Panel Position: X-axis offset for the trading panel.
  • Colors: Customizable colors for Resistance, Support, and Panel elements.

📝 How to Use

  1. Attach the tool to any chart.
  2. Ensure Algo Trading is enabled in the MT5 toolbar to use the BUY/SELL buttons.
  3. The Support/Resistance zones and Pivot Lines will appear automatically.
  4. Use the Panel at the bottom to manage your trades.

추천 제품
CRT Candle Range Theory HTF MT5.   Ultimate CRT Indicator: Advanced ICT Concepts and Malaysian SnR Trading System Master the Market Maker's Footprints with the Most Advanced Candle Range Theory Indicator Discounted   Price $50  !!     Secure your lifetime access now before it switches to subscription-only ! Unlock the true power of Smart Money Concepts (SMC) and trade precisely like the institutions with the Ultimate CRT Indicator . Built exclusively for serious traders, this indicator automate
Dual Bollinger Session Channel
Danton Dos Santos Sardinha Junior
Dual Bollinger Session Channel MetaTrader 5 전문 고정 세션 볼린저 채널 실제 세션 데이터를 기반으로 가격 행동(price action), 돌파(breakout), 기관급 시장 구조 분석을 위해 설계되었습니다. 제품 개요 Dual Bollinger Session Channel 은 MetaTrader 5용 프로페셔널급 기술적 인디케이터로, 직전의 실제 거래 세션 (일간 또는 주간) 데이터만을 기반으로 두 개의 독립적인 볼린저 밴드 계산을 수행하여 고정된 통계적 가격 채널을 생성합니다. 기존의 볼린저 밴드가 새 캔들이 형성될 때마다 지속적으로 재계산되는 것과 달리, 본 인디케이터는 현재 활성 세션 전체 동안 모든 채널 레벨을 고정 하여 트레이더에게 거래 기간 내내 안정적이고 신뢰할 수 있는 통계적 프레임워크를 제공합니다. 이 방식은 다음을 정밀하게 시각화할 수 있게 해줍니다: 가격 균형 구역 통계적 과신장(overextension) 영역 변동성 확장
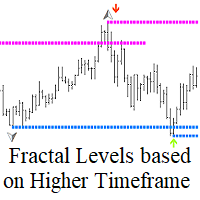
상위 차트주기 기반 프랙탈 레벨은 상위 차트주기의 프랙탈을 기반으로 정확한 지지 및 저항 수준을 구축하도록 설계된 강력한 도구로, 편리한 알림과 함께 매수 및 매도 신호를 제공합니다. 사용 방법: 이 인디케이터는 상위 차트주기의 프랙탈 레벨을 분석하여 현재 차트에 표시합니다. 지표 속성에서 선임 주기를 쉽게 조정하여 전략에 대한 정확성과 관련성을 극대화할 수 있습니다. 상위 차트주기를 기준으로 프랙탈 레벨을 사용할 때의 이점: 조기 신호 감지: 더 낮은 차트주기에서 더 높은 차트주기 프랙탈 레벨을 볼 수 있으므로 잠재적 매수 및 매도 신호를 초기에 식별할 수 있습니다. 수익/손실률 개선: 짧은 차트주기에 조기 진입하면 손절가를 더 짧게 설정할 수 있어 트레이딩 효율이 크게 향상됩니다. 편리한 알림: 중요한 신호를 놓치지 마세요 - 진입 및 청산 기회에 대한 알림을 즉시 받을 수 있습니다. 분석 정확도 향상: 정말 중요한 핵심 레벨에 집중하고 불필요한 시장 잡음은 무시하세요.
Pivot Points MT5 is a universal color multicurrency/multisymbol indicator of the Pivot Points levels systems. You can select one of its three versions: Standard Old, Standard New and Fibo . It plots pivot levels for financial instruments in a separate window . The system will automatically calculate the Pivot Point on the basis of market data for the previous day ( PERIOD_D1 ) and the system of support and resistance levels, three in each. A user can choose colors for the indicator lines. The on
LT Support Resistance - 지지와 저항을 100% 자동으로 식별 수동으로 지지와 저항선을 그리느라 귀중한 시간을 낭비하는 데 지치셨나요? 아니면 매번 중요한 레벨을 놓쳐서 답답하셨나요? LT Support Resistance는 이러한 번거로운 작업을 없애기 위해 개발되었습니다. 여러 타임프레임(시간족)을 동시에 분석하여, 거래 중인 자산의 가장 중요한 구역을 자동으로 식별하고 차트에 표시해 줍니다. == 중요 레벨의 스마트 자동화 == 주관적이고 시간이 오래 걸리는 수동 라인 작도 대신, 본 지표는 과거 가격 데이터를 분석하여 유의미한 반전 포인트를 식별하고, 가격이 '실제'로 신뢰하고 반응하는 지지 및 저항선을 그려줍니다. 그 결과 데이터에 기반한 객관적이고 신속한 분석이 가능해집니다. == 주요 특징 == 100% 자동 감지: 수동 분석 없이도 지지/저항 레벨 식별 멀티 타임프레임(MTF): M5 차트에서 H1, H4, D1, W1 레벨을 동시에 시각화 스마트 알
MetaHelper
Volodymyr Tseibei
This indicator automatically calculates and displays classic pivot points on your chart, helping identify key support and resistance levels for the current trading session. Features: · Plots Pivot (PP), Resistance 1-2 (R1, R2), and Support 1-2 (S1, S2) levels · Includes current close price line for reference · Color-coded lines: Blue for pivot, Red for resistances, Green for supports · Automatic calculation based on previous day's high, low, and close · Continuous lines across the chart for e
Pivot Price Round
Pablo Filipe Soares De Almeida
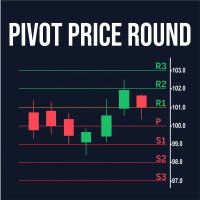
Pivot Round Price는 고전적인 Pivot Points(Classic Pivots) 공식을 기반으로 한 인디케이터로, 지지선, 저항선 및 중앙 피벗의 원래 계산을 그대로 유지하며 사용되는 표준 수학의 어떤 부분도 변경하지 않습니다. 이 인디케이터의 차이점이자 가장 큰 장점은 레벨이 자동으로 반올림된 가격으로 조정되어 소수 자릿수가 많은 자산에서도 시각화가 더욱 쉬워지고 실제 차트에서 레벨이 훨씬 더 의미 있게 보인다는 점입니다. 가격이 반올림되면 레벨이 더 이상 소수 값에 “묻히지” 않으며, 시장이 반응하거나 통합되는 지점에서 일반적인 심리적으로 중요한 영역과 일치하게 됩니다. 이 인디케이터에는 사용자의 스타일에 맞게 정확하게 조정할 수 있는 다양한 시각적 컨트롤이 포함되어 있습니다: LinesBehindCandles 모든 라인을 캔들 뒤에 그릴 수 있어, 차트를 깔끔하게 유지하고 가격 움직임을 방해하지 않습니다. RoundToNearestLevel 가장 가까운 가격으로
Support and Resistance ACPG
Victor Alfonso Molina Botello
Support And Resistance ACPG Indicator  The Support And Resistance ACPG Indicator  (developed by Grok by xAI) is an advanced tool for the MetaTrader 5 (MQL5) platform, designed to identify and visualize support and resistance zones on a price chart. Unlike traditional support and resistance indicators, the ACPG method combines a dynamic approach based on swing points, volatility analysis using the Average True Range (ATR), and an adaptive clustering system to detect high-relevance zones in the
FREE
시각적 추세 화살표, 유효 피벗 마커, 선택 가능한 구조 영역을 제공하는 깔끔한 MT5 시장 구조 기반 추세 감지 지표입니다. STS Structure Trend Detector는 가격 구조를 기반으로 시장 추세 방향을 감지하기 위한 깔끔한 MetaTrader 5 지표입니다. STS Structure Trend Detector는 현재 시장 구조를 차트에서 직접 확인하고 싶은 트레이더를 위해 설계되었습니다. 이 지표는 유효한 고점과 저점을 분석하고, 구조적인 추세 변화를 감지하며, 명확한 화살표, 피벗 마커, 선택 가능한 구조 구역으로 결과를 표시합니다. 이것은 Expert Advisor가 아니며, 거래를 열거나 닫거나 관리하지 않습니다. 이 지표는 시각적인 시장 구조 분석 지표일 뿐입니다. 재량 거래, 수동 분석 또는 트레이더 개인 전략의 추가 확인 도구로 사용할 수 있습니다. 주요 기능 시장 구조 기반 추세 감지 상승 추세와 하락 추세를 나타내는 시각적 화살표 차트 위의 유효 고점
Unlock the power of Fibonacci with our advanced indicator! This tool precisely plots Fibonacci levels based on the previous day's high and low, identifying the next day's key support and resistance levels. Perfect for day trading and swing trading, it has consistently generated weekly profits for me. Elevate your trading strategy and seize profitable opportunities with ease. NOTE: In the Input section make sure the draw labels are set to "True" so you can see each levels.
My Pivot
Ashok Kumar Singha
My Pivot is an Indicator based on Pivot Lines and Support-Resistance zones. This Indicator will Plot 11 SR zones including Pivot Line which will definitely help you to understand the exact SR zones of the Market. Steps to Setup the Indicator: Install the Custom Indicator; Set all the Lines Color, Width and Styles; Set visualization to All Timeframe; and DONE It can be used for: All Pairs: Forex, Cryptocurrencies, Metals, Stocks, Indices.  All Timeframe All Brokers All type of Trading S
Smart Trendlines MT5
Suvashish Halder
5 (3)
Smart Trendlines – No.1 Trendlines Indicator Smart Trendlines is a precision tool that automatically draws trendlines based on every valid pivot point, helping traders identify key support and resistance zones. It continuously adjusts as new market pivots form, providing a live and accurate reflection of price structure. Whether you’re tracking trends, preparing for reversals, or anticipating breakouts — this indicator keeps you one step ahead. It works seamlessly across all assets including For
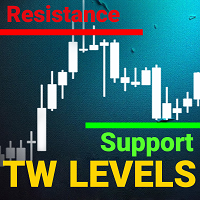
support resistance levels indicator   mt5: 이 도구는 차트에서 지원 및 저항선과 피보나치 수준을 식별하고 플롯하는 다중 시간대 지표로, 인간의 눈과 동일한 정확도로 작동합니다. TW 외환 지원 및 저항 수준은 복잡한 알고리즘을 갖추고 있어 차트를 스캔하여 이전 가격 안정화 및 반등 수준을 식별하고 터치 횟수를 기록합니다. 수동으로 지원 및 저항 수준과 피보나치 되돌림을 그리는 데 지치셨습니까? 이 제품의 기능을 확인해 보세요. 놀라울 것입니다. 제품 특징: 1. 소규모 및 대규모 수준: 고급 알고리즘을 사용하여 소규모 및 대규모 수준을 사용자 취향에 맞게 사용자 정의하고 추가 수준을 제거할 수 있습니다. 2. 수준 터치 횟수: TW 지원 저항 수준과 브레이크 mt5, 각 수준이 과거에 몇 번 터치되었는지 계산하여 제공하여 각 수준의 강도를 평가할 수 있습니다. 3. 피보나치 수준: 마지막 파도의 피보나치 수준이 동적으로 그려져, 이러한
KT Auto Trendline MT5
KEENBASE SOFTWARE SOLUTIONS
KT Auto Trendline draws the upper and lower trendlines automatically using the last two significant swing highs/lows. Trendline anchor points are found by plotting the ZigZag over X number of bars. Features No guesswork requires. It instantly draws the notable trendlines without any uncertainty. Each trendline is extended with its corresponding rays, which helps determine the area of breakout/reversal. It can draw two separate upper and lower trendlines simultaneously. It works on all timeframe
BTFX Pivot Points
Bradley Thomas Farrington
The BTFX Pivot Points is an indicator which calculates the Support and Resistance levels for each day. By using this indicator the pivot levels point out clear targets to aim for. The resistance levels are shown in purple above the silver pivot line. The support levels are shown in Orange and can be found below the silver pivot line. This indicators works very well when used with The BTFX Daybreak Indicator. For a more in depth explanation of these indicators please watch the Youtube video attac
Easy Indy
Vinutthapon Bumroong
This indicator automatically draws trendlines, Fibonacci levels, support and resistance zones, and identifies BOS (Break of Structure) and CHOCH (Change of Character) patterns on the chart. Just by placing it on the graph, it handles the essential technical analysis tasks for traders, providing a streamlined, effective trading tool this tools is alway make every one easy for trading.
FVG Sessions
Thi Thanh Huong Vo
The FVG Sessions indicator highlights the first fair value gap of the trading session as well as the session range. Detected fair value gaps extend to the end of the trading session. Alerts are included on the formation of a session fair value gap, price being within a session fair value gap, mitigations, and price crossing session fair value gaps average. Trader ICT states that the first fair value gap of the trading session can attract the most significant reaction. Having only one FVG per
MT4 버전: https://www.mql5.com/en/market/product/157679 MT5 버전: https://www.mql5.com/en/market/product/157680 지지선/저항선 - 스마트 시장 구조 레벨 전문 트레이더와 자동화 시스템을 위해 설계된 깔끔하고 지능적이며 신뢰성 높은 지지선 및 저항선 지표입니다. 지지선/저항선은 프랙탈, ATR 기반 가격 세분화, 다중 시간대 분석을 결합한 고급 클러스터링 알고리즘을 사용하여 실제 시장 레벨을 감지하도록 설계되었습니다. 이 지표는 무작위 또는 노이즈가 있는 선을 그리는 대신, 가격이 반복적으로 반응한 통계적으로 검증된 레벨을 생성합니다. 따라서 재량 거래, 알고리즘 거래, 위험 관리 및 돌파 검증에 이상적입니다. 주요 기능 고급 지지/저항 엔진 ATR 스케일 그리드 분할 사용 상단 및 하단 프랙탈을 클러스터링하여 매우 정확한 구조적 레벨 생성 정확도 모드(높음/중간/낮음)를 사용하여 노이즈 필터링
To review our products, please click the link: LINK This Classic Pivot Point Indicator accurately calculates and displays 7 essential pivot levels , including the Pivot Point , 3 Support levels (S1–S3) , and 3 Resistance levels (R1–R3) based on the standard classic pivot formula . Designed for Forex, indices, commodities, and crypto trading , it supports multi-currency and multi-timeframe analysis in a clean, professional dashboard interface . With the built-in interactive dashboard , traders c
Fibonacci Auto Levels Pro MT5 – 되돌림, 확장 및 피봇 포인트 (Pivot Points) Fibonacci Auto Levels Pro MT5는 시장의 스윙 포인트를 자동으로 감지하고 차트에 완전한 피보나치 되돌림 (Retracement), 확장 (Extension) 및 피봇 포인트 (Pivot Point) 구조를 그리는 고급 기술 분석 도구입니다. 이 지표는 여러 독립적인 시스템을 하나의 통합된 분석 도구로 결합합니다. 피봇 포인트 (피보나치 모드) 피봇 포인트는 이전 기간의 가격 범위를 기반으로 잠재적인 지지 및 저항 영역을 식별하는 데 사용됩니다. 이 지표는 이전 고가 (High), 저가 (Low), 종가 (Close)에 피보나치 비율을 적용하여 계산되는 피보나치 피봇 포인트 를 사용합니다. 피봇 포인트의 시간대는 수동으로 설정하거나 다음 로직을 사용하여 자동으로 설정할 수 있습니다. 일중 거래 ≤ 5분 → 4시간 5–45분 → 1일 45분–4시간 →
NEXA Pivot Rebound Basic 1. 개요 NEXA Pivot Rebound Basic은 일일 피벗 레벨(S1, R1)을 기준으로 가격의 반등 가능성을 탐지하는 Expert Advisor입니다. 이 제품은 MetaTrader 5 플랫폼에서 작동하며, M15 차트 기준으로 설계되었습니다. 전일 고가, 저가, 종가를 기반으로 계산된 피벗 레벨과 RSI 및 Stochastic 보조지표를 함께 사용하여 진입 조건을 구성합니다. 본 제품은 자동 매매 전략 연구 및 트레이딩 자동화를 위한 도구입니다. 2. 전략 개요 전략은 다음 요소를 조합하여 신호를 생성합니다. 전일 기준 Pivot Point 계산 S1 / R1 레벨 접근 여부 확인 RSI 보조지표 Stochastic 교차 조건 최근 스윙 고점/저점 기반 손절 설정 고정 비율 기반 이익 목표(RR) 매수 조건은 가격이 S1 근처에 도달하고, 보조지표 조건이 충족될 때 발생합니다. 매도 조건은 가격이 R1 근처에 도달하고, 보조지
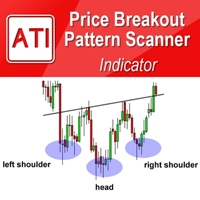
Price Breakout pattern Scanner is the automatic scanner for traders and investors. It can detect following patterns automatically from your chart. Head and Shoulder - Common tradable pattern. Reverse Head and Shoulder - This pattern is the reverse formation of the Head and Shoulder. Double Top - When the price hits resistance level twice and decline toward the support level, the trader can anticipate sudden bearish breakout through the support level. Double Bottom - The double bottom pattern is
AUTO FIBONACCI MULTI-TIMEFRAME TOOLKIT Technical analysis tool that automatically draws Fibonacci levels for 4H, Daily, Weekly, and Monthly sessions. AUTOMATIC FIBONACCI RETRACEMENTS (7 CLASSIC LEVELS): - 0.0% (Previous session Low - support level) - 23.6% (Fibonacci Golden Ratio - early entry level) - 38.2% (Strong retracement level) - 50.0% (Key pivot level highlighted in YELLOW - market equilibrium) - 61.8% (Main Golden Ratio - critical decision level) - 78.6% (Deep retracement level) - 100.0
Created by imjesstwoone and mickey1984, this trade model attempts to capture the expansion from the 10:00-14:00 EST 4h candle using just 3 simple steps. All of the information presented in this description has been outlined by its creators, all I did was translate it to MQL5. All core settings of the trade model may be edited so that users can test several variations, however this description will cover its default, intended behavior using NQ 5m as an example. Step 1 is to identify our Price Ra
Monthly Open Liquidity Tracker Description Monthly Open Liquidity Tracker is a professional MetaTrader 5 indicator designed to monitor Monthly Open levels and automatically detect Liquidity Sweeps occurring around these key institutional price zones. The indicator displays the most recent Monthly Open and Monthly Close levels, calculates the distance between them in points, and highlights areas where market liquidity has been captured before a directional move. Features   Display of Monthly O
A pivot point is   an intraday technical indicator used to identify trends and reversals mainly in equities, commodities, and forex markets . Pivot points are calculated to determine levels in which the sentiment of the market could change from bullish to bearish, and vice-versa. the swing daily is an advanced pivot points indicator that grants the user control over many aspects of the trading levels that you'll get familiar with in the controls section  it's used mainly to locate intraday tr
这是一个基于前一个交易日的最高价、最低价和收盘价来计算的枢轴点指标,具体公式如下: 计算前一日的 Pivot Point (枢轴点): Pivot = (High + Low + Close) / 3 计算 Resistance 1 (R1) 、 Support 1 (S1) ​ 等: R1 = (2 * Pivot) - Low S1 = (2 * Pivot) - High R2 = Pivot + (High - Low) S2 = Pivot - (High - Low) 与市面上其他的枢轴点指标相比,该指标主要有以下4个特点: 1、可以修改交易日的开始时间; 2、可以设定支撑压力线的颜色; 3、可以设定是否显示各个支撑压力线对应的价格; 4、可以设定天数用以显示枢轴点的历史记录; 开发这个指标的最初目的是为了解决设定交易日开始时间的问题,接下来会进一步说明。基于计算公式,我们需要获得上一个交易日的最高价、最低价和收盘价,在夏令时,北京时间6点是开市时间,大多数交易平台服务器的0点对应的是北京时间的6点,但是香港的服务器6点才是对应的是北京时间的6点。如果你有多个平台,且存在
Heiken Ashi Supertrend Combine
Tri Yasin Satrio Adji Pranoto
Headline: Stop Guessing, Start Winning. Unleash the Power of the Heiken Ashi Supertrend Indicator. Body: Are you tired of market noise, confusing charts, and missed opportunities? The Heiken Ashi Supertrend Indicator is the ultimate tool designed to bring clarity and confidence to your trading, once and for all. We've combined two of the most powerful concepts in technical analysis into one seamless, easy-to-use indicator: Crystal-Clear Trends with Heiken Ashi: Say goodbye to choppy price action
This indicator is a **Pivot-Confluence Zone Identifier** that focuses exclusively on identifying key support and resistance levels where price clusters align with classic pivot points. Here's what it does: ## Core Functionality **Pivot Confluence Detection**:  - Only displays price zones that align with classic pivot point levels (R1, R2, R3, S1, S2, S3) - **Excludes the main pivot point** - focuses only on support and resistance levels - Uses a configurable pip range to detect confluence nea
FREE
Pivot Math Support and Resistance Lines indicator — indicator showing pivot lines, which will definitely help every trader who knows how to trade with resistance, support and pivot lines. It shows 8 different lines (additional lines are also possible) on the main chart, helping you find the best points to buy, sell and exit positions.  Input parameters: P (default = 64) — period in bars or other periods (set using MMPeriod), on which the lines will be calculated. The smaller this number, the "f
이 제품의 구매자들이 또한 구매함
ARIPoint
Temirlan Kdyrkhan
1 (1)
ARIPoint is a powerful trading companion designed to generate high-probability entry signals with dynamic TP/SL/DP levels based on volatility. Built-in performance tracking shows win/loss stats, PP1/PP2 hits, and success rates all updated live. Key Features: Buy/Sell signals with adaptive volatility bands Real-time TP/SL/DP levels based on ATR Built-in MA Filter with optional ATR/StdDev volatility Performance stats panel (Success, Profit/Loss, PP1/PP2) Alerts via popup, sound, push, or email Cu
MT5 Indicator See What the Market Is Really Doing, See the 3 Market Phases Live in front of you (Contraction, Expansion, Trend Phases) and have Better Entries at the Early Stage in the Trend Phase. Stop guessing . Start reading the market like the institutions, Smart Money do. Apex Market Structure Pro Indicator for MT5 is a precision smart-money analysis tool that strips away the noise and shows you the true structure beneath every candle, liquidity, structure shifts, accumulat
Zain v4 With artificial intelligence
Haitham Gamal Abdelnaser Mohamed
### **Zain Gold V4 - AI-Powered Trading Dashboard** **Overview:** Zen Gold V4 is our latest professional technical analysis indicator for the MetaTrader 5 platform, featuring an advanced AI-powered dashboard. Specifically designed for gold (XAUUSD) and major currency pairs, this tool provides actionable insights to help you make informed trading decisions. **Key Features:** * **AI-Powered Dashboard:** An advanced analytical dashboard that processes real-time market data, optimized specifical
PrimeScalping
Temirlan Kdyrkhan
PrimeScalping is a powerful trading companion designed to generate high-probability entry signals with dynamic TP/SL/DP levels based on volatility. Built-in performance tracking shows win/loss stats, PP1/PP2 hits, and success rates — all updated live. Key Features: Buy/Sell signals with adaptive volatility bands Real-time TP/SL/DP levels based on ATR Built-in MA Filter with optional ATR/StdDev volatility Performance stats panel (Success, Profit/Loss, PP1/PP2) Alerts via popup, sound, push, or e
ScalpPoint
Temirlan Kdyrkhan
ScalpPoint is a powerful trading companion designed to generate high-probability entry signals with dynamic TP/SL/DP levels based on volatility. Built-in performance tracking shows win/loss stats, PP1/PP2 hits, and success rates — all updated live. Key Features: Buy/Sell signals with adaptive volatility bands Real-time TP/SL/DP levels based on ATR Built-in MA Filter with optional ATR/StdDev volatility Performance stats panel (Success, Profit/Loss, PP1/PP2) Alerts via popup, sound, push, or emai
VTrende Pro
Andrii Diachenko
5 (1)
VTrende Pro - MTF indicator for trend trading with a display panel for MT5 *** Videos can be translated into any language using subtitles (video language - Russian) Although the signals of the VTrende Pro indicator can be used as signals of a full-fledged trading system, it is recommended to use them in conjunction with the Bill Williams TS. VTrende Pro is an extended version of the VTrende indicator. Difference between Pro version and VTrende: - Time zones - Signal V - signal 1-2 waves -    S
SmartScalping
Temirlan Kdyrkhan
SmartScalping is a powerful trading companion designed to generate high-probability entry signals with dynamic TP/SL/DP levels based on volatility. Built-in performance tracking shows win/loss stats, PP1/PP2 hits, and success rates — all updated live. Key Features: Buy/Sell signals with adaptive volatility bands Real-time TP/SL/DP levels based on ATR Built-in MA Filter with optional ATR/StdDev volatility Performance stats panel (Success, Profit/Loss, PP1/PP2) Alerts via popup, sound, push, or e
TrendProMaster
Temirlan Kdyrkhan
MasterTrend Indicator for MT5 A powerful trend-following and signal-evaluation tool MasterTrend   is a custom MT5 indicator that combines Moving Averages and ATR-based risk/reward logic to generate clear buy/sell signals. It visualizes dynamic SL/TP levels, evaluates past trade outcomes, and displays win/loss statistics in a clean on-chart panel. Key features include: Buy/Sell signals based on MA crossovers ATR-based SL/TP1/TP2/TP3 levels with visual lines and labels Signal outcome tracking wit
MasterTrend
Temirlan Kdyrkhan
MasterTrend Indicator for MT5 A powerful trend-following and signal-evaluation tool MasterTrend   is a custom MT5 indicator that combines Moving Averages and ATR-based risk/reward logic to generate clear buy/sell signals. It visualizes dynamic SL/TP levels, evaluates past trade outcomes, and displays win/loss statistics in a clean on-chart panel. Key features include: Buy/Sell signals based on MA crossovers ATR-based SL/TP1/TP2/TP3 levels with visual lines and labels Signal outcome tracking wit
ZIVA Signal Intelligence
Hassan Abdullah Hassan Al Balushi
ZIVA Signal Intelligence An Adaptive, Modular Market Intelligence System ZIVA Signal Intelligence is not positioned as a conventional trading indicator. It is a fully integrated, proprietary market intelligence system engineered to deliver structured, high-precision interpretation of price behavior within a controlled analytical environment. Developed through an independent architectural approach, ZIVA does not rely on, derive from, or replicate existing indicators. It represents a standalone
MetaTrader 5용 스마트 다층 브레이크아웃 및 풀백 탐지기 "스마트하고, 간단하고, 빠르게!" 고확률 브레이크아웃 진입을 놓치는 것에 지치셨나요? 여러 차트를 몇 시간씩 스캔하면서 브레이크아웃을 추세 방향과 통화 모멘텀에 맞추려고 하지만 — 결국 움직임을 놓치고 마나요? Break Pullback은 하나의 지표로 이 모든 문제를 해결합니다. Break Pullback이란 무엇인가요? Break Pullback은 시장 구조, 브레이크아웃, 추세 지속 설정을 거래하는 트레이더를 위해 특별히 설계된 전문가급 MetaTrader 5 지표입니다. 실시간으로 여러 통화 쌍에 걸쳐 Break와 Pullback 형성을 자동으로 감지하고 — 세 가지 확인 레이어를 통해 모든 신호를 필터링합니다: 구조적 브레이크아웃 탐지 — 차트의 주요 브레이크 레벨 식별 HTF 일봉 바이어스 — 진입을 지배적인 일봉 추세 방향에 맞춤 통화 강도 지수 — 쌍을 이룬 통화 간의 모멘텀 불균형 확인 결과: 오
Meravith Scanner
Ivan Stefanov
5 (2)
MERAVITH SCANNER는 MetaTrader 5용 전문 금융 시장 지표로, 여러 분석 도구를 하나의 통합 시스템으로 결합합니다. 독점적인 거래량 가중 평균 가격(VWAP) 방법론을 사용하여 모든 계산을 자동으로 수행하며, 주관적인 해석을 완전히 배제합니다. 이 지표는 모든 자산 클래스(Forex, 주식, 지수, 상품, 암호화폐)와 M1부터 월간 차트까지 모든 시간 프레임에서 작동합니다. 기본 원리는 “가격은 거래량을 따른다”입니다. MERAVITH는 기관 거래량이 집중되는 위치를 식별하고, 그 집중에서 수학적으로 정확한 가격 수준을 도출합니다. 예측이나 투기를 하지 않으며, 계산만 수행합니다. MERAVITH SCANNER를 사용하면 28개의 주요 Forex 통화쌍을 모든 시간 프레임에서 단 2~3분 만에 스캔할 수 있습니다. 또한 원하는 시장을 스캔할 수도 있으며, 예를 들어 약 100개의 주식을 약 10분 안에 스캔할 수 있습니다. 지표는 소진 레벨, 균형선, 편차, 통계
ARICoins
Temirlan Kdyrkhan
ARICoin is a powerful trading companion designed to generate high-probability entry signals with dynamic TP/SL/DP levels based on volatility. Built-in performance tracking shows win/loss stats, PP1/PP2 hits, and success rates all updated live. Key Features: Buy/Sell signals with adaptive volatility bands Real-time TP/SL/DP levels based on ATR Built-in MA Filter with optional ATR/StdDev volatility Performance stats panel (Success, Profit/Loss, PP1/PP2) Alerts via popup, sound, push, or email Cust
FX Analysis
Lee Teik Hong
FX Analysis is an all-in-one MT5 indicator dashboard that combines eight analytical tools in a single panel, helping traders identify high-probability setups without switching between charts or indicators. Designed for standard forex pairs on MetaTrader 5. Best results on M15 - H4 timeframes when all components are used together as part of the included workflow. Components Volatility Analyzer Displays historical average movement by hour and by day of the week. A real-time Pip Balance shows the
IVISTscalp5
Vadym Zhukovskyi
5 (6)
[iVISTscalp5]: 시간을 통한 시장 행동 연구소 TLV Framework | Liquidity Activation Points ⸻ 개요 iVISTscalp5는 VISTmany 프로젝트 내에서 개발된 다중 레벨 타이밍 및 가격 구조 인디케이터입니다. 이 시스템은 Liquidity Activation Points(타이밍)를 통해: 움직임이 발생하는 시간 방향 가격 움직임의 범위 를 예측합니다. iVISTscalp5 인디케이터는 기본 설정만으로도 모든 금융상품에 사용할 수 있습니다. ⸻ 실질적 가치 iVISTscalp5는 일반적인 기술적 지표로 만들어진 것이 아닙니다. 개발의 핵심 아이디어는 다음과 같습니다. 누구나 시간을 통해 시장 행동을 연구할 수 있도록 하는 것. ⸻ Time Language VISTmany (TLV) — 프로젝트의 핵심 개념 t(p) t(p)는 타이밍이 활성화되는 가격 레벨입니다. ⸻ p(p) p(
Triple Crox Strategy
issam rahhal sabour
Triple Crox Strategy v4.10 Triple Crox Strategy v4.10 Professional MetaTrader 5 Indicator 13 Patterns • Fibonacci • CLUSTER ML • Multi-Filter 1. Overview Advanced MT5 indicator combining 13 Pattern Detection , Fibonacci Analysis , CLUSTER Machine Learning and Multi-Filter system for precise signals on Forex, indices, commodities, crypto. 5-step pipeline: indicators → filter → patterns → signals → levels. 2. Trading Setup Heikin-Ashi colored bars. Buy/Sell arrows with Entry, TP1(1x ATR), TP2(2x
Red and Green Light – Intelligent Trading Signal Indicator Product Overview Red and Green Light is a professional trading signal indicator based on the multi-stage T3 smoothing algorithm. It integrates a visual traffic light system, intelligent signal recognition, risk alerts, and multiple notification features. Whether you're a manual trader or an Expert Advisor (EA) developer, this indicator helps you capture market opportunities with greater precision and effectively avoid the risks of
Pan PrizMA CD Phase
Aleksey Panfilov
The Expert Advisor and the video are attached in the Discussion tab . The robot applies only one order and strictly follows the signals to evaluate the indicator efficiency. Pan PrizMA CD Phase is an option based on the Pan PrizMA indicator. Details (in Russian). Averaging by a quadric-quartic polynomial increases the smoothness of lines, adds momentum and rhythm. Extrapolation by the sinusoid function near a constant allows adjusting the delay or lead of signals. The value of the phase - wave s
Классификатор силы тренда. Показания на истории не меняет. Изменяется классификация только незакрытого бара. По идее подобен полной системе ASCTrend, сигнальный модуль которой, точнее его аппроксимация в несколько "урезанном" виде, есть в свободном доступе, а также в терминале как сигнальный индикатор SilverTrend . Точной копией системы ASCTrend не является. Работает на всех инструментах и всех временных диапазонах. Индикатор использует несколько некоррелируемых между собой алгоритмов для класси
FFx Universal Strength Meter PRO is more than a basic strength meter. Instead of limiting the calculation to price, it can be based on any of the 19 integrated strength modes + 9 timeframes. With the FFx USM, you are able to define any period for any combination of timeframes. For example, you can set the dashboard for the last 10 candles for M15-H1-H4… Full flexibility! Very easy to interpret... It gives a great idea about which currency is weak and which is strong, so you can find the best pai
The FFx Universal MTF alerter shows on a single chart all the timeframes (M1 to Monthly) with their own status for the chosen indicator. 9 indicators mode (MACD-RSI-Stochastic-MA-ADX-Ichimoku-Candles-CCI-PSAR). Each can be applied multiple times on the same chart with different settings. Very easy to interpret. Confirm your BUY entries when most of the timeframes are showing green color. And confirm your SELL entries when most of the timeframes are showing red color. 2 Alert Options : input to s
FFx Watcher Pro MT5
Eric Venturi-Bloxs
The FFx Watcher PRO is a dashboard displaying on a single chart the current direction of up to 15 standard indicators and up to 21 timeframes. It has 2 different modes: Watcher mode: Multi Indicators User is able to select up to 15 indicators to be displayed User is able to select up to 21 timeframes to be displayed Watcher mode: Multi Pairs User is able to select any number of pairs/symbols User is able to select up to 21 timeframes to be displayed This mode uses one of the standard indicators
FFx Patterns Alerter gives trade suggestions with Entry, Target 1, Target 2 and StopLoss .... for any of the selected patterns (PinBar, Engulfing, InsideBar, OutsideBar) Below are the different options available: Multiple instances can be applied on the same chart to monitor different patterns Entry suggestion - pips to be added over the break for the entry 3 different options to calculate the SL - by pips, by ATR multiplier or at the pattern High/Low 3 different options to calculate the 2 TPs -
FFx Basket Scanner MT5
Eric Venturi-Bloxs
MetaTrader 4 version available here : https://www.mql5.com/en/market/product/24881 FFx Basket Scanner is a global tool scanning all pairs and all timeframes over up to five indicators among the 16 available. You will clearly see which currencies to avoid trading and which ones to focus on. Once a currency goes into an extreme zone (e.g. 20/80%), you can trade the whole basket with great confidence. Another way to use it is to look at two currencies (weak vs strong) to find the best single pairs
MetaTrader 4 version available here: https://www.mql5.com/en/market/product/25793 FFx Pivot SR Suite PRO is a complete suite for support and resistance levels. Support and Resistance are the most used levels in all kinds of trading. Can be used to find reversal trend, to set targets and stop, etc. The indicator is fully flexible directly from the chart 4 periods to choose for the calculation: 4Hours, Daily, Weekly and Monthly 4 formulas to choose for the calculation: Classic, Camarilla, Fibonac
ClassicSBA
Umri Azkia Zulkarnaen
this indicator very simple and easy if you understand and agree with setup and rule basic teknical sba you can cek in link : please cek my youtube channel for detail chanel : an for detail info  contact me  basicly setup buy (long) for this indicator is Magenta- blue and green candle or magenta - green  and green candlestik and for setup sell (short) is Black - yellow - and red candle or black - red  and red candlestik
Pendiente de Precio
Cesar Juan Flores Navarro
Indicador en base a la pendiente de la linea de precio, dibuja una línea de color cuando sube a base de los precios que previamente has sido procesados o linealizados, y cuando baja la pendiente la linea linealizada toma otro color. En este caso se a considerado 6 lineas de diferentes procesos desde pendientes largas hacia las cortas, observándose que cuando coincidan las pendientes se produce un máximo o mínimo, lo que a simple vista nos permitirá hacer una COMPRA O VENTA.
WanaScalper
Isaac Wanasolo
1 (1)
A scalping indicator based on mathematical patterns, which on average gives signals with relatively small SL, and also occasionally helps to catch big moves in the markets (more information in the video) This indicator has three main types of notifications: The first type warns of a possible/upcoming signal on the next bar The second type indicates the presence of a ready signal to enter the market/open a position The third type is for SL and TP levels - you will be notified every time price re
Индикатор Coefficient Of Determination (COD) представляет собой значение коэффициента детерминации или квадрат коэффициента корреляции между зависимой переменной — ценой и объясняющей переменной — тиковым объемом. Что это дает нам на практике? COD отлично распознает кульминацию трендовых движений, что позволяет подбирать оптимальные точки и ловить развороты рынка. Как использовать индикатор: Наиболее популярная торговая стратегия строится совместно с трендовым индикатором Moving Average (MA), пе
Fibonacci Multiple 12
Cesar Juan Flores Navarro
Fibonacci Múltiple 12, utiliza la serie fibonacci plasmado en el indicador fibonacci, aumentadolo 12 veces según su secuencia. El indicador fibonacci normalmente muestra una vez, el presente indicador se mostrara 12 veces empezando el numero que le indique siguiendo la secuencia. Se puede utilizar para ver la tendencia en periodos cortos y largos, de minutos a meses, solo aumentado el numero MULTIPLICA.
제작자의 제품 더 보기
SR Zones & Pivot Panel EA - All-in-One Trading Tool SR Zones & Pivot Panel EA is a powerful hybrid tool that combines automatic Support/Resistance Zones , Daily Pivot Points , and a Compact Trading Panel into one interface. It helps traders visualize key price levels on any timeframe while executing trades quickly and efficiently. Designed for precision and speed, this tool keeps your chart clean while providing all the data you need for intraday trading. Key Features 1. Automatic Support
FREE
필터:
리뷰 없음
리뷰 답변