AllTrendLines
- 지표
-
Evgeniy Zhdan
 ➖➖➖➖➖➖➖➖➖➖➖➖➖➖➖➖➖➖➖➖➖➖
Products: https://www.mql5.com/en/users/trendhunter/seller
➖➖➖➖➖➖➖➖➖➖➖➖➖➖➖➖➖➖➖➖➖➖ - 버전: 2.0
- 업데이트됨: 3 2월 2026
- 활성화: 10
Brief Description of the All Trend Lines Indicator
The indicator analyzes the wave structure of the market.
What it displays on the chart:
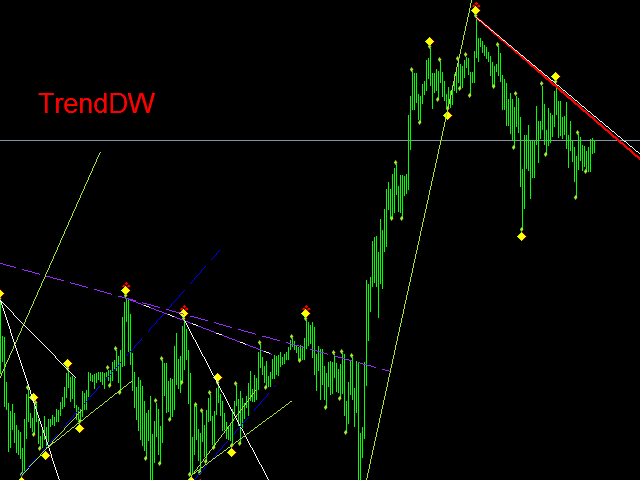
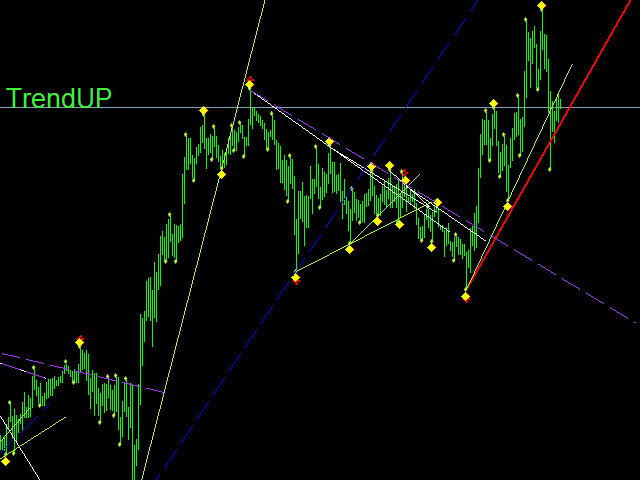
First. Wave pivots (semaphores)
• Red markers – wave highs
• Yellow markers – wave lows
• Yellow-green markers – additional local extremes
Second. Trend lines
• Purple/blue lines – trends based on highs (resistance/support)
• Beige/green lines – trends based on lows
• Lines are built automatically by connecting wave pivots of the same type
Third. Main trend line
• Red line – projected main trend line
• Built through the latest significant pivots with extrapolation
Fourth. Trend direction text
• “TrendUP” (green) – uptrend
• “TrendDW” (red) – downtrend
The indicator is useful for visualizing the wave structure, identifying support and resistance levels, and determining the direction of the main trend.
Parameters
- Show trend line - show the main trend line.
- Main Trend Line Color - color of the trend line.
- Show trend text - show the trend direction text.
- Resistance High line color - color of the resistance lines of the smallest TF.
- Support High line color - color of the upper support lines of the smallest TF.
- Resistance Low line color - color of the resistance lines of the current and higher TF.
- Support Low line color - color of the support lines of the current and higher TF.
- Alarm wave peaks - alert when a reversal point forms.
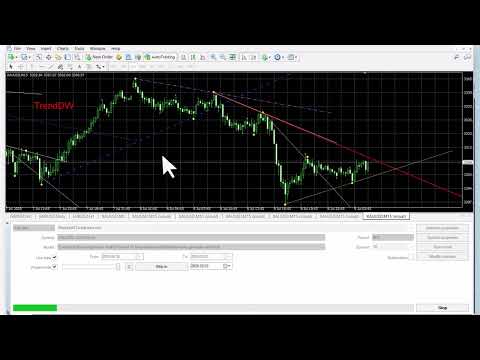

Subject: MT5 build incompatibility After the recent MT5 update, your indicator no longer loads on the chart. It consistently returns error, making the product completely unusable. This issue occurs on the latest official MT5 build, not due to user misconfiguration. As a Market-paid product, it is expected to remain compatible with current MT5 versions. Please update and recompile the indicator as soon as possible. If this issue cannot be resolved promptly, I will have no choice but to request an official refund via MetaQuotes Market.