SessionRangeBox
- 지표
-
Alexandre Vincent Traber
 MetaTrader 5용 엑스퍼트 어드바이저 개발을 전문으로 하는 알고리즘 트레이딩 개발자.
원자재 트레이딩 학습 배경을 바탕으로 외환, 금/은, 지수의 체계적 전략에 적용. 백테스트 수익 극대화보다는 완만한 자산 곡선을 가진 견고하고 최적화 검증된 로봇 개발에 중점을 둡니다. 자체 개발한 과최적화 방지 스코어링 시스템(자산 곡선 안정성, 드로다운 제어, 시간적 일관성)을 전체 EA 라인업에 점진적으로 통합하여, 실계좌 적용 전 과최적화된 결과를 걸러냅니다. - 버전: 1.0
Session Range Box — Session High/Low Visualizer
Overview
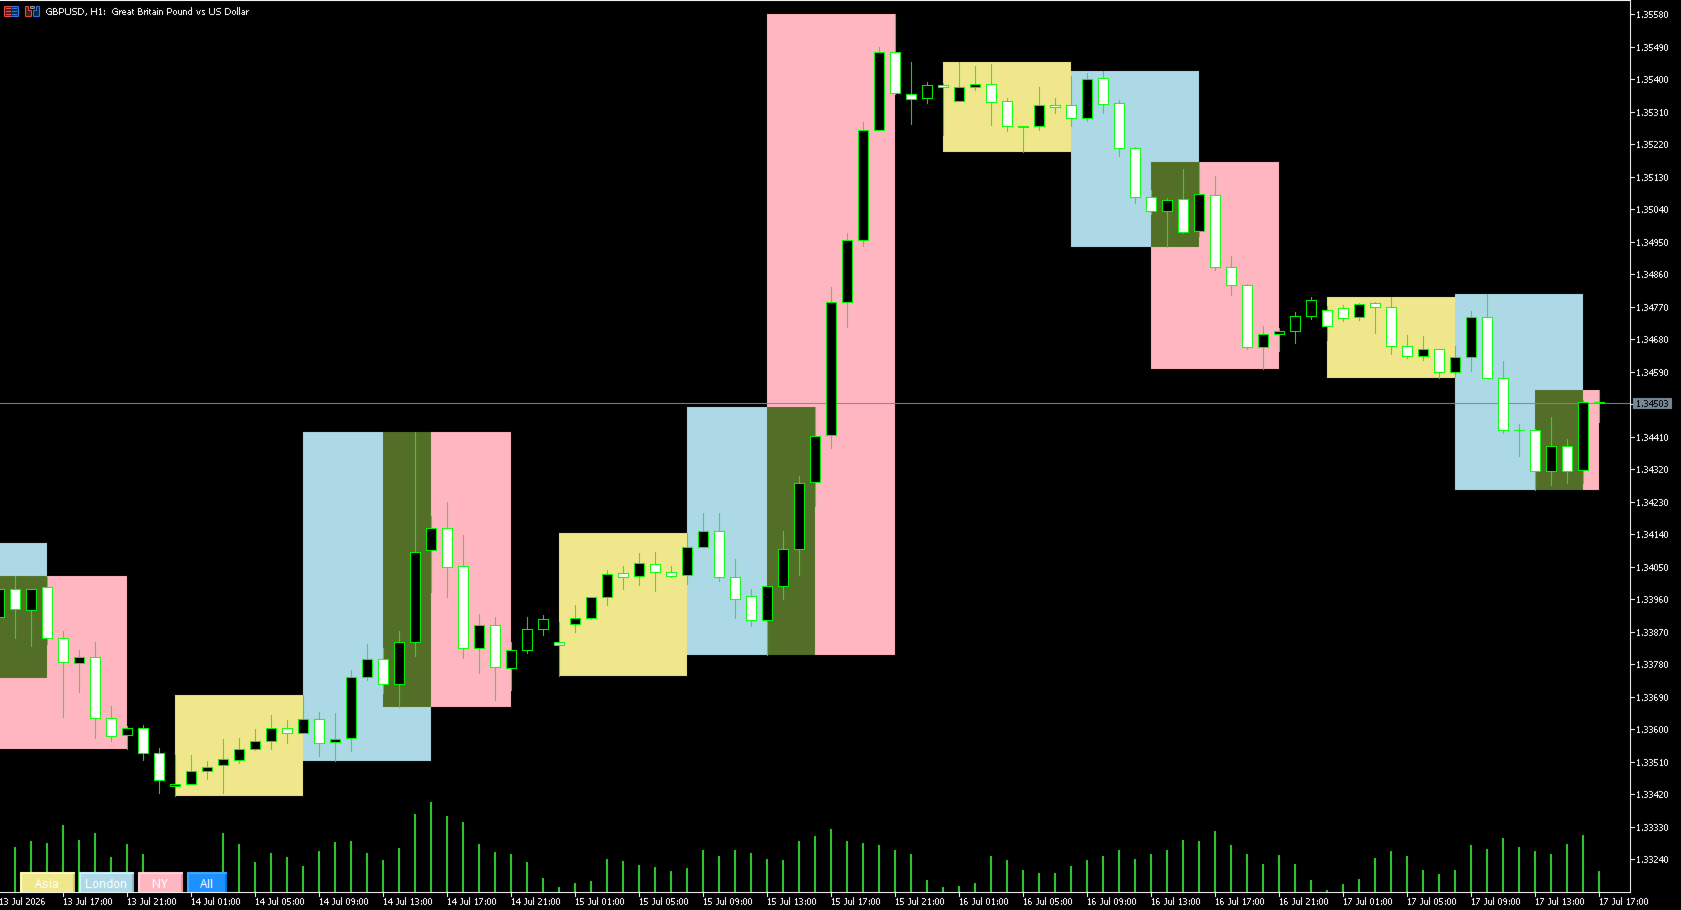
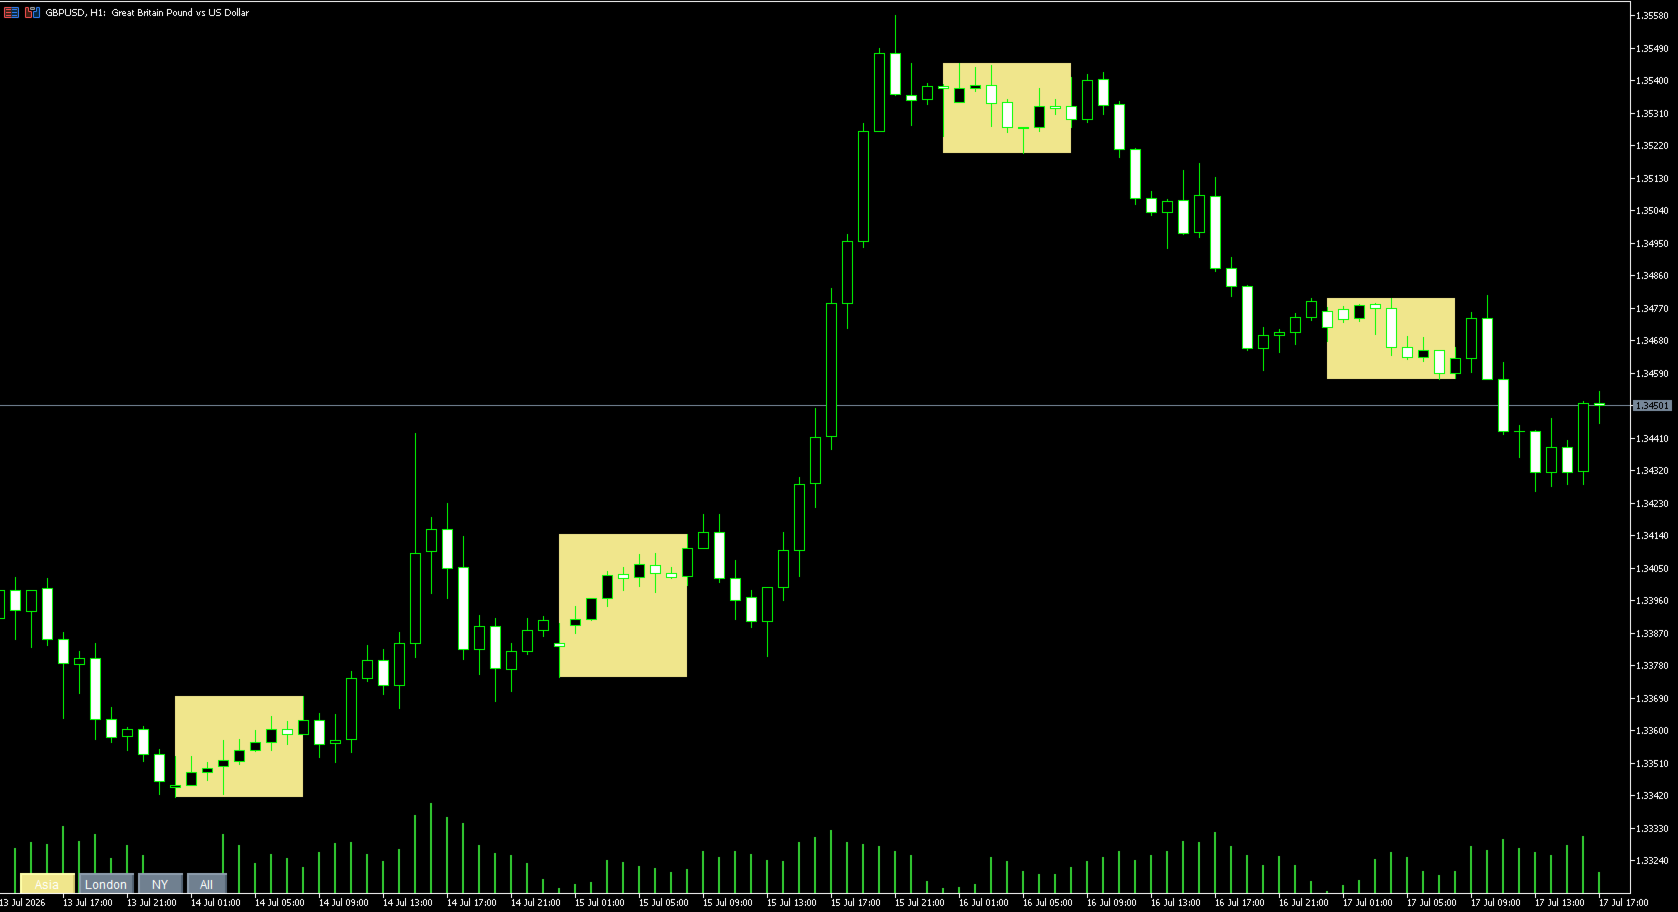
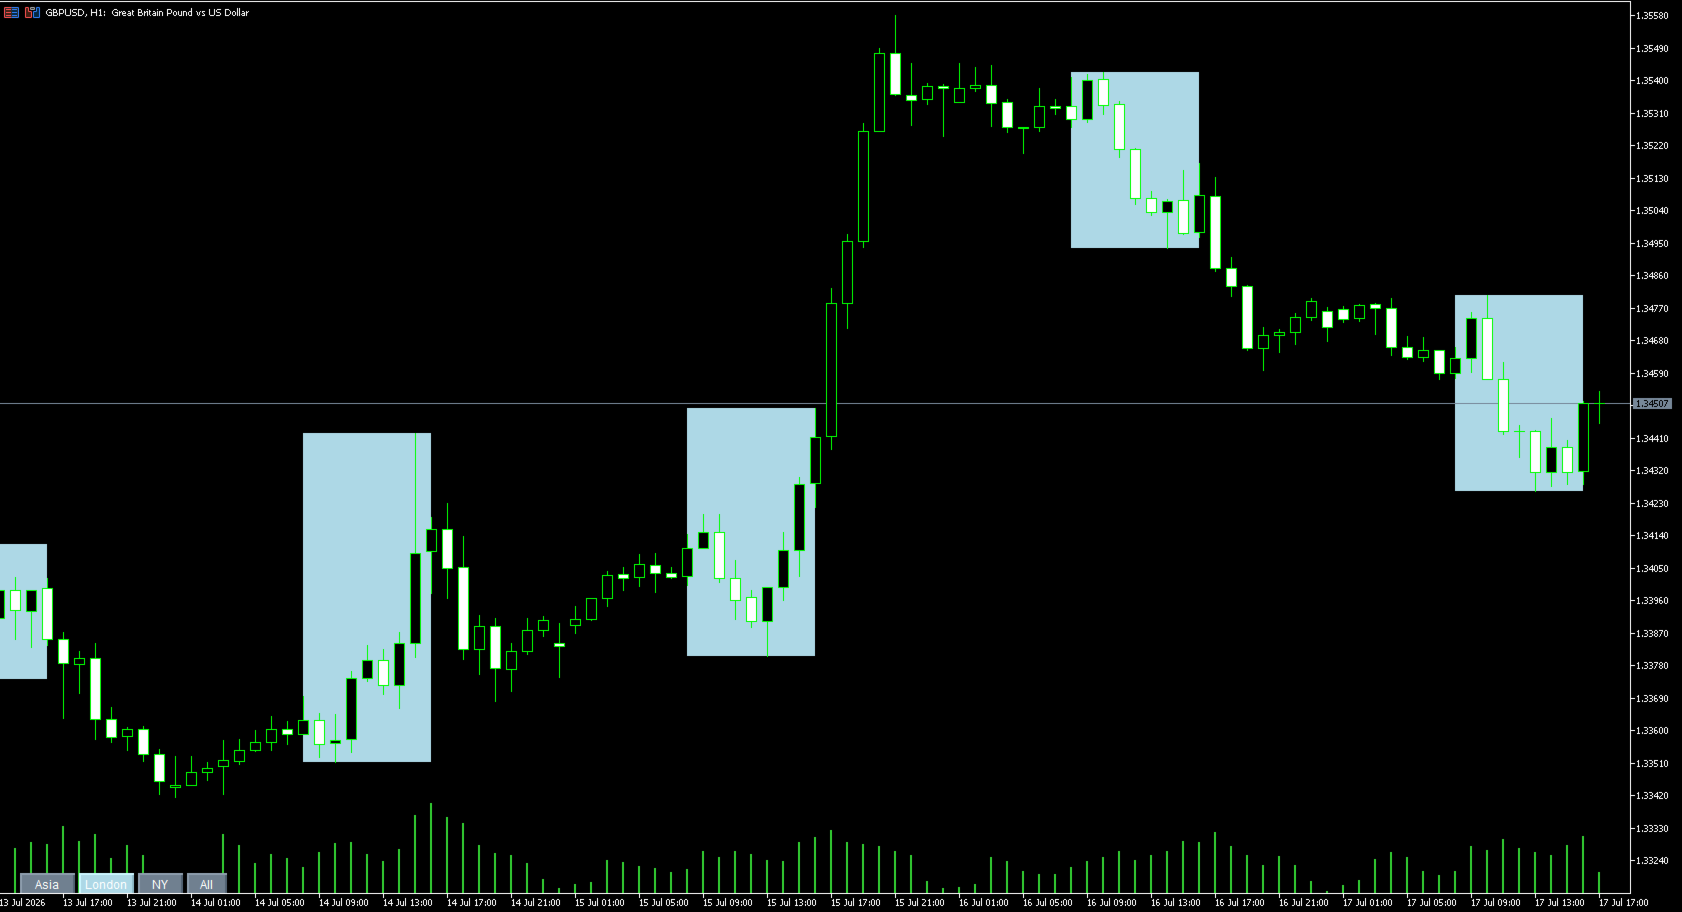
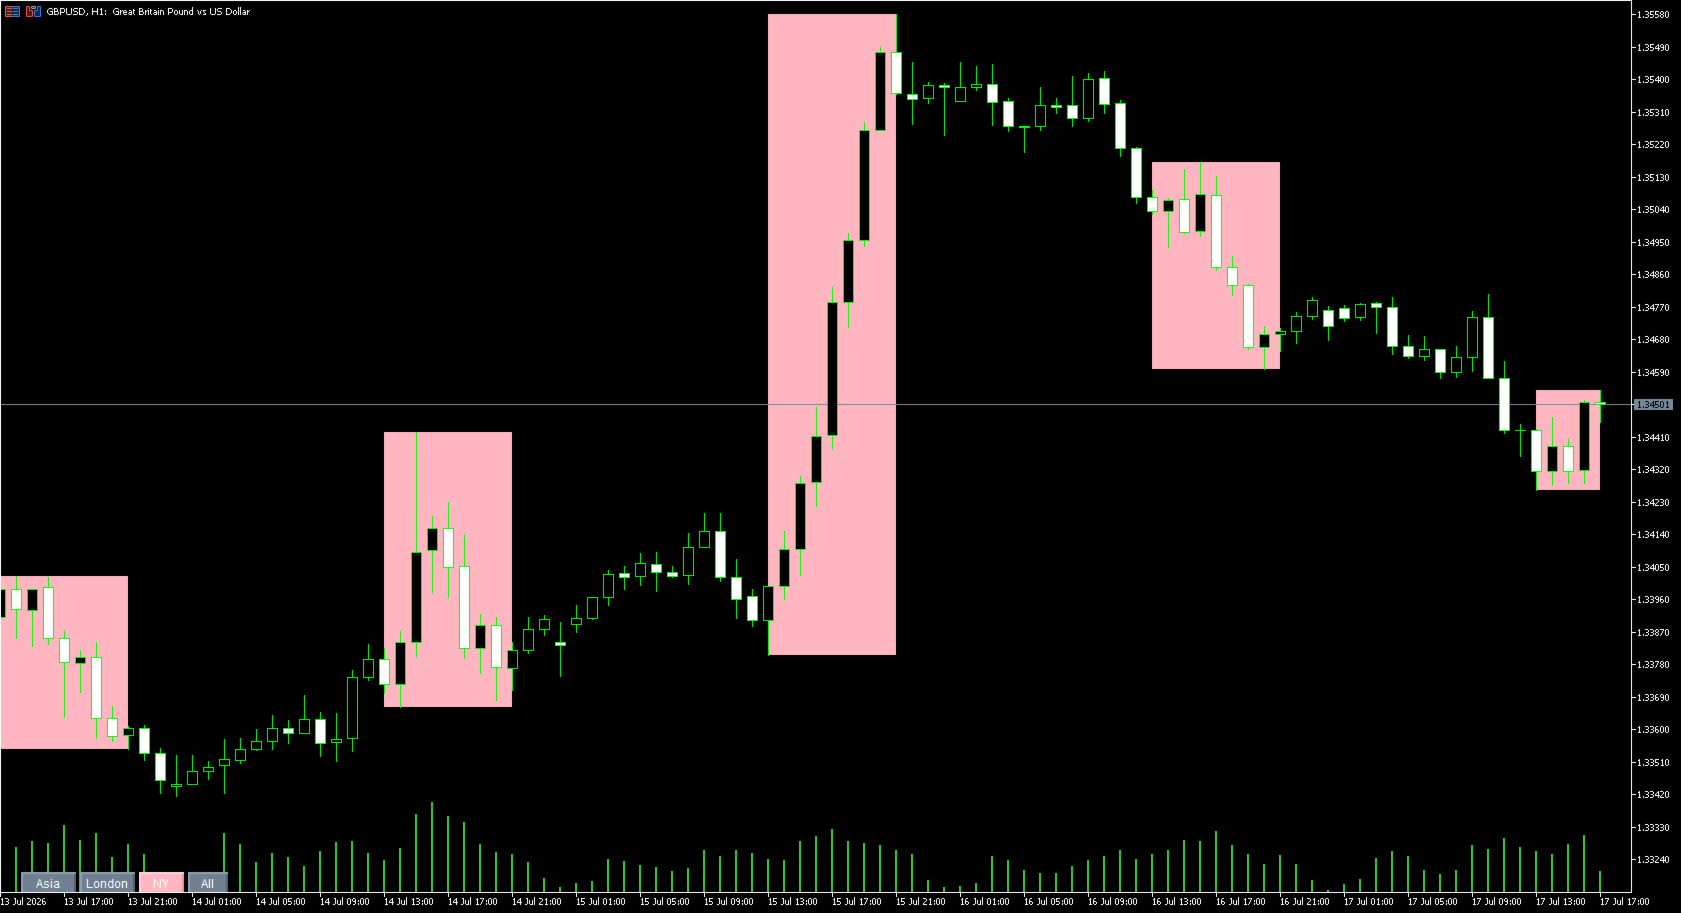
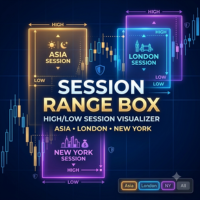
Session Range Box draws live, color-coded rectangles on your chart marking the high and low reached during the Asia, London, and New York trading sessions. As each session unfolds, its box grows in real time to reflect the range built so far, then locks in place once the session closes. A simple on-chart control panel lets you show or hide any session instantly, so you can study one session's range in isolation or view all three overlaid at once.
How It Works
- For each active session, the indicator scans the bars between the session's start and end hour (server time) and finds the highest high and lowest low reached.
- A colored rectangle is drawn spanning that time window at that price range, updating every 30 seconds while the session is still open.
- Once the session's end hour passes, the box stops updating and remains as a permanent visual record of that session's range for the day.
- History is kept for a configurable number of past days, so you can scroll back and compare how each session's range played out on previous days.
- Four buttons in the bottom corner of the chart, Asia, London, NY, and All, let you toggle each session's boxes on or off with a single click. The active button stays colored, the inactive ones turn gray.
Key Features
- Three independently configurable sessions with custom start/end hours and colors
- Live-updating range boxes while a session is in progress
- One-click show/hide per session, plus an All button to toggle everything at once
- Multi-day history so you can visually compare session ranges across recent days
- No trading operations: this is a pure visualization tool, it never opens, closes, or modifies any position
- Minimal footprint: just colored boxes and four small buttons, no bulky panel cluttering the chart
Inputs
Asia
- Show_Asia — enables the Asia session box on load
- Asia_StartHour — session start hour, server time (0-23)
- Asia_EndHour — session end hour, server time (0-23)
- Asia_Color — box color for the Asia session
London
- Show_London — enables the London session box on load
- London_StartHour — session start hour, server time (0-23)
- London_EndHour — session end hour, server time (0-23)
- London_Color — box color for the London session
New York
- Show_NewYork — enables the New York session box on load
- NY_StartHour — session start hour, server time (0-23)
- NY_EndHour — session end hour, server time (0-23)
- NY_Color — box color for the New York session
General
- Max_Days_History — number of past days to keep session boxes for
Control Panel
- Panel_Corner — chart corner the toggle buttons are anchored to
- Panel_X — horizontal offset of the buttons from the anchor corner
- Panel_Y — vertical offset of the buttons from the anchor corner
Recommended Setup
Works on any symbol and any timeframe. Session hours are set in your broker's server time, so check your broker's UTC offset once and adjust the start/end hour inputs to match the real Asia/London/New York windows. Note that this simple version does not support sessions that wrap past midnight server time.
Disclaimer
This tool performs visualization only and does not execute, modify, or close trades. Always confirm your broker's server time offset before relying on the session boundaries shown. Trading involves risk of loss.