Quantview Analytics Master
- 유틸리티
- 버전: 1.30
- 업데이트됨: 14 5월 2026
- 활성화: 5

LIMITED TIME OFFER for $59 for Unlimited use license
QuantView Analytics Master Advanced On-Chart Portfolio Diagnostics & Equity Forensics for MetaTrader 5
Standard MT5 history reports simply show you how much money was made or lost. QuantView Analytics Master is designed to answer the "Why" and the "How." By segmenting your trading history across four distinct analytical dimensions, this institutional-grade terminal allows algorithmic developers and quantitative traders to pinpoint the exact strengths, capital efficiencies, and critical failures of their Expert Advisors (EAs).
The dashboard completely bypasses the need for external web platforms by calculating advanced risk metrics—such as the Recovery Factor, Maximum Drawdown (in money), and real-time Floating P&L—directly on your live charts.
QuantView Analytics Master: The Ultimate User Guide & Workflow Manual can be found at https://www.mql5.com/en/blogs/post/769930
WHAT'S NEW IN THE LATEST VERSION
-
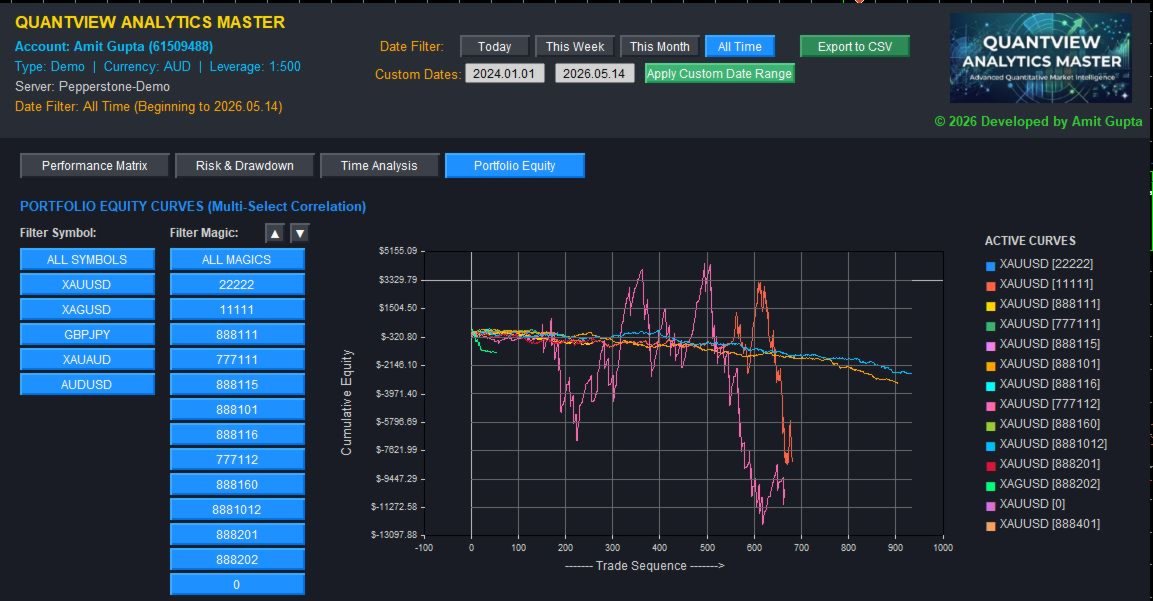
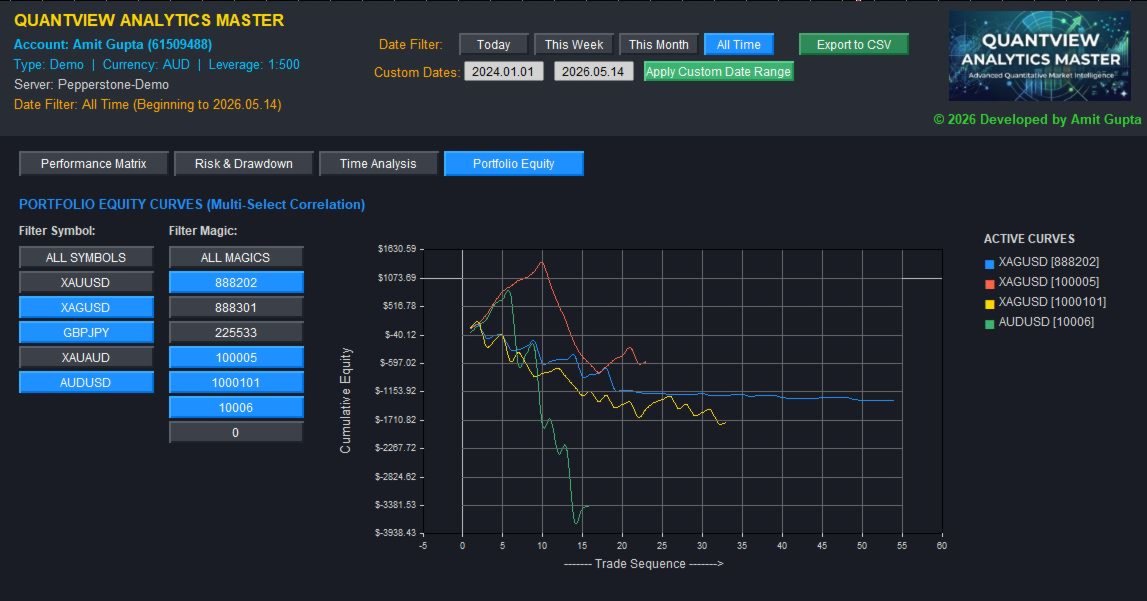
Dynamic Multi-Select Portfolio Equity (Tab 4): A state-of-the-art visual engine that plots overlapping equity curves for your portfolio. Features a dynamic, multi-select side panel allowing you to instantly isolate and correlate specific Symbols and Magic Numbers to see exactly how different EAs interact and compound your account's equity.
-
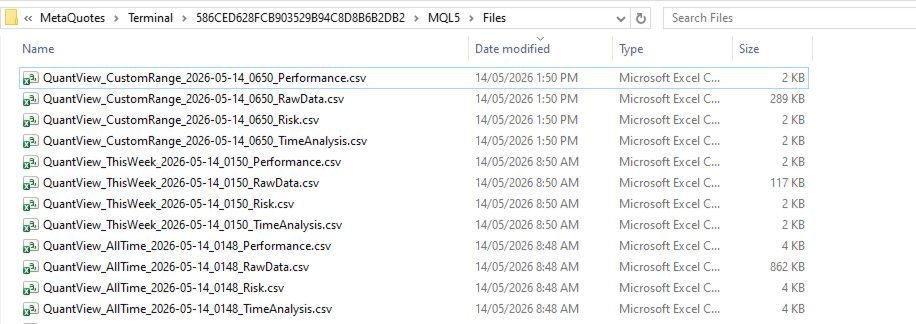
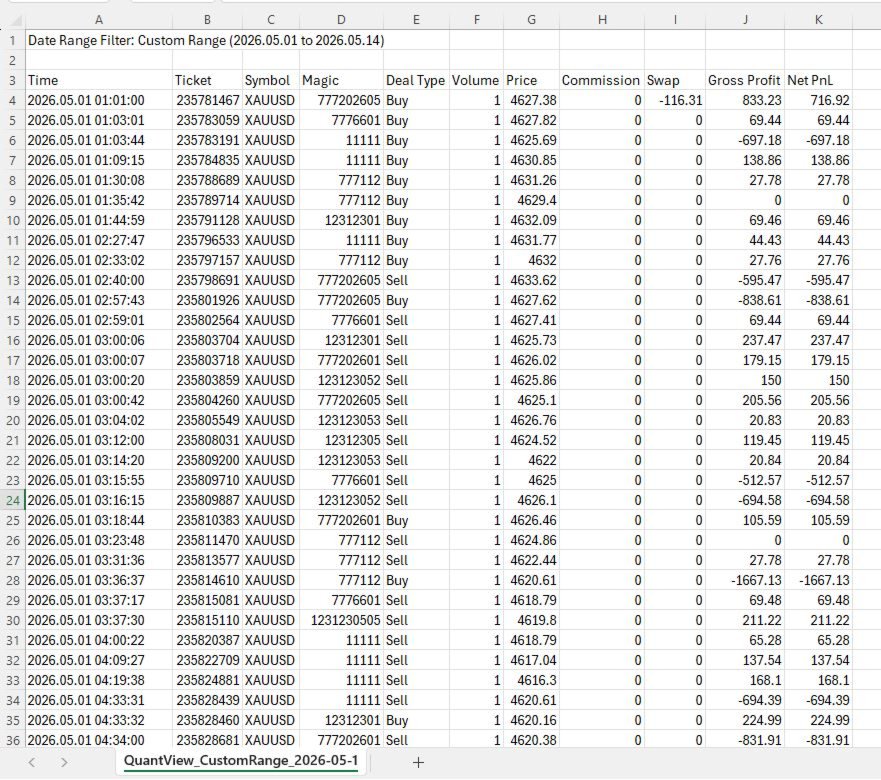
Institutional 4-File Data Dump: The export engine has been completely overhauled. A single click now generates 4 isolated CSV files natively routed to your MQL5/Files folder: Performance Matrix, Risk Metrics, Time Analysis, and a comprehensive Raw Tick/Deal Data dump for advanced external modeling in Python, Databricks, or Tableau.
Key Features & Analytical Dimensions:
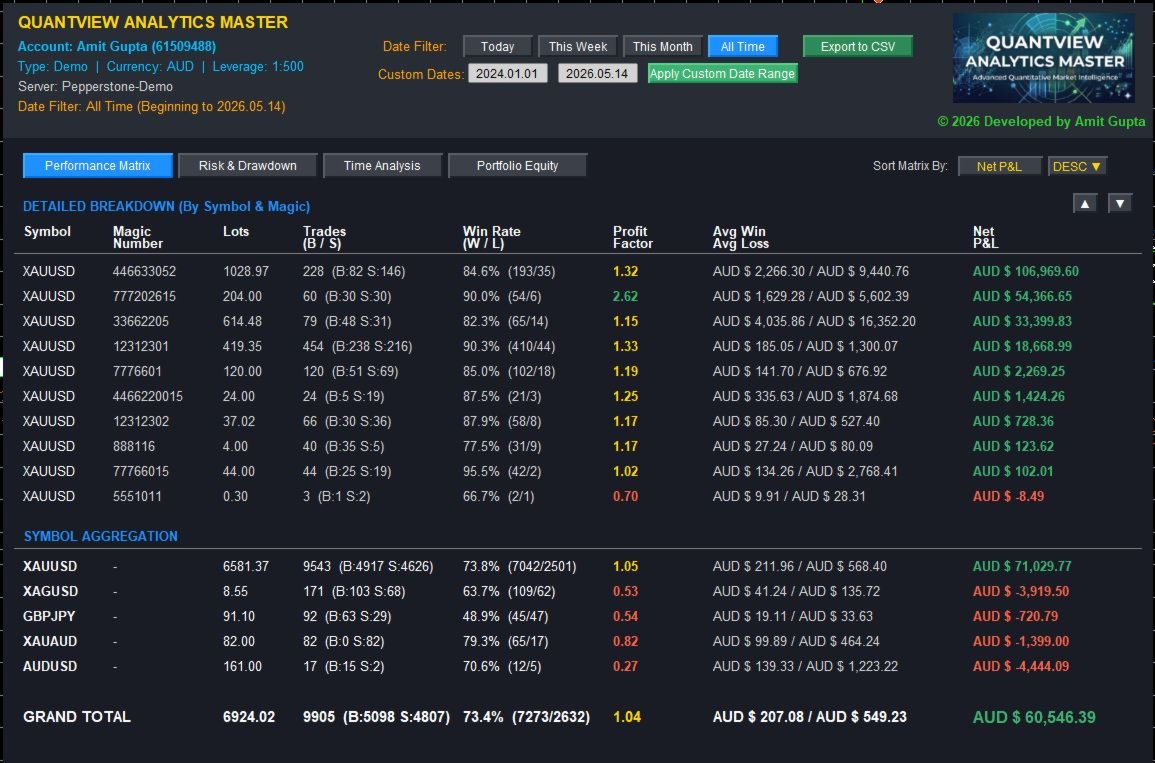
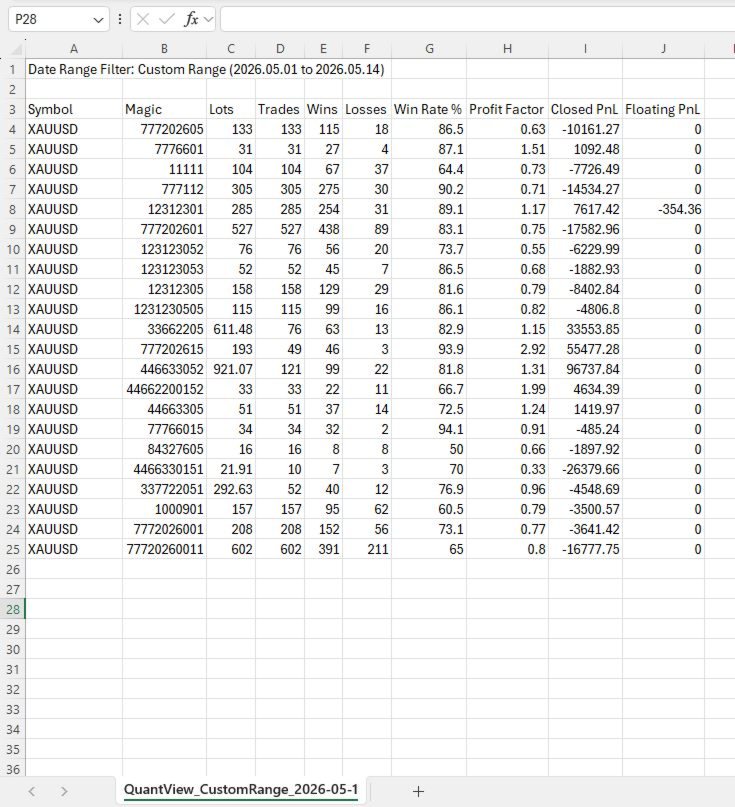
1. Performance Matrix (The "What")
-
Symbol & Magic Number Aggregation: Instantly see which EAs or which specific asset classes are dragging down your portfolio.
-
Win Rate & Profit Factor: Identify if an algorithm relies on a high win-rate scalping logic or a low win-rate trend-following logic.
-
Directional Bias: View the exact Buy vs. Sell ratio to spot malfunctioning trend filters.
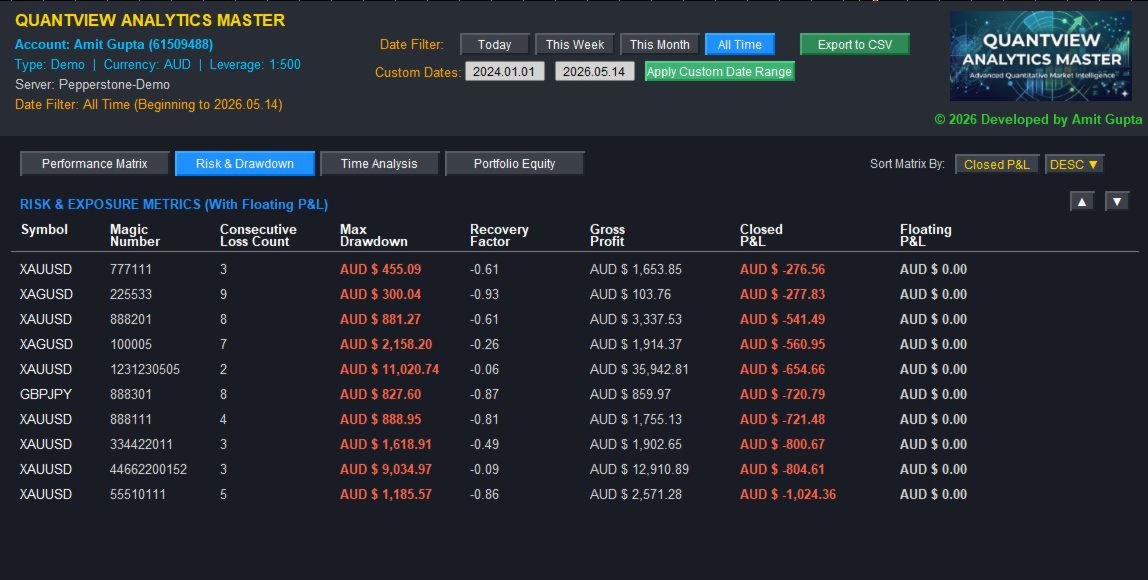
2. Risk & Exposure Metrics (The "Cost")
-
Live Floating P&L Integration: Monitor active, unrealized market exposure directly alongside historical closed P&L to catch malfunctioning grid or martingale EAs.
-
Maximum Drawdown: See the deepest historical equity dip experienced by a specific strategy before it recovered.
-
Recovery Factor: Rank your EAs by capital efficiency (Net P&L divided by Max Drawdown).
-
Consecutive Loss Tracking: Stress-test your risk parameters by knowing the absolute worst historical losing streak per Magic Number.
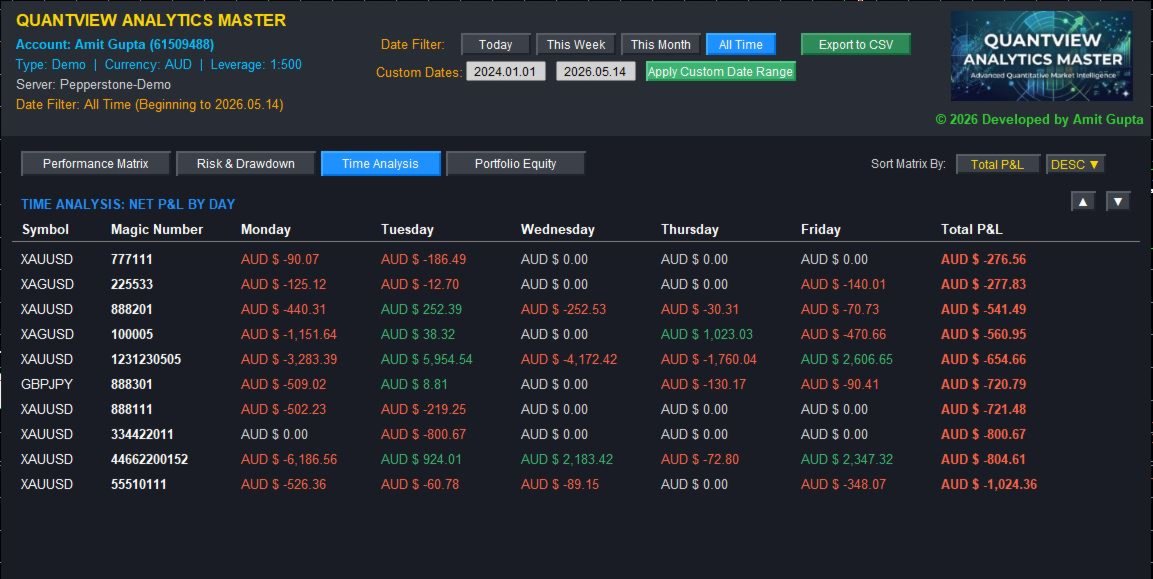
3. Time-of-Day Analysis (The "When")
-
Temporal Diagnostics: Net P&L is broken down by Day of the Week (Monday–Friday) for every specific Magic Number.
-
Surgical Scheduling: Identify structural flaws (e.g., bleeding capital every Friday) and use MT5's time settings to turn break-even robots into highly profitable ones.
4. Portfolio Equity Curves (The "Visual Correlation")
-
Bulletproof Visual Grid: Plots institutional-grade cumulative equity lines.
-
Cross-Strategy Correlation: Compare the visual drawdown phases of multiple Magic Numbers simultaneously to ensure your portfolio is properly diversified and not stacking risk during the same market conditions.
Interactive Terminal Controls:
-
Dynamic Date Filtering: Instantly slice historical data with Quick Filters [Today, This Week, This Month, All Time].
-
Custom Date Targeting: Seamlessly enter specific YYYY.MM.DD dates to analyze how your portfolio survived specific high-volatility news weeks.
-
Independent Memory Sorting: Reorganize matrices instantly by clicking the column headers. The dashboard remembers your sorting preferences independently for each tab.
-
Nuclear Wiping GUI Engine: Engineered to ensure zero ghost lines, artifacts, or chart bleeding when switching between deep analytical tabs.
Input Parameters:
-
Magic Number: Filter the terminal to analyze a specific EA on startup (leave as -1 to monitor the entire account).
-
Symbol: Filter by a specific asset on startup (leave blank for all assets).
-
Initial Sorting: Set your preferred default column and direction when the terminal initializes.
Take control of your portfolio forensics. QuantView Analytics Master exposes the hidden risk profile of your algorithms before they expose your capital.
(Note: This is a purely analytical dashboard and does not execute or manage live trades.)
User Note Regarding Updates Purchasing the QuantView Analytics Master Dashboard entitles you to all future updates, optimizations, and feature enhancements at no additional cost. We are committed to constantly refining the underlying logic and adding new quantitative capabilities to maintain the dashboard edge in evolving market conditions.
Important Legal Disclaimer
Risk Warning: Trading foreign exchange (Forex), contracts for difference (CFDs), cryptocurrencies, and other financial instruments on margin carries a high level of risk and may not be suitable for all investors. The high degree of leverage can work against you as well as for you. Before deciding to trade, you should carefully consider your investment objectives, level of experience, and risk appetite. You could sustain a loss of some or all of your initial investment and should not invest money that you cannot afford to lose.
No Financial Advice: QuantView Analytics Master is an analytical software tool designed to calculate and display mathematical metrics based on historical and live MetaTrader 5 data. It is not an automated trading robot, nor does it generate buy or sell signals. The developer, Amit Gupta, does not provide financial, investment, or trading advice. All metrics, data, and visualizations provided by this software are for educational and informational purposes only.
Past Performance: Past performance of any trading system or methodology is not necessarily indicative of future results. The user assumes full responsibility for any trading decisions made or actions taken based on the data provided by this dashboard.