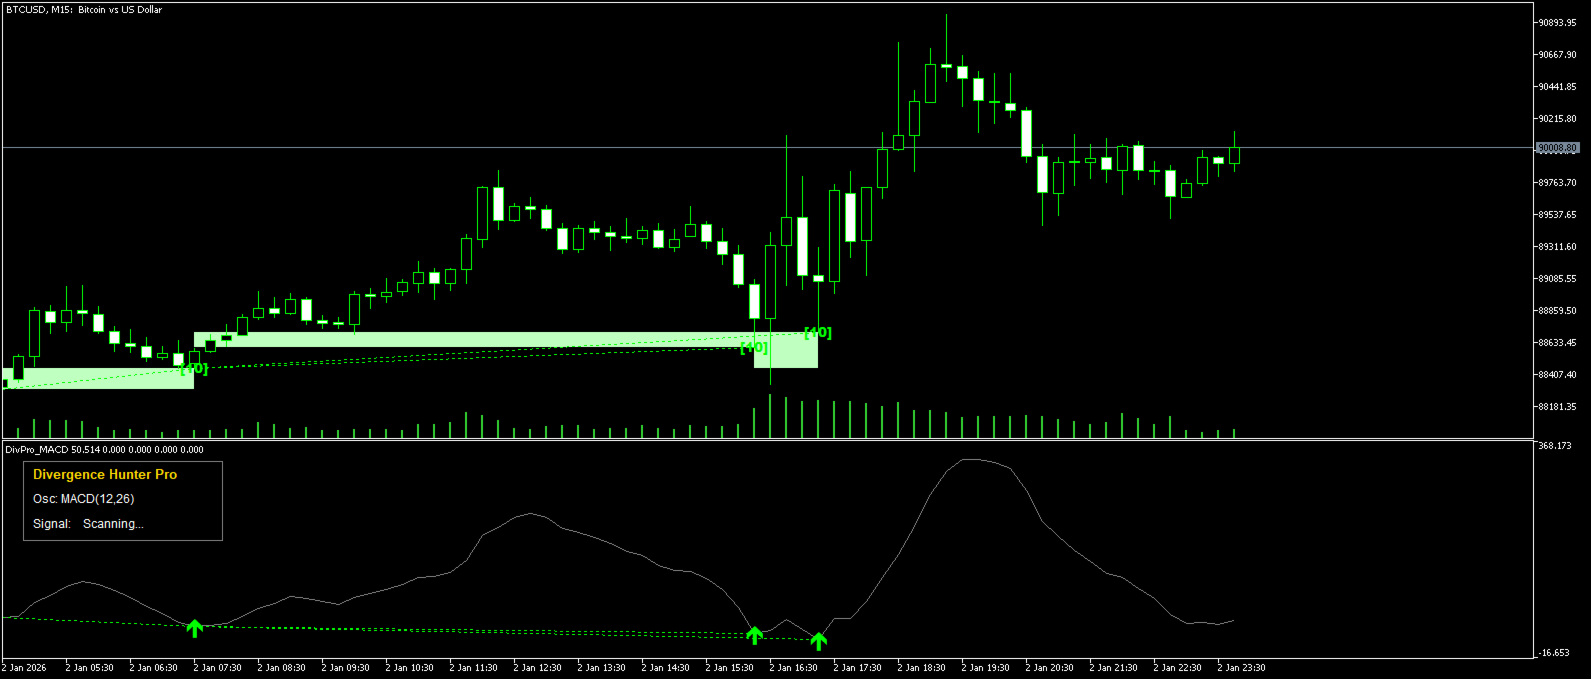
Divergence Hunter Pro
- 지표
-
Rizwan Akram
 I am a professional MQL4/MQL5 developer with strong experience in creating custom trading tools for Forex and Crypto traders. Over the past 9 years, I have developed indicators, Expert Advisors (EAs), scripts, and risk management dashboards for retail traders, prop firm traders, and trading
 - 버전: 3.0
- 업데이트됨: 5 1월 2026
==============================================================================
DIVERGENCE HUNTER PRO v2.01
Advanced Multi-Oscillator Divergence Detection System
==============================================================================
🎯 OVERVIEW
━━━━━━━━━━━━━━━━━━━━━━━━━━━━━━━━━━━━━━━━━━━━━━━━━━━━━━━━━━━━━━━━━━━━━━━━━━━━━
Divergence Hunter Pro is a professional-grade divergence detection indicator
that automatically identifies high-probability trading opportunities using
advanced multi-factor confluence analysis. Unlike basic divergence indicators,
this tool combines oscillator divergence with Volume Confirmation, Support/
Resistance levels, Candle Patterns, and Multi-Timeframe analysis to filter
out weak signals and highlight only the strongest setups.
✅ Works on ALL timeframes (M1 to MN)
✅ Works on ALL instruments (Forex, Crypto, Stocks, Indices, Commodities)
✅ Non-repainting signals
✅ Real-time alerts (Pop-up, Push, Email)
✅ Auto SL/TP calculation with visual levels
🔥 KEY FEATURES
━━━━━━━━━━━━━━━━━━━━━━━━━━━━━━━━━━━━━━━━━━━━━━━━━━━━━━━━━━━━━━━━━━━━━━━━━━━━━
📊 6 OSCILLATOR OPTIONS
• RSI (Relative Strength Index)
• MACD (Moving Average Convergence Divergence)
• Stochastic
• CCI (Commodity Channel Index)
• Momentum
• Awesome Oscillator
📈 4 DIVERGENCE TYPES DETECTED
• Regular Bullish (Trend Reversal - Buy Signal)
• Regular Bearish (Trend Reversal - Sell Signal)
• Hidden Bullish (Trend Continuation - Buy Signal)
• Hidden Bearish (Trend Continuation - Sell Signal)
⚡ ADVANCED PIVOT DETECTION
• Standard Method (classic swing high/low)
• ZigZag Method (more accurate pivots with customizable depth)
🎯 DIVERGENCE STRENGTH SCORE (1-10)
Each signal is rated based on:
• Price movement depth
• Oscillator divergence angle
• Bar distance quality
• Confluence bonuses (+Vol, +SR, +Pattern, +HTF, +2Osc)
🛡️ CONFLUENCE FILTERS
━━━━━━━━━━━━━━━━━━━━━━━━━━━━━━━━━━━━━━━━━━━━━━━━━━━━━━━━━━━━━━━━━━━━━━━━━━━━━
📈 VOLUME CONFIRMATION
• Filters signals with volume spikes above moving average
• Customizable period and spike multiplier
• Shows "+Vol" tag when volume confirms
🎯 SUPPORT/RESISTANCE CONFLUENCE
• Checks if divergence occurs at key S/R levels
• Bullish divergence at Support = Higher probability
• Bearish divergence at Resistance = Higher probability
• Shows "+SR" tag when at key level
🕯️ CANDLE PATTERN CONFIRMATION
• Detects Pin Bar (Hammer/Shooting Star)
• Detects Engulfing patterns
• Shows "+Pin", "+Eng", "+Star" tags
📊 MULTI-TIMEFRAME ANALYSIS
• Checks for divergence on Higher Timeframe
• Trade with the bigger picture trend
• Shows "+HTF" tag when HTF confirms
🔄 MULTI-OSCILLATOR CONFLUENCE
• Uses second oscillator for confirmation
• RSI + MACD, Stochastic + CCI, etc.
• Shows "+2Osc" tag when both agree
💰 AUTO TRADING LEVELS
━━━━━━━━━━━━━━━━━━━━━━━━━━━━━━━━━━━━━━━━━━━━━━━━━━━━━━━━━━━━━━━━━━━━━━━━━━━━━
📍 ENTRY / SL / TP LINES
• Clear visual lines with price labels
• Entry = Signal candle close
• SL = Below/Above pivot with buffer
• TP = Based on Risk:Reward ratio (default 1:2)
• Shows pips distance for easy reference
🎯 FIBONACCI PRICE TARGETS
• T1 = 0.618 extension (Gold line)
• T2 = 1.0 extension (Orange line)
• T3 = 1.618 extension (Magenta line)
• All ratios customizable
🎨 VISUAL FEATURES
━━━━━━━━━━━━━━━━━━━━━━━━━━━━━━━━━━━━━━━━━━━━━━━━━━━━━━━━━━━━━━━━━━━━━━━━━━━━━
• Divergence lines on both Price chart and Indicator window
• Color-coded zones highlighting divergence areas
• Strength labels [1-10] at signal points
• Clean dashboard showing current signal status
• Fully customizable colors for all elements
• Adjustable line width and zone opacity
🔔 ALERT SYSTEM
━━━━━━━━━━━━━━━━━━━━━━━━━━━━━━━━━━━━━━━━━━━━━━━━━━━━━━━━━━━━━━━━━━━━━━━━━━━━━
• Pop-up alerts on screen
• Push notifications to mobile
• Email alerts
• Alert message includes: Divergence type, Strength score, Confluence tags
📋 INPUT PARAMETERS
━━━━━━━━━━━━━━━━━━━━━━━━━━━━━━━━━━━━━━━━━━━━━━━━━━━━━━━━━━━━━━━━━━━━━━━━━━━━━
GENERAL SETTINGS
• Oscillator Type: RSI / MACD / Stochastic / CCI / Momentum / AO
• Divergence Type: Regular Only / Hidden Only / Both
• Lookback Range: Number of bars to scan (default: 300)
• Minimum Bars Between Pivots: Avoid false signals (default: 5)
PIVOT DETECTION
• Method: Standard / ZigZag
• ZigZag Depth, Deviation, Backstep parameters
DIVERGENCE QUALITY
• Show Strength Score: true/false
• Minimum Strength: Filter weak signals (1-10)
VOLUME CONFIRMATION
• Enable/Disable
• MA Period and Spike Multiplier
S/R CONFLUENCE
• Enable/Disable
• Lookback bars and Tolerance %
AUTO SL/TP LEVELS
• Enable/Disable
• Risk:Reward Ratio
• SL Buffer in points
CANDLE PATTERN CONFIRMATION
• Enable/Disable
• Require Pattern for Signal
DIVERGENCE ZONES
• Show/Hide zones
• Zone Opacity (0-100%)
PRICE TARGET PROJECTIONS
• Enable/Disable
• Target 1, 2, 3 Fibonacci ratios
MULTI-TIMEFRAME ANALYSIS
• Enable/Disable
• Higher Timeframe selection
• Require HTF Confluence
MULTI-OSCILLATOR CONFLUENCE
• Enable/Disable
• Secondary Oscillator selection
• Require Both Oscillators
INDIVIDUAL OSCILLATOR SETTINGS
• RSI: Period, Applied Price
• MACD: Fast, Slow, Signal, Applied Price
• Stochastic: K, D, Slowing, Method, Price Field
• CCI: Period, Applied Price
• Momentum: Period, Applied Price
ALERTS
• Pop-up, Push, Email toggles
VISUAL SETTINGS
• Colors for all divergence types
• Dashboard background and text colors
• Line width
📈 HOW TO USE
━━━━━━━━━━━━━━━━━━━━━━━━━━━━━━━━━━━━━━━━━━━━━━━━━━━━━━━━━━━━━━━━━━━━━━━━━━━━━
1. Apply indicator to any chart
2. Wait for divergence signal (arrow on oscillator)
3. Check strength score - higher is better [7+]
4. Look for confluence tags (+Vol, +SR, +HTF, etc.)
5. Use the auto-generated Entry/SL/TP levels
6. Manage your trade accordingly
💡 PRO TIP: Best results when multiple confluence factors align!
Example: "Reg Bull [8] +Vol +SR +Pin" = Very strong signal
⚠️ RECOMMENDATIONS
━━━━━━━━━━━━━━━━━━━━━━━━━━━━━━━━━━━━━━━━━━━━━━━━━━━━━━━━━━━━━━━━━━━━━━━━━━━━━
• Use on H1 timeframe or higher for best results
• Combine with your own analysis (trend, news, etc.)
• Start with default settings, then customize
• Filter signals with Minimum Strength = 5+ for quality
• Enable S/R Confluence for higher win rate
• Always use proper risk management
🆕 VERSION HISTORY
━━━━━━━━━━━━━━━━━━━━━━━━━━━━━━━━━━━━━━━━━━━━━━━━━━━━━━━━━━━━━━━━━━━━━━━━━━━━━
v2.01 - Current Release
• Improved SL/TP visualization with labels
• Short lines instead of full-width
• Color-coded price targets
• Better strength label visibility
• Optimized default settings
v2.00
• Added Multi-Timeframe Analysis
• Added Multi-Oscillator Confluence
• Added Divergence Zones
• Added Price Target Projections
• Added Candle Pattern Confirmation
• Added Volume Confirmation
• Added S/R Confluence Check
• Added Auto SL/TP Levels
• Added Strength Scoring System
• Added ZigZag Pivot Detection
v1.00
• Initial release with basic divergence detection
📧 SUPPORT
━━━━━━━━━━━━━━━━━━━━━━━━━━━━━━━━━━━━━━━━━━━━━━━━━━━━━━━━━━━━━━━━━━━━━━━━━━━━━
For questions, feature requests, or support:
• Leave a comment on the product page
• Contact via MQL5 message
Thank you for choosing Divergence Hunter Pro!
Trade Smart. Trade Safe. 📈
==============================================================================
Copyright © 2025 Rizwan Akram
All Rights Reserved
==============================================================================