MACD Titanium
- 지표
-
Donovan Tjin-a-tak
 구조적이고 규칙 기반의 거래 전략에 집중하는 트레이더이자 시스템 개발자입니다.
MT5 및 TradingView(Pine Script)를 위한 견고한 트레이딩 도구를 개발하며, 명확성, 효율성, 그리고 실제 시장 환경에 적합한 설계를 지향합니다.
저의 주요 목표는 자체 제품 라인 아래 전문적인 거래 도구를 개발하는 것입니다. 또한, 진지한 프로젝트에 한해 MT5 및 Pine Script 맞춤 개발을 제공합니다.
과장된 홍보나 비현실적인 약속은 하지 않습니다 — 실질적이고 신뢰할 수 있는 실행 지원만을 제공합니다. - 버전: 1.10
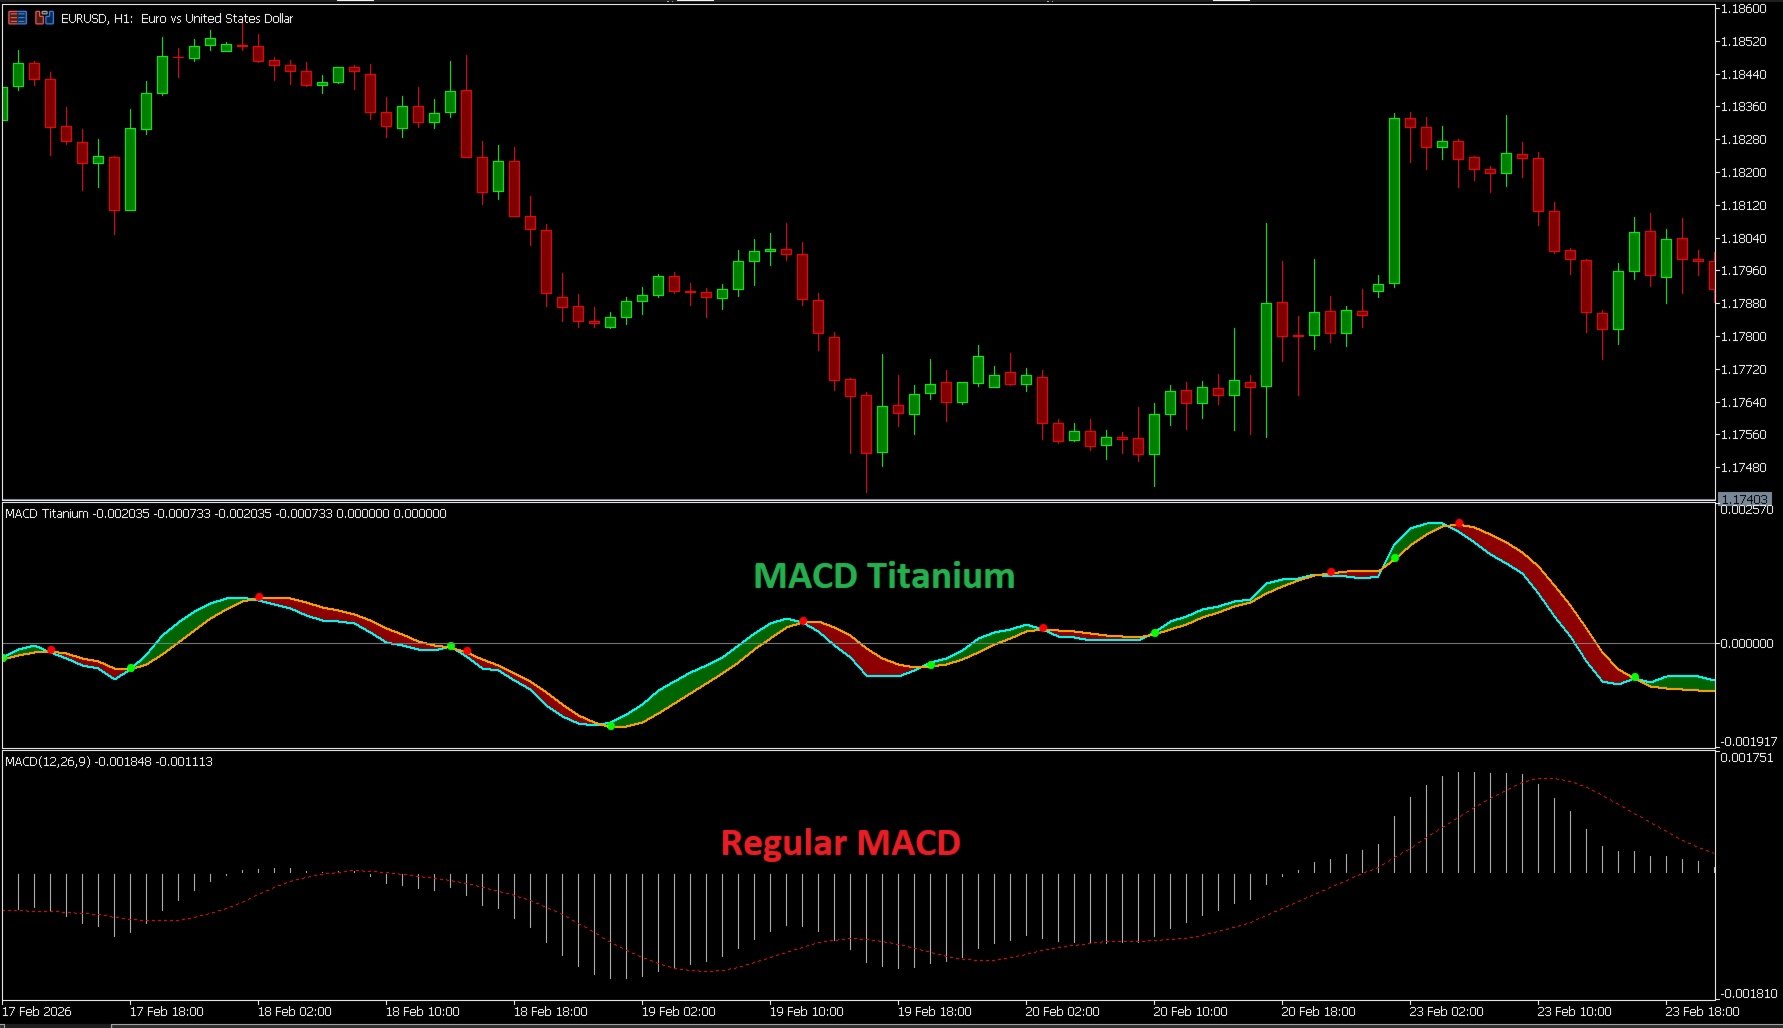
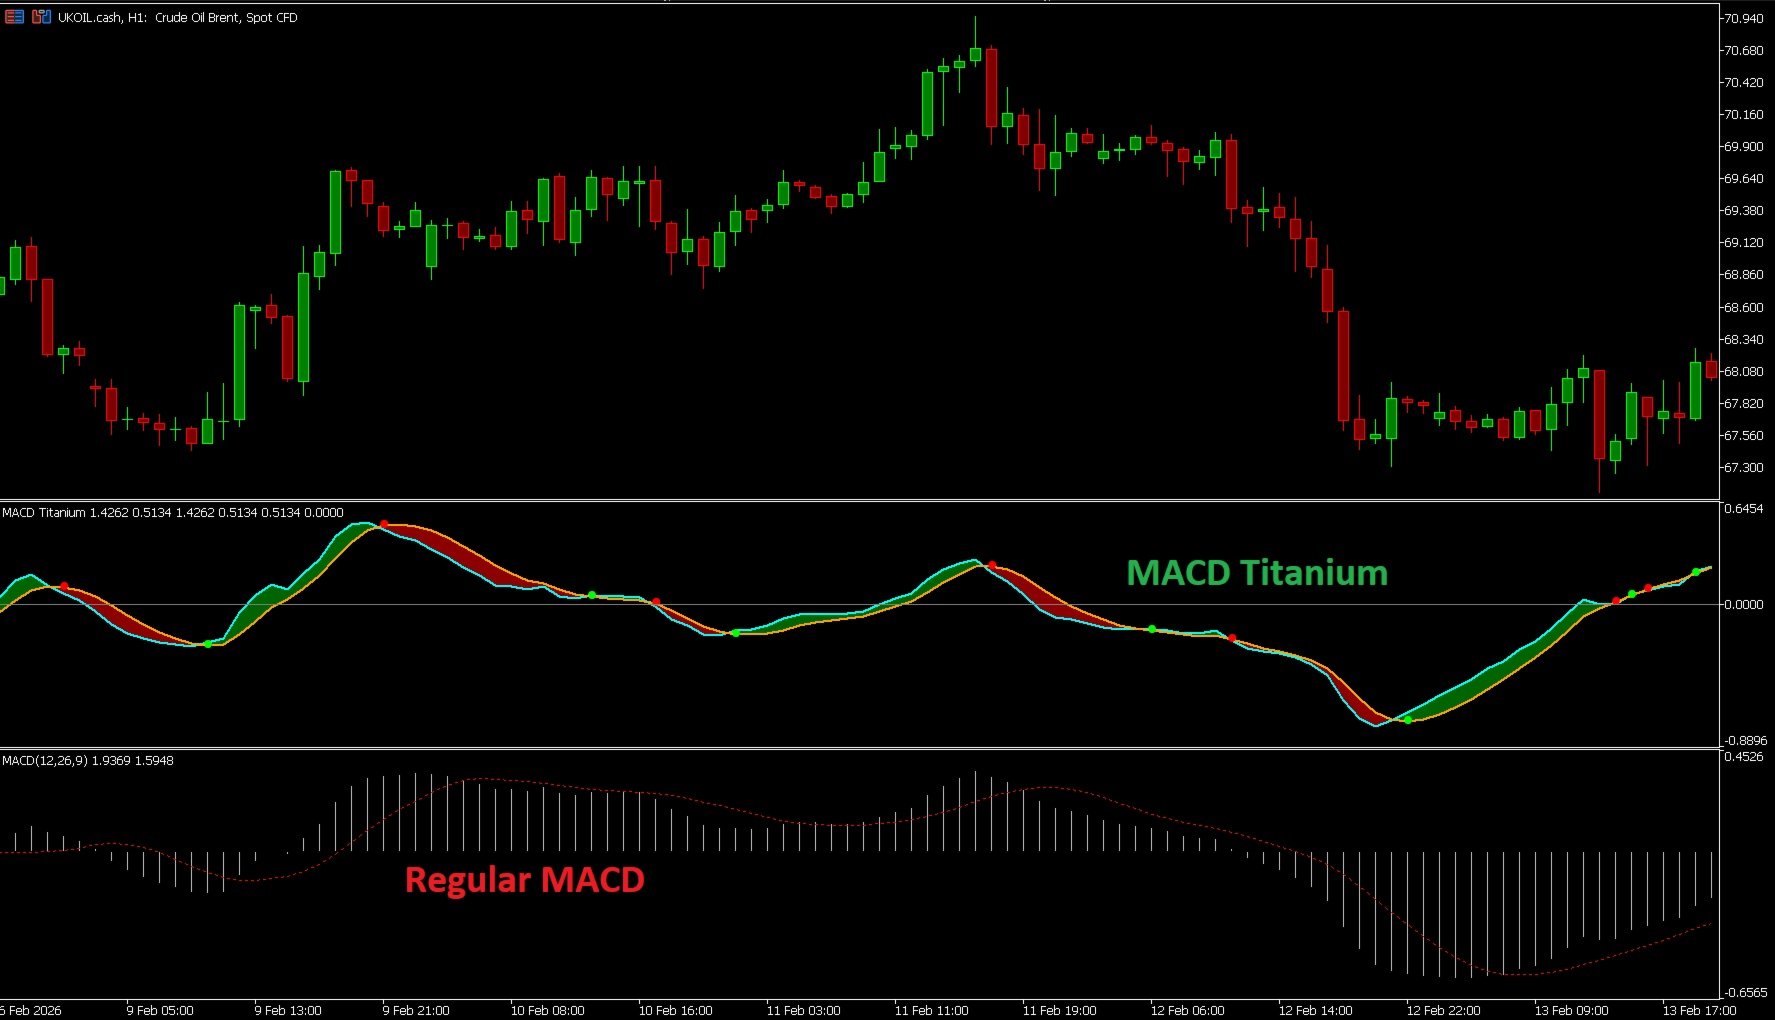
MACD Titanium은 MetaTrader 5용 Zero-Lag MACD 지표로, 기존 MACD보다 더 빠르고 명확한 모멘텀 신호를 제공합니다.
Zero-Lag EMA 계산 방식을 사용하여 신호 지연을 줄이고 시장 모멘텀 변화에 더욱 빠르게 반응하면서도, 전통적인 MACD 구조를 유지합니다.
차별점
• Zero-Lag EMA 사용
• 모멘텀 변화에 빠른 반응
• 교차 지점을 명확히 표시
• 동적 배경 색상으로 현재 방향성 표시
• 모든 시간대와 종목에서 사용 가능
리페인트 없음.
모든 계산은 실시간 수행.
시각적 구조
아쿠아 라인 – MACD
오렌지 라인 – 시그널
녹색 점 – 상승 교차
빨간 점 – 하락 교차
배경 색상 – 현재 모멘텀 방향
녹색 = 상승 우세
빨간색 = 하락 우세
명확성을 중심으로 설계되었습니다.
MACD Titanium Pro가 곧 출시됩니다 — 알림 기능, 멀티 타임프레임 분석 및 고급 다이버전스 감지 기능이 포함됩니다.
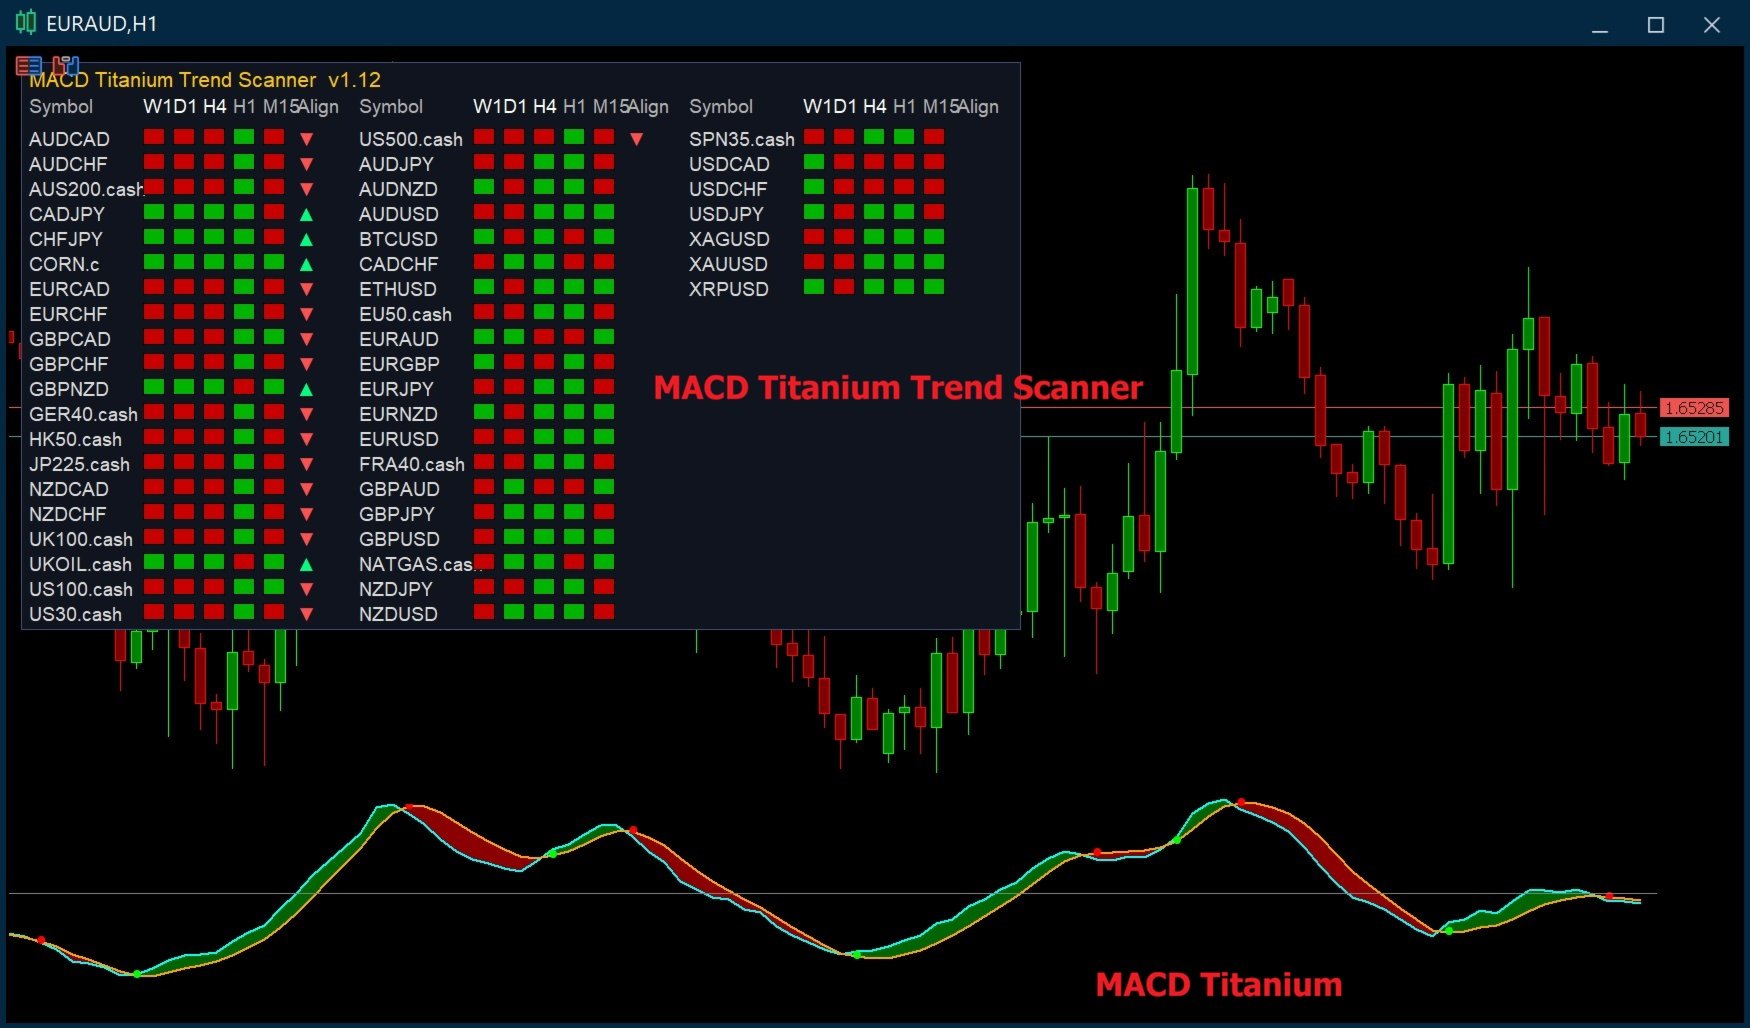
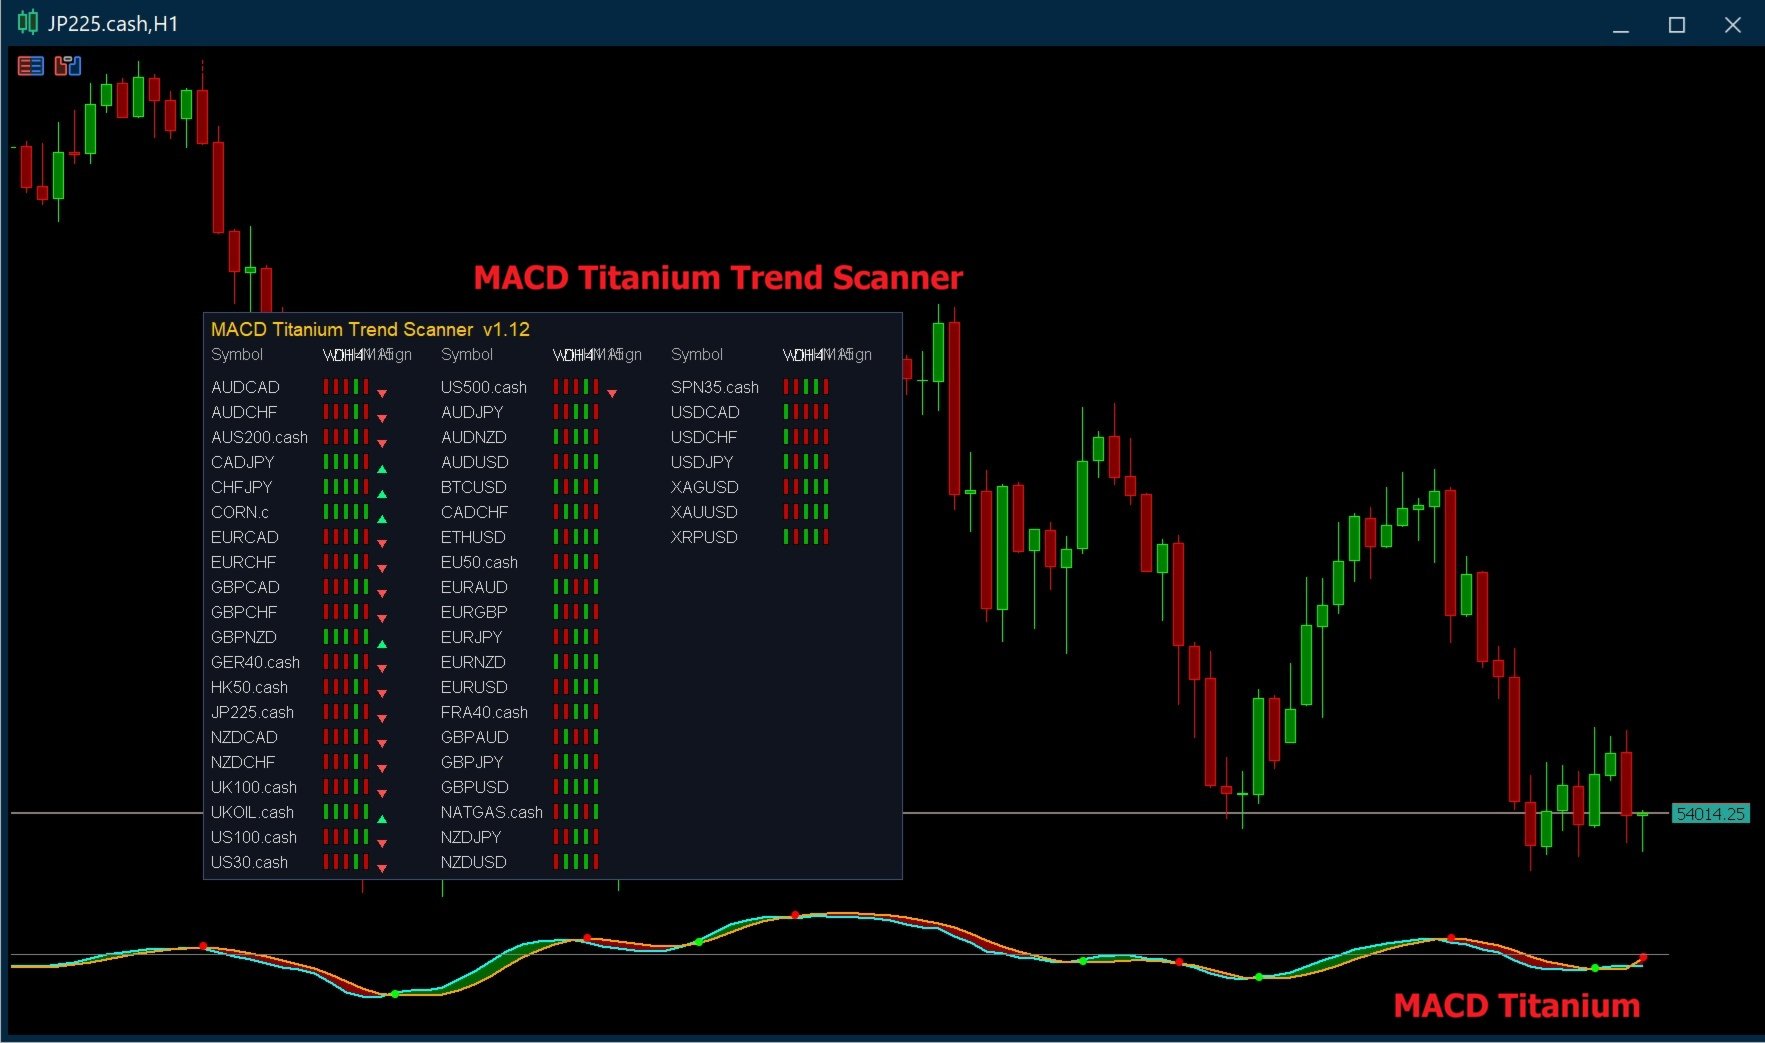
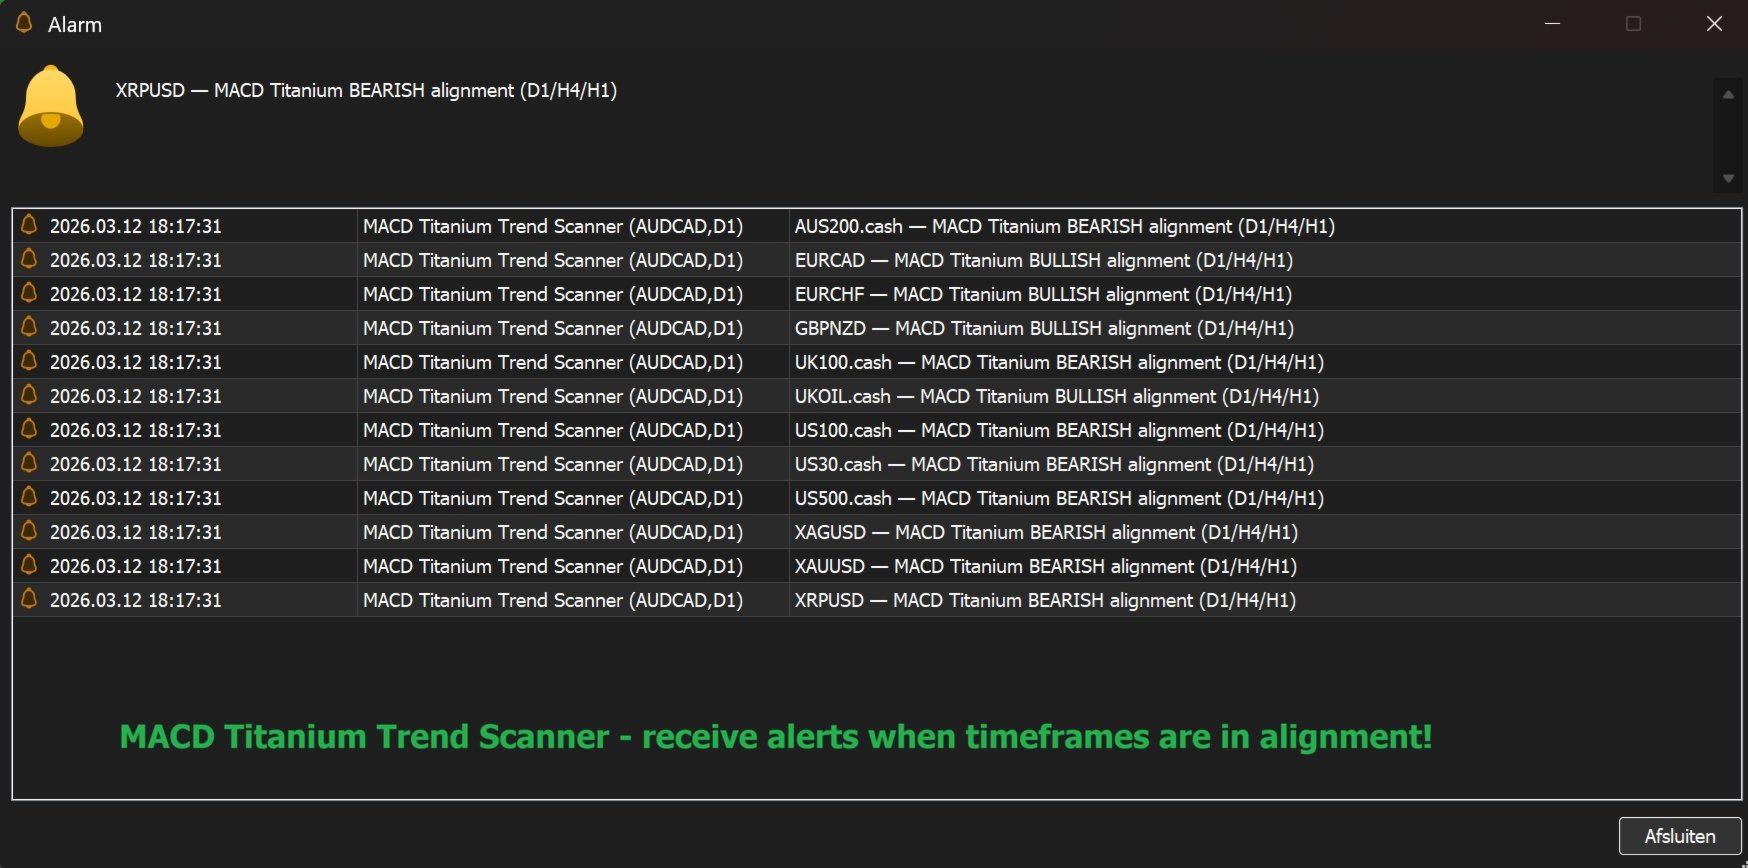
MACD Titanium Trend Scanner와 함께 사용
MACD Titanium은 MACD Titanium Trend Scanner와 함께 사용할 수 있습니다.
이 강력한 시장 스캐너는 여러 시간 프레임에서 MACD Titanium 추세 정렬을 자동으로 감지합니다.
스캐너는 전체 Market Watch를 분석하여 강한 추세가 형성되는 시장을 즉시 표시합니다.
지원 시간 프레임:
• W1
• D1
• H4
• H1
• M15
이를 통해 트레이더는 강한 추세 기회를 빠르게 찾을 수 있습니다.
MACD Titanium Trend Scanner는 동일한 작성자로부터 다운로드할 수 있습니다.
이 지표가 유용하다고 생각하신다면 리뷰를 남겨 주시기 바랍니다. 여러분의 피드백은 다른 트레이더들이 이 도구를 발견하는 데 도움이 됩니다.
사용자가 평가에 대한 코멘트를 남기지 않았습니다